 Catalogue PIGMA
Ifremer
Type of resources
Available actions
Topics
Keywords
Contact for the resource
Provided by
Years
Formats
Representation types
Update frequencies
status
Service types
Scale
Resolution
-

As part of the European Horizon Europe FOCCUS project (https://foccus-project.eu/), the metadata inventory of European coastal platforms has been extracted. The inventory was based on the following History and Latest products, downloaded from the CMEMS website (https://marine.copernicus.eu/fr/acces-donnees) at: 1) Global Ocean-In-Situ Near-Real-Time Observation, 2) Atlantic Iberian Biscay Irish Ocean-In-Situ Near Real Time Observations, 3) Mediterranean Sea-In-Situ Near Real Time Observations, 4) Atlantic-European North West Shelf-Ocean In-Situ Near Real Time Observations. To carry out this inventory, it was decided to target only coastal platforms, located less than 200km from the coast and at a depth of less than 400m. For mobile platforms, it was also decided to focus only on the first position in the file. This data must be located within 200 km of the coast and at a depth of less than 400 m. In this inventory, FerryBox platforms have all been considered as coastal platforms. The following platforms were extracted from the products: BO (Bottles), CT (CTD), DB (Drifting Buoys), FB (Ferry Box), GL (Gliders), HF (High Frequency Radar), MO (Mooring), PF (Profiling Float), TG (Tide Gauge) and XB (XBT). Once the metadata had been extracted from the files, duplicates were removed (files with the same names). Duplicate platforms of type _TS_ and _WS_ were merged (date and parameters). Latest‘ files have been merged with ’History" files. Missing metadata have been replaced in the Excel file by ‘Missing Data’. Some old dates were also revised by hand because they had been badly extracted, as well as some institution names that included special characters. Platforms located on estuaries/rivers/lakes/ponds have also been removed by hand. This inventory identified a total of 10,479 coastal platforms.
-

Google Earth Engine combines a multi-petabyte catalog of satellite imagery and geospatial datasets with planetary-scale analysis capabilities. Scientists, researchers, and developers use Earth Engine to detect changes, map trends, and quantify differences on the Earth's surface. Earth Engine is now available for commercial use, and remains free for academic and research use.
-
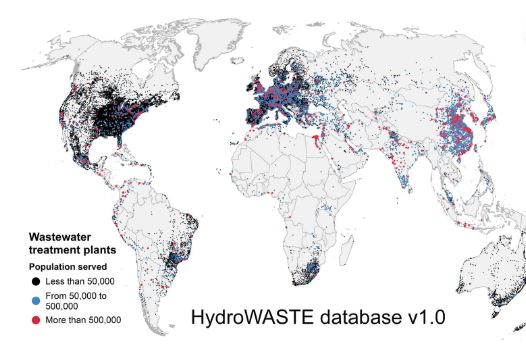
HydroWASTE is a spatially explicit global database of 58,502 wastewater treatment plants (WWTPs) and their characteristics. This database was developed by combining national and regional datasets with auxiliary information to derive or complete missing characteristics, including the amount of people served, the flow rate of effluents, and the level of treatment of processed wastewater. The HydroSHEDS river network with streamflow estimates was used to geo-reference plant outfall locations and to assess the distribution of wastewaters at a global scale. All wastewater treatment plants are co-registered to the global river network of the HydroRIVERS database via their estimated outfall locations.
-
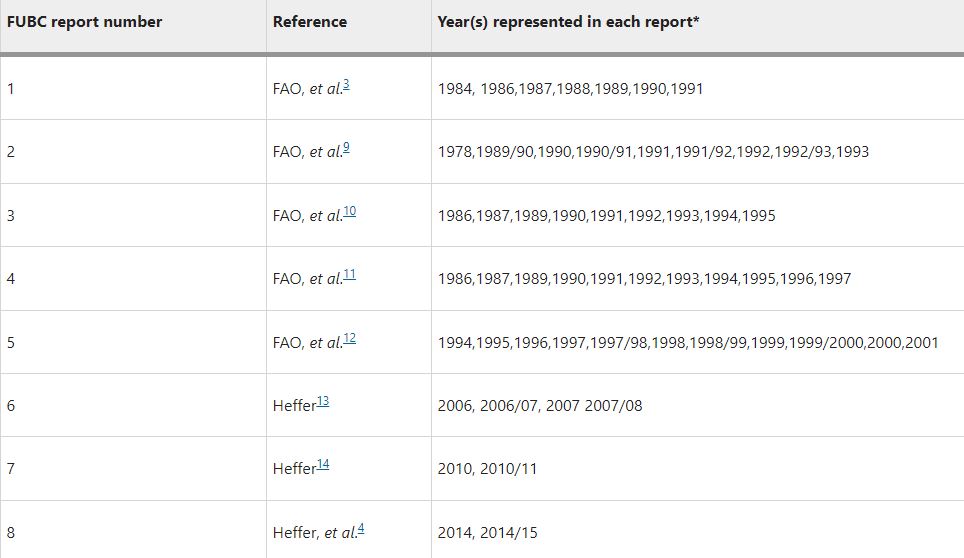
Understanding how much inorganic fertilizer (referred to as fertilizer) is applied to different crops at national, regional and global levels is an essential component of fertilizer consumption analysis and demand projection. Good information on fertilizer use by crop (FUBC) is rarely available because it is difficult to collect and time-consuming to process and validate. To fill this gap, a first global FUBC report was published in 1992 for the 1990/1991 period, based on an expert survey conducted jointly by the Food and Agriculture Organization (FAO) of the UN, the International Fertilizer Development Center (IFDC) and the International Fertilizer Association (IFA). Since then, similar expert surveys have been carried out and published every two to four years in the main fertilizer-consuming countries. Since 2008 IFA has led these efforts and, to our knowledge, remains the only globally available data set on FUBC. This dataset includes data (in CSV format) from a survey carried out by IFA to represent the 2017–18 period as well as a collation of all historic FUBC data.
-
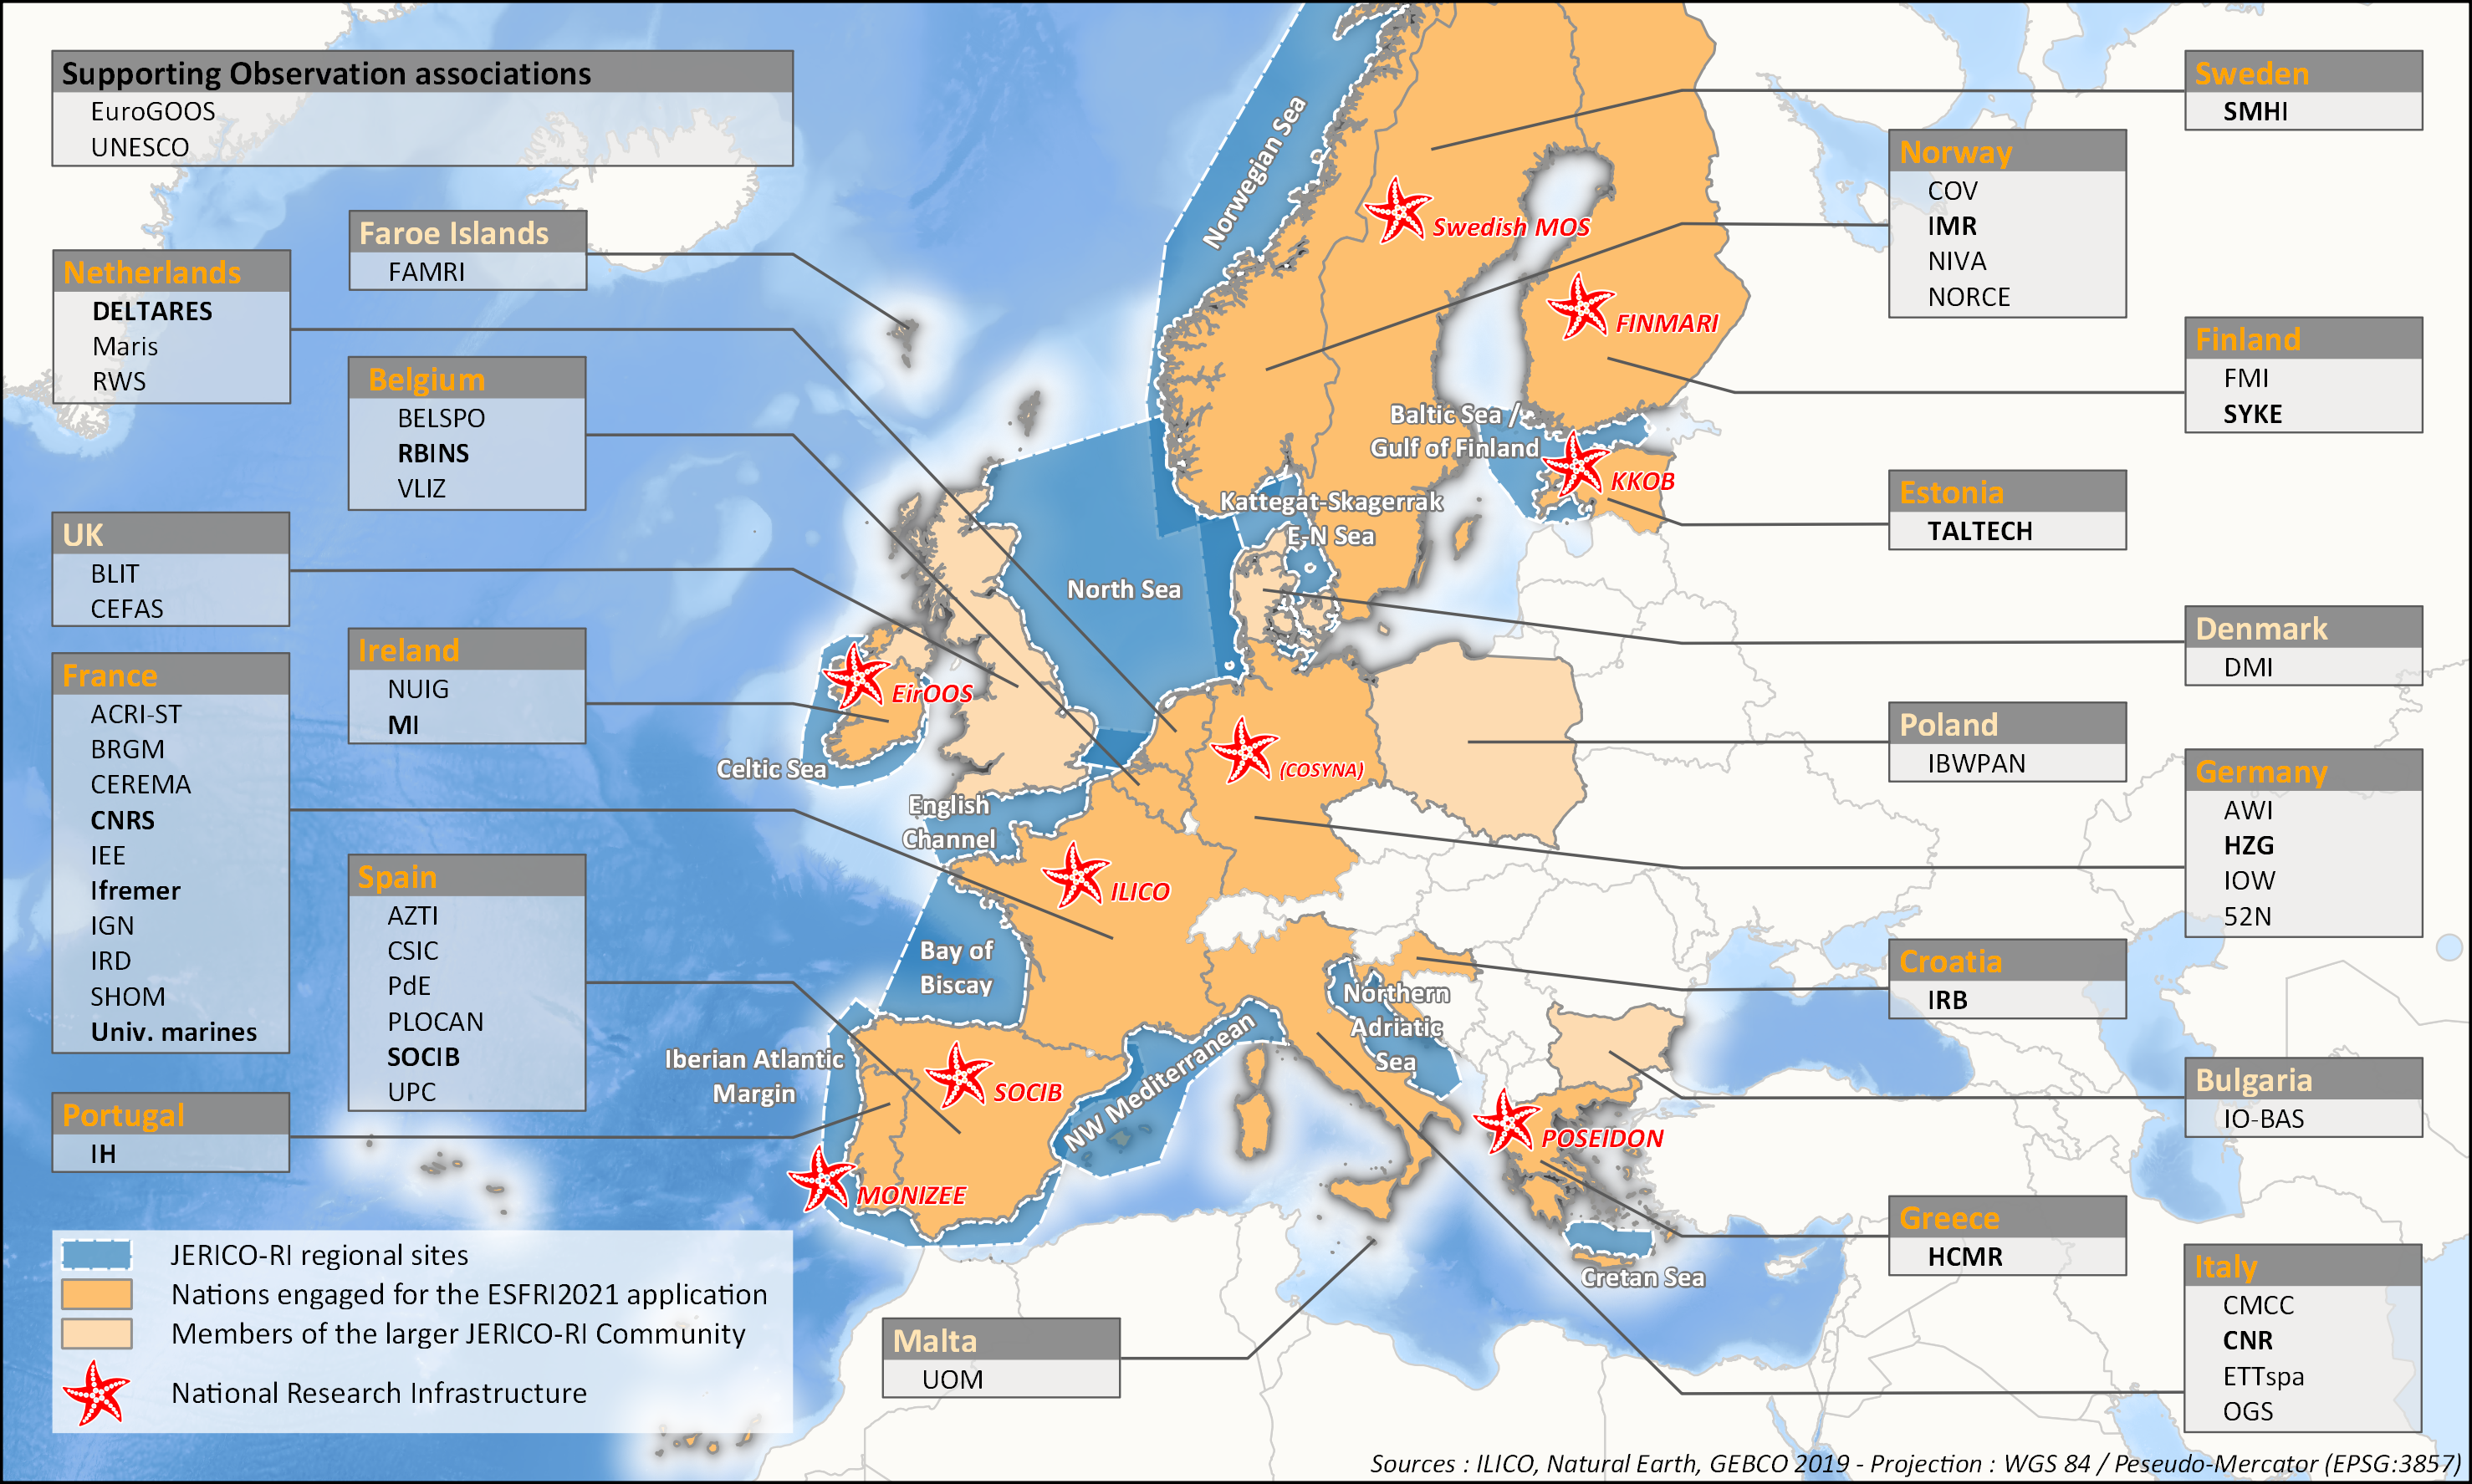
aThis survey action has been undertaken as part of WP6 of the H2020 JERICO-S3 project. Its integration in Sextant is the first step towards a comprehensive and extensive data catalog for the JERICO Research Infrastructure. JERICO-S3, Description of Work - WP6 : Data Management Task 6.2: Data management for coastal platforms (M1-48) (Lead: HCMR) Subtask 6.2.1: Identify and update the overview of JERICO-RI involved platforms and data (SMHI, MARIS, IFREMER) (M1-48) The JERICO dataset catalogue has proven a useful tool for creating an overview of platforms and data relevant for the project this and will be updated. Input from other WP’s will be used to identify the actual JERICO platforms, including the PSS, TNA platforms, and IRS. Partners will collect and describe coastal platforms in the dataset catalogue (technically run in WP7) including pointers to data, which variables (related to EOV’s) published as D6.2. Subtask 6.2.2: Best practice capturing for “mature” platforms with physical and BGC parameters (HCMR, SMHI, CNR, ETT, SOCIB, HZG, RWS) (M6-42). For the following platform types there will be activities supporting data management as defined under T6.4 in close relation to the Virtual Research Environment in WP7: HF radars (CNR), Gliders (SOCIB, ETT), FerryBox (HZG) The work for each platform type will follow basically the same approach and will cooperate with WP4 (PSS) and WP3 (IRS). The experts will identify the existing standards, and possible data management best practices (D6.3). At the end of the project an evaluation will be done of the level of Best Practice adoption at the IRSs and PSSs in the project, as well as the use of the VRE by the partners engaged in WP3 and WP4 (D6.10). This will be done in cooperation with WP3 and WP4, and is an important condition for data to be accessible for use in the Virtual Environment in T7.4.
-

rgbif is an R package from rOpenSci that allows searching and retrieving data from GBIF. rgbif wraps R code around the GBIF API to allow you to talk to GBIF from R and access metadata, species names, and occurrences. rgbif allows you to easily: - get data for single occurrences - retrieve multiple occurences - search for taxon names - generate maps of occurences
-
Excel file containing CPR data from Standard Areas B4,C3,C4,D3,D4,D5,E4,F4 for the plankton Calanus finmarchicus and helgolandicus, total traverse (small) copepods, total large copepods, Phytoplankton Colour Index and Cnidaria (presence denoted by a 1, absence by a zero). All taxa are from 1980, except Cnidaria which are from 2011. Dataset is in the format of sample level data, with each row being a discrete sample, with a sample being 3m3 filtered seawater, and 10nm of tow. For each row, a sample has the following information, starting at column a: Standard area of sample, sample id, latitude (decimal degrees) of sample mid point, longitude (decimal degrees) of sample midpoint, sample midpoint date and local time, year of sample, month of sample, then plankton abundance values (or PCI index or cnidaria presence/absence). All taxa have been looked for during the period this dataset spans, so zero values represent true absence.
-
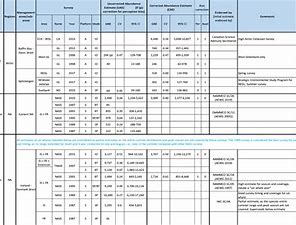
The purpose of this table is to present the best available abundance estimates for cetacean species in areas of relevance to the work of NAMMCO. It is intended to be used as a starting point for researchers, and the original sources are provided if additional information is required. The Scientific Committee of NAMMCO maintains a Working Group on Abundance Estimates, composed of invited experts in the field as well as some Committee members. This Working Group meets periodically to review new abundance estimates from recent surveys or, in some cases, re-analyses of older data. The reports of the Working Group are brought to the Scientific Committee at their annual meetings, and used to formulate advice on stock status, allowable removals or other matters. In most cases, the Scientific Committee will formally endorse estimates approved by the Working Group, and if so, this is indicated on the Table. Some estimates have been endorsed by the Scientific Committee of the International Whaling Commission (IWC).
-
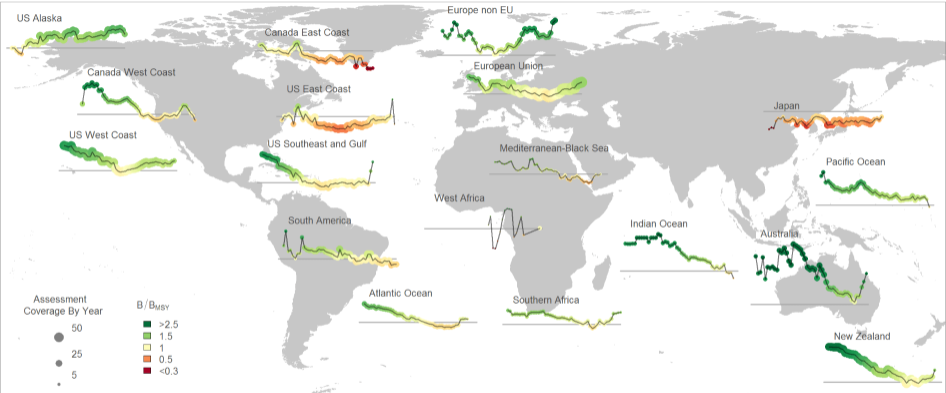
The RAM Legacy Stock Assessment Database is a compilation of stock assessment results for commercially exploited marine populations from around the world. The RAM Legacy Stock Assessment Database is grateful to the many stock assessment scientists whose work this database is based upon and the many collaborators who recorded the assessment model results for inclusion in the RAM Legacy Stock Assessment Database. Since 2011 the RAM Legacy Data base has been hosted and managed at the University of Washington with financial assistance from a consortium of Seattle-based seafood companies and organizations, and from the Walton Family Foundation. Initial development of the database from 2006-2010 was supported by the Census of Marine Life, Canadian Foundation for Innovation, NCEAS, NSERC, the Smith Conservation Research Fellowship, New Jersey Sea Grant, and the National Science Foundation.
-
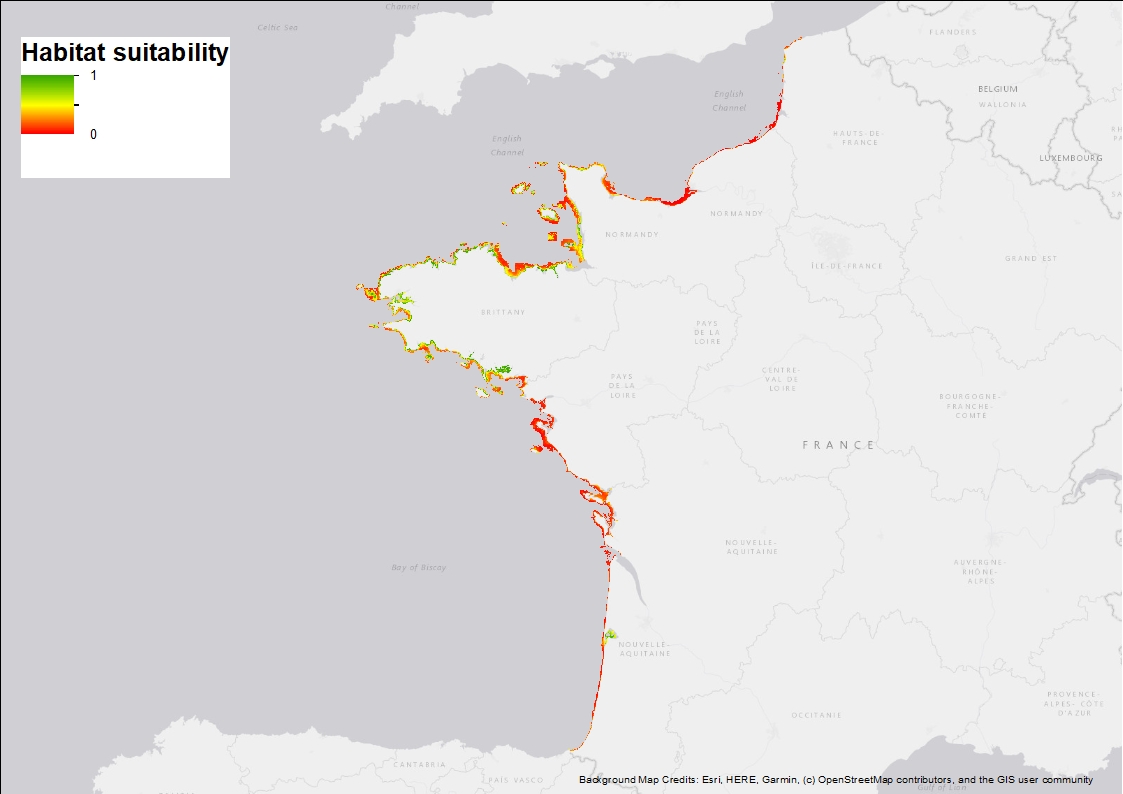
Ten Random Forest models were fitted in order to characterise the environmental niche and to predict the potential spatial distribution of Zostera marina along the French western seaboard. 3 rasters are provided: 1) Habitat suitability index (values ranging from 0 to 1 when conditions are estimated to be optimal), 2) standard deviation around the mean habitat suitability index, and 3) binary suitability estimates (0= not suitable, 1=suitable). These model estimates indicate areas where the species may occur and are overall consistent with field observations but note that these maps are model-based and do not correspond to actual field observations.