 Catalogue PIGMA
CDS-IS-OMP
Type of resources
Available actions
Topics
Keywords
Contact for the resource
Provided by
Years
Formats
Representation types
Update frequencies
status
Scale
-
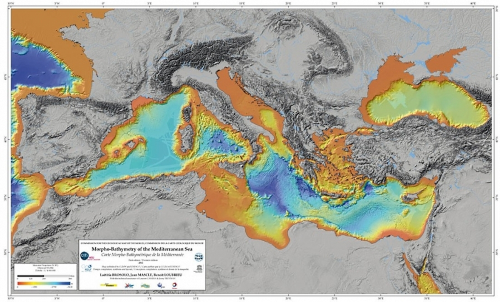
The systematic swath bathymetric mapping of the Mediterranean Sea started in the mid-nineties. This mapping has considerably modified our understanding of the morphology of the Mediterreanean Sea and of the various active geological processes (sedimentary, tectonic, volcanic, bio-geochemical processes) which participate to the seafloor morphology.
-
The annually binned Sea Surface Salinity, Temperature and Density data set covers a large part of the North Atlantic subpolar gyre. It is based on T and S near-surface data collected since December 1895 to August 2018 from all data sources, including Voluntary Observing Ships subsequently validated. This annual product presents deviations from a climatological seasonal cycle and has furthermore been smoothed in time with a 1/4, 1/2, 1/4 running-mean filter. Density time series are estimated from those annual time series, considering winter (D-J-F) climatology. Uncertainty estimates due to sampling are also provided. Data for December 2017-August 2018 are also reported as 2018, but are temporary and should not be used without further check. Long gaps have been filled by linear interpolation, and are attributed largest error.
-
The annually binned Sea Surface Salinity data set covers a large part of the Atlantic Ocean (75°W-10°E, 20°S-70°N). It is based on salinity near-surface data collected since December 1895 to 2016 from all data sources, including Voluntary Observing Ships subsequently validated. This annual product presents Atlantic SSS 32 grid box anomaly and error time-series (for boxes 1 to 26, year 2016 not smoothed 1-2-1), as well as Atlantic SSS grid box coordinates and March-May mean climatology. The SSS binned time series are an update from the 1896-2013 time series (Friedman et al., 2017).
-
The binned Sea Surface Salinity, Temperature and Density data set covers regularly sampled ship-of-opportunity lines. It is based on data collected from 1993 to 2018 from Voluntary Observing Ships subsequently validated. This monthly product is binned with monthly total values deviations and then deviations from climatology in each bin, with additional 1-2-1 time filter applied on the averages. Along B-AX01, some gaps were filled with additional data located one degree north or south of the grid boxes.
-
Sea Surface Salinity (SSS) is an essential climate variable that requires long term in situ observation. The French SSS Observation Service (SSS-OS) manages a network of Voluntary Observing Ships equipped with thermosalinographs (TSG) since 2002. The network is global though more concentrated in the tropical Pacific and North Atlantic oceanic basins. The acquisition system is autonomous with real time transmission and is regularly serviced at harbor calls. The high resolution data retrieved from the acquisition system during ship calls is processed through a dedicated software (freely available) for attribution of data quality flags by visual inspection, and correction of TSG time series by comparison with climatology, onboard daily water samples and collocated Argo data. Details can be found in the reference below. The validated delayed time data collected from TSG, together with some bucket samples mostly collected before 2002, are made available for educational and research purposes through an interactive web interface.
-
TSG-QC is a tool for interactive analysis and validation of sea surface temperature and salinity data acquired from a Thermosalinograph (TSG) installed on research or commercial ships. It has been developed under Matlab. It allows: • Visualization of TSG variables: Temperature, salinity and ship speed • Interactive comparison with climatological values (WOA and ISAS) • Automatic quality control using selected threshold criteria • Data validation and adjustment with external measurements (water samples, collocated Argo data, CTD, ...) • Quantitative estimation of sensor drift. The software can deal with different input data formats: ASCII, Labview, Seabird, GOSUD NetCDF... The use of TSG-QC from sources requires a valid Matlab license. A compiled version is available free of charge for users who do not have a Matlab license.
-
The gridded Sea Surface Salinity (SSS) data set covers the region between 95°W – 20°E and 50°N – 30°S in the Atlantic Ocean. It is based on available data collected from 1970 to 2016 mostly from Voluntary Observing Ships, PIRATA moorings and Argo profilers, and subsequently validated. This monthly SSS product is gridded using an objective mapping at the spatial resolution 1° x 1°. It is distributed with its associated error fields. It is an update of the SSS product presented in Reverdin et al (2007).
-
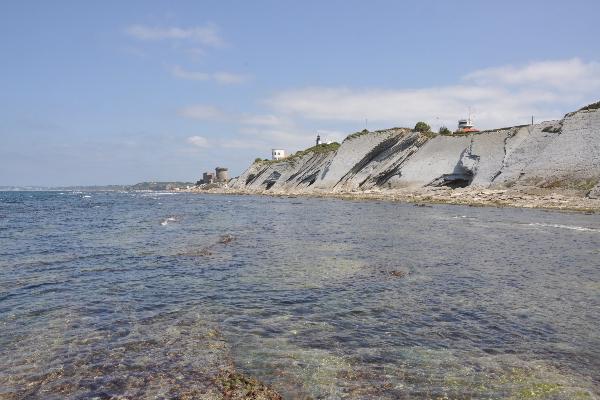
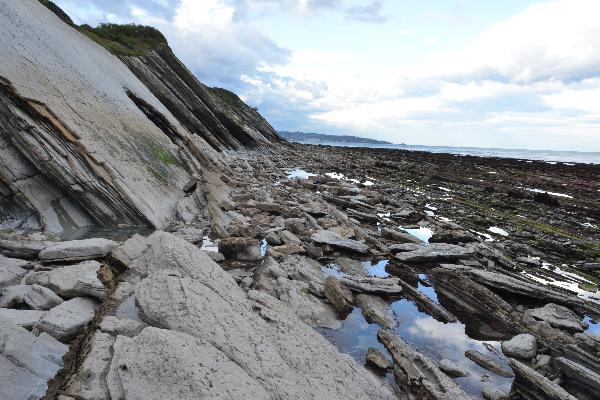
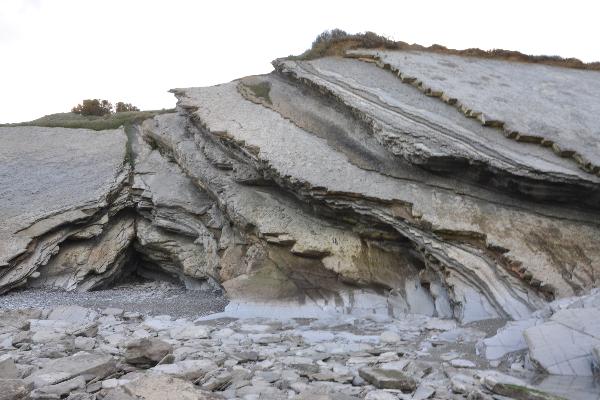
Série de photographies réalisée sur le site de Socoa du 19/08/2011 pour un suivi photogrammétrique. 3 types de photos : (A) de la plateforme depuis la falaise; (B) de la falaise depuis la plateforme; (Bunker) Photos du bunker près du rond-point sur lequel un effondrement est tombé probablement début 2011.
-
Série de photographies réalisée sur le site de Socoa du 27-10-2011 pour un suivi photogrammétrique.3 types de photos : (A) de la plateforme depuis la falaise; (B) de la falaise depuis la plateforme; (Bunker) Photos du bunker près du rond-point sur lequel un effondrement est tombé probablement début 2011.
-
Série de photographies réalisée sur le site de Socoa du 25-11-2011 pour un suivi photogrammétrique.3 types de photos : (A) de la plateforme depuis la falaise; (B) de la falaise depuis la plateforme; (Bunker) Photos du bunker près du rond-point sur lequel un effondrement est tombé probablement début 2011.