 Catalogue PIGMA
2015
Type of resources
Available actions
Topics
Keywords
Contact for the resource
Provided by
Years
Formats
Representation types
Update frequencies
status
Service types
Scale
Resolution
-
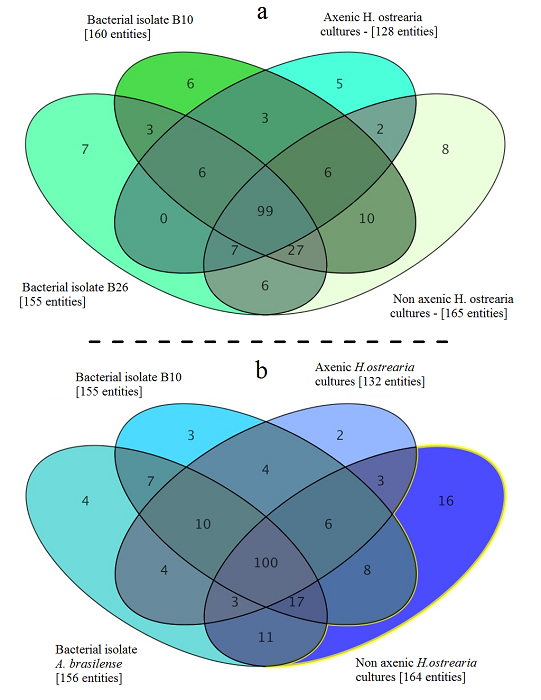
Metabolome of of the marine diatom Haslea ostrearia. Bacteria were isolated from Haslea ostrearia isolates cultivated in ES 1/3 medium in laboratory conditions over a 3-month period. These microalgal isolates were recovered from four sites on the French Atlantic coast: Bouin , La Barre-de-Monts (46.90 N; 2.11°W), Isle de Ré (46.22 N; 1.45°W), and La Tremblade (45.80 N; 1.15°W) . Data processing and statistical analysis of the metabolic profiles were performed on an LC/MS Metabolomics Discovery Workflow using Mass Profiler Professional Software and an Agilent 1290 Infinity II LC system coupled to an Agilent 6540 UHD Accurate-Mass QTOF hybrid mass spectrometer (Agilent Technologies, Waldbronn, Germany) equipped with a dual electrospray ionization (ESI) source. The full history (tools, parameters, input and output data files) is publicly available on http://dx.doi.org/10.12770/046e1e6a-864e-48a6-944b-d8613d67de0f
-
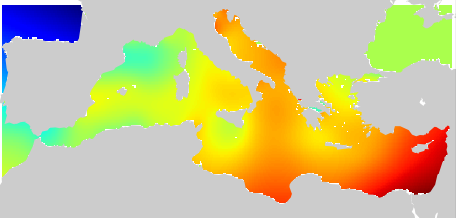
Mediterranean Sea Climatology computed from the SeaDataNet V1.1 aggregated dataset . The version used for the DIVA software is the 4.6.9. The period covers 1900-2013. For data access please register at http://www.marine-id.org
-
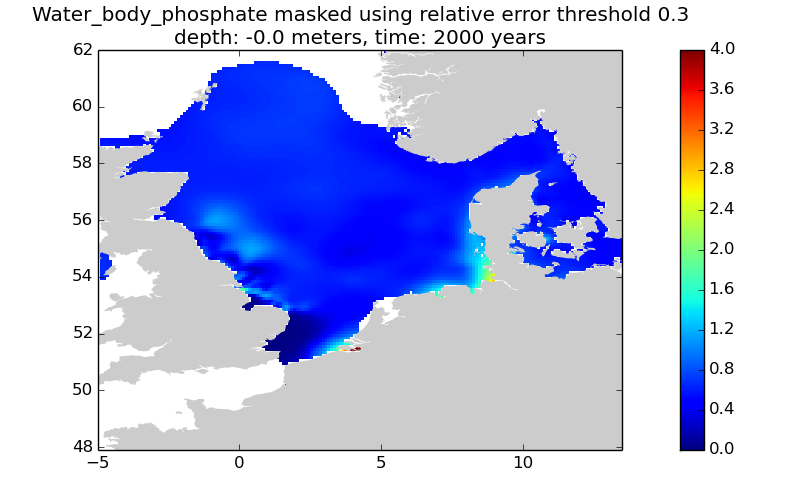
This gridded product visualizes 1960 - 2014 water body phosphate concentration (umol/l) in the North Sea domain, for each season (winter: December – February; spring: March – May; summer: June – August; autumn: September – November). It is produced as a Diva 4D analysis, version 4.6.9: a reference field of all seasonal data between 1960-2014 was used; results were logit transformed to avoid negative/underestimated values in the interpolated results; error threshold masks L1 (0.3) and L2 (0.5) are included as well as the unmasked field. Every step of the time dimension corresponds to a 10-year moving average for each season. The depth dimension allows visualizing the gridded field at various depths.
-
Description of the attributes for the time-series of sea internal energy for the last 20 years for the Mediterranean basin and for each NUTS region along the coast.
-
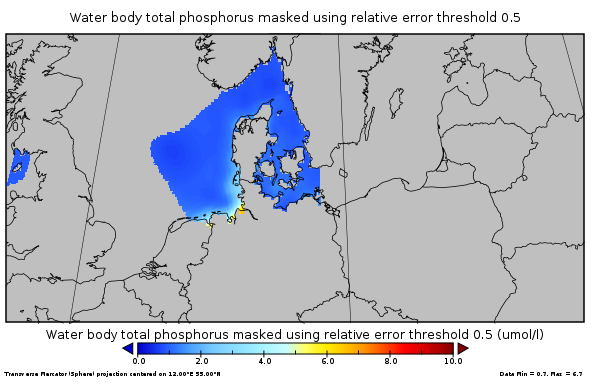
This gridded product visualizes 1960 - 2014 water body total phosphorus concentration (umol/l) in the North Sea domain, for each season (winter: December – February; spring: March – May; summer: June – August; autumn: September – November). It is produced as a Diva 4D analysis, version 4.6.11: a reference field of all seasonal data between 1960-2014 was used; results were logit transformed to avoid negative/underestimated values in the interpolated results; error threshold masks L1 (0.3) and L2 (0.5) are included as well as the unmasked field. Every step of the time dimension corresponds to a 10-year moving average for each season. The depth dimension allows visualizing the gridded field at various depths.
-

Première utilisation du sol, devant l'agriculture et loin devant l'urbanisme, la forêt couvre 45 % du territoire aquitain. La région se caractérise par la domination d'une essence, le pin maritime. Celui-ci couvre plus de la moitié de la surface forestière régionale. Outre sa valeur patrimoniale, cette forêt génère une activité économique qui représente environ 3 milliards d'euros. Ce secteur forêt-bois est donc un formidable gisement d'emplois, principalement en milieu rural. Cet espace occupé par la forêt attise néanmoins des convoitises pour différents types d'usage: l'urbanisation, les installations photovoltaïques ou encore l'agriculture.
-

L’étalement urbain est une forme d’urbanisation qui s’est développée autour des agglomérations. Il entraine une artificialisation des sols qui produit des impacts sur l’environnement, sur le paysage et sur l’organisation des territoires. La lutte contre l’étalement urbain et l’artificialisation des sols au profit de formes urbaines denses et compactes est une priorité régionale qui implique de mettre en oeuvre une politique globale de maîtrise de la consommation des espaces naturels, agricoles et forestiers. L’Aquitaine est une région vaste et davantage artificialisée que la France métropolitaine. La densité de population est faible et l’Aquitaine arrive en 8ème position des régions occupant le plus d’espace artificialisé par habitant. Son fort dynamisme démographique accroît les pressions sur le foncier disponible, notamment autour des pôles d’emploi. Dans plusieurs aires urbaines, les sols s’artificialisent à un rythme bien supérieur à l’évolution de la population.
-

Le document présente l'Observatoire des Espaces Naturels, Agricoles, Forestiers et Urbains (NAFU), dispositif où l'Etat et la Région s'unissent pour donner les moyens de prévoir et d'agir
-
Specification of the desirable and recomended product attributes for generating spatial layers of sea surface temperature temperature trend for the last 10, 50, 100 years for the Mediterranean basin and for each NUTS3 region along the coast.
-
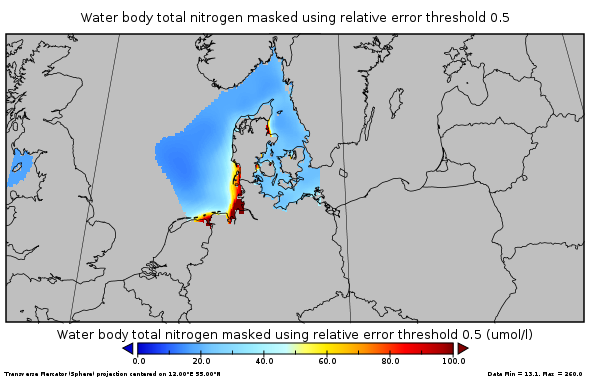
This gridded product visualizes 1960 - 2014 water body total nitrogen concentration (umol/l) in the North Sea domain, for each season (winter: December – February; spring: March – May; summer: June – August; autumn: September – November). It is produced as a Diva 4D analysis, version 4.6.11: a reference field of all seasonal data between 1960-2014 was used; results were logit transformed to avoid negative/underestimated values in the interpolated results; error threshold masks L1 (0.3) and L2 (0.5) are included as well as the unmasked field. Every step of the time dimension corresponds to a 10-year moving average for each season. The depth dimension allows visualizing the gridded field at various depths.