 Catalogue PIGMA
Marine Scotland Science
Type of resources
Available actions
Topics
Keywords
Contact for the resource
Provided by
Years
Formats
Representation types
Scale
Resolution
-
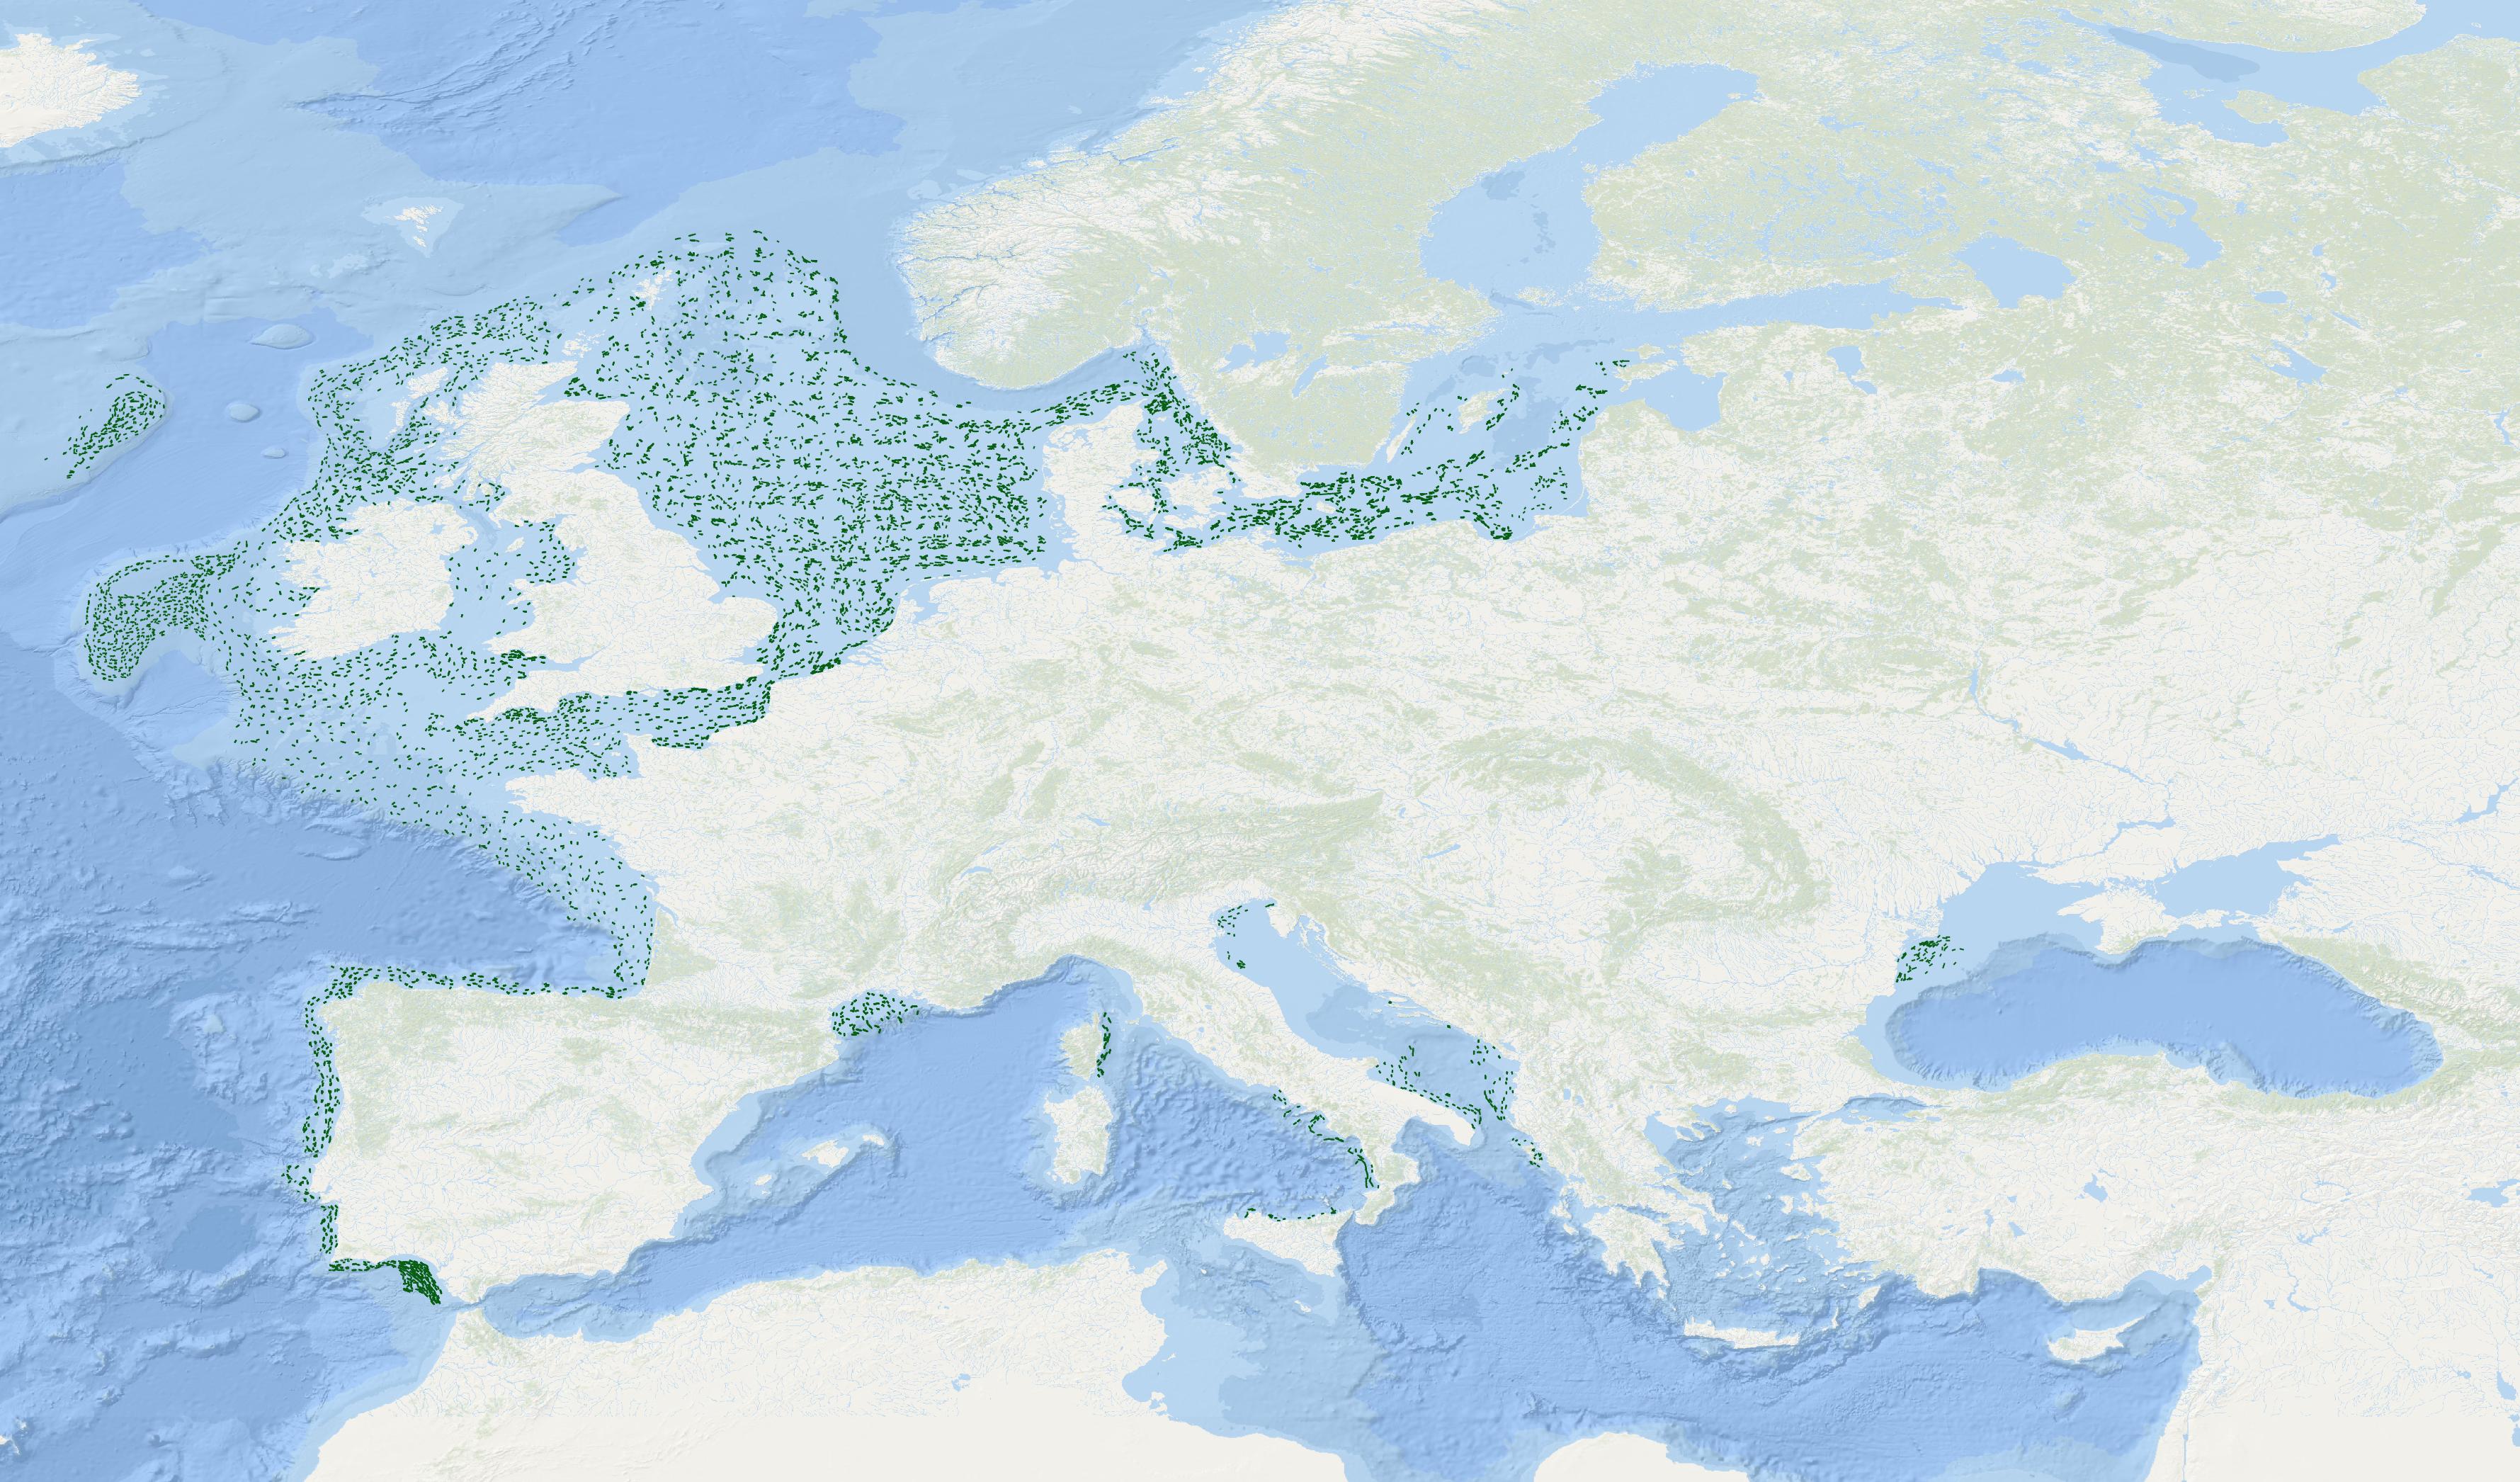
EMODnet Chemistry aims to provide access to marine chemistry data sets and derived data products concerning eutrophication, ocean acidification, contaminants and litter. The chosen parameters are relevant for the Marine Strategy Framework Directive (MSFD), in particular for descriptors 5, 8, 9 and 10. The datasets contain standardized, harmonized and validated data collections from seafloor litter. Datasets concerning seafloor litter data are loaded in a central database after a semi-automated validation phase. Once loaded, a data assessment is performed in order to check data consistency and potential errors are corrected thanks to a feedback loop with data originators. EMODnet seafloor litter data and database are hosted and maintained by ‘Istituto Nazionale di Oceanografia e di Geofisica Sperimentale, Division of Oceanography (OGS/NODC)’ from Italy. For seafloor litter, the harmonized datasets contain all unrestricted EMODnet Chemistry data on seafloor litter data. Data are formatted following Guidelines and forms for gathering marine litter data, which can be found at: https://dx.doi.org/10.6092/15c0d34c-a01a-4091-91ac-7c4f561ab508. The updated vocabularies of admitted values are available at https://vocab.seadatanet.org/search or at https://vocab.ices.dk/ . The harmonized datasets can be downloaded as EMODnet Sea-floor litter data format version 1.0, which is a csv file, tab separated values.
-
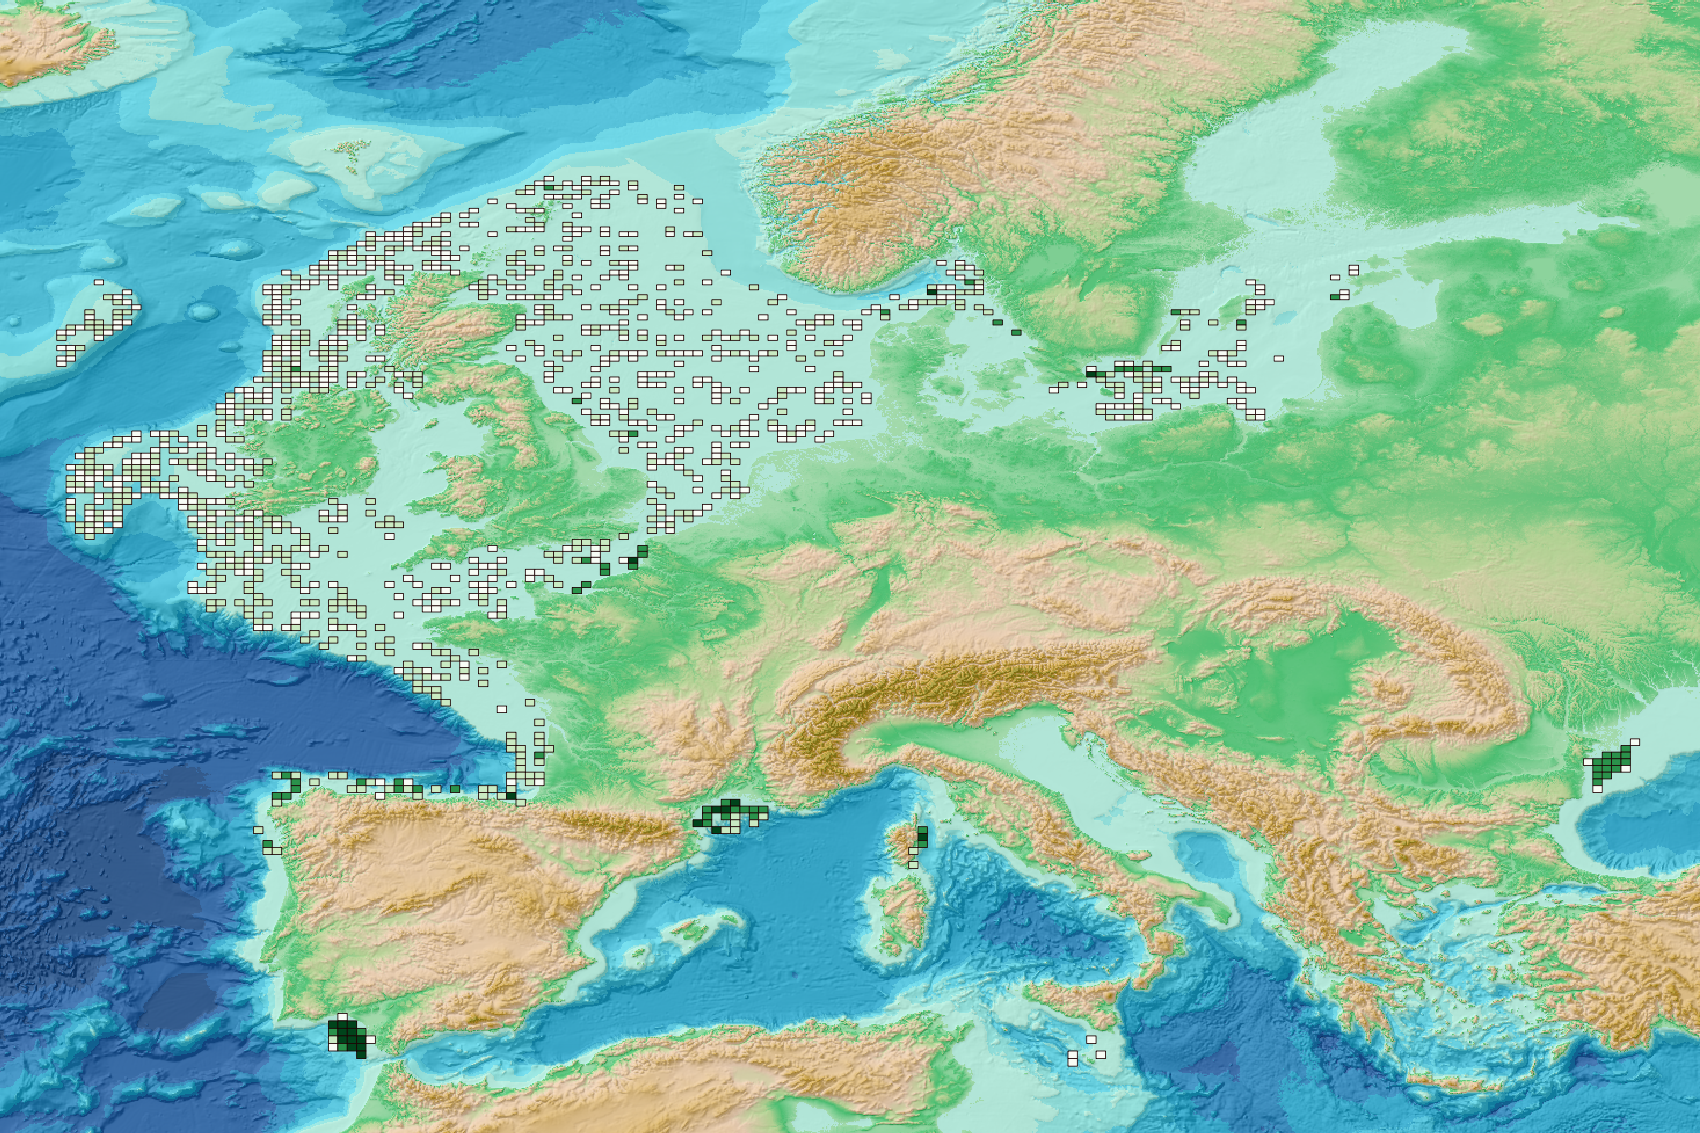
This visualization product displays the spatial distribution of the sampling effort over the six-years' period 2017-2022. EMODnet Chemistry included the collection of marine litter in its 3rd phase. Since the beginning of 2018, data of seafloor litter collected by international fish-trawl surveys have been gathered and processed in the EMODnet Chemistry Marine Litter Database (MLDB). The harmonization of all the data has been the most challenging task considering the heterogeneity of the data sources, sampling protocols (OSPAR and MEDITS protocols) and reference lists used on a European scale. Moreover, within the same protocol, different gear types are deployed during bottom trawl surveys. The spatial distribution was determined by calculating the number of times each cell was sampled during the period 2017-2022. The corresponding total distance (kms) sampled in each cell is also provided in the attribute table. Information on data processing and calculation are detailed in the attached methodology document. Warning: the absence of data on the map does not necessarily mean that they do not exist, but that no information has been entered in the Marine Litter Database for this area. This work is based on the work presented in the following scientific article: O. Gerigny, M. Brun, M.C. Fabri, C. Tomasino, M. Le Moigne, A. Jadaud, F. Galgani, Seafloor litter from the continental shelf and canyons in French Mediterranean Water: Distribution, typologies and trends, Marine Pollution Bulletin, Volume 146, 2019, Pages 653-666, ISSN 0025-326X, https://doi.org/10.1016/j.marpolbul.2019.07.030.
-
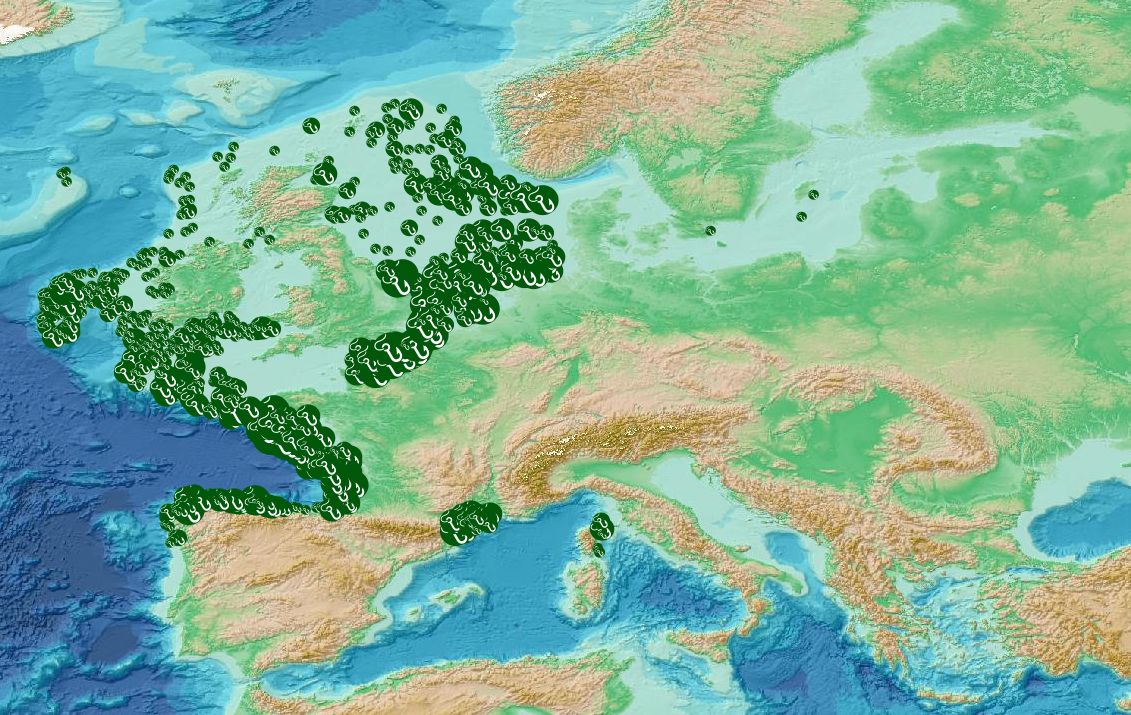
This visualization product displays fishing related items density per trawl. EMODnet Chemistry included the collection of marine litter in its 3rd phase. Since the beginning of 2018, data of seafloor litter collected by international fish-trawl surveys have been gathered and processed in the EMODnet Chemistry Marine Litter Database (MLDB). The harmonization of all the data has been the most challenging task considering the heterogeneity of the data sources, sampling protocols (OSPAR and MEDITS protocols) and reference lists used on a European scale. Moreover, within the same protocol, different gear types are deployed during fishing bottom trawl surveys. In cases where the wingspread and/or the number of items were unknown, data could not be used because these fields are needed to calculate the density. Data collected before 2011 are affected by this filter. When the distance reported in the data was null, it was calculated from: - the ground speed and the haul duration using this formula: Distance (km) = Haul duration (h) * Ground speed (km/h); - the trawl coordinates if the ground speed and the haul duration were not filled in. The swept area is calculated from the wingspread (which depends on the fishing gear type) and the distance trawled: Swept area (km²) = Distance (km) * Wingspread (km) Densities have been calculated on each trawl using the following computation: Density of fishing related items (number of items per km²) = ∑Number of fishing related items / Swept area (km²) Percentiles 50, 75, 95 & 99 have been calculated taking into account data for all years. The list of selected items for this product is attached to this metadata. Information on data processing and calculation is detailed in the attached methodology document. Warning: the absence of data on the map doesn't necessarily mean that they don't exist, but that no information has been entered in the Marine Litter Database for this area.
-
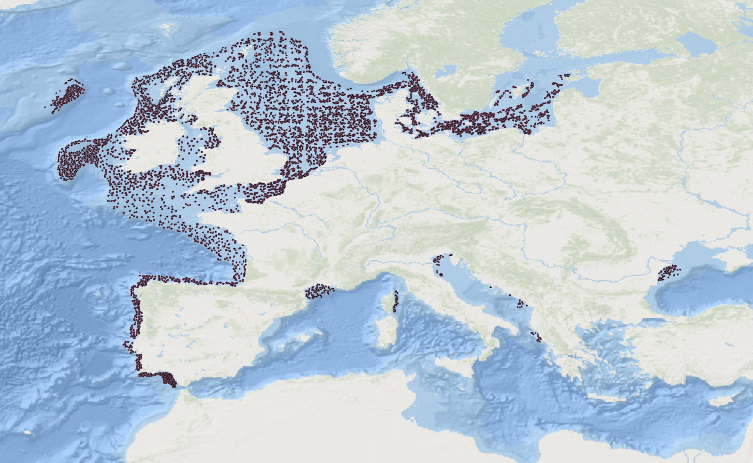
EMODnet Chemistry aims to provide access to marine chemistry data sets and derived data products concerning eutrophication, ocean acidification, contaminants and litter. The chosen parameters are relevant for the Marine Strategy Framework Directive (MSFD), in particular for descriptors 5, 8, 9 and 10. The datasets contain standardized, harmonized and validated data collections from seafloor litter. Datasets concerning seafloor litter data are loaded in a central database after a semi-automated validation phase. Once loaded, a data assessment is performed in order to check data consistency and potential errors are corrected thanks to a feedback loop with data originators. EMODnet seafloor litter data and database are hosted and maintained by ‘Istituto Nazionale di Oceanografia e di Geofisica Sperimentale, Division of Oceanography (OGS/NODC)’ from Italy. For seafloor litter, the harmonized datasets contain all unrestricted EMODnet Chemistry data on seafloor litter data, including 20877 CDI records. The temporal range covered is from 2006-10-01 to 2021-03-16. Data are formatted following Guidelines and forms for gathering marine litter data, which can be found at: https://dx.doi.org/10.6092/15c0d34c-a01a-4091-91ac-7c4f561ab508. The updated vocabularies of admitted values are available at https://vocab.seadatanet.org/search or at https://vocab.ices.dk/ . The harmonized datasets can be downloaded as EMODnet Sea-floor litter data format Version 1.0, which is a csv file, tab separated values. The original datasets can be searched and downloaded from EMODnet Chemistry Chemistry CDI Data and Discovery Access Service: https://emodnet-chemistry.maris.nl/search
-
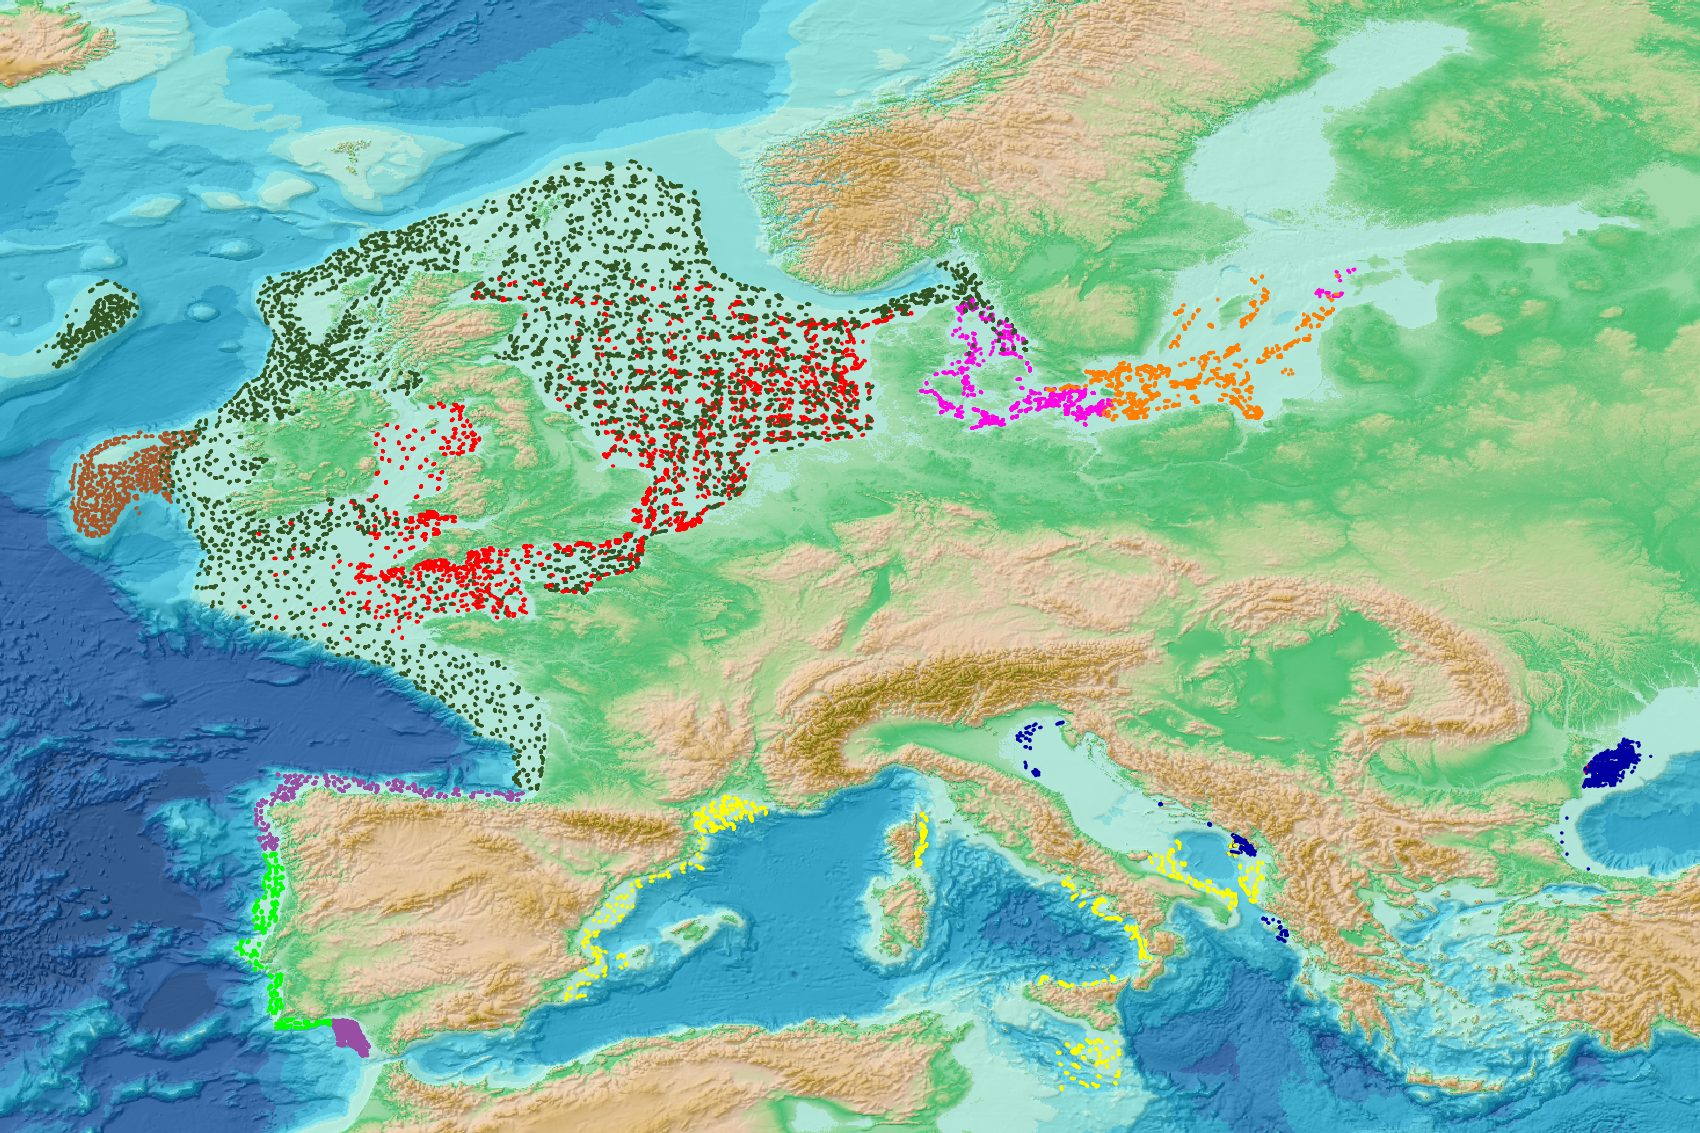
This visualization product displays the location of all the surveys present in the EMODnet marine litter database (MLDB). The different fishing gears used are represented by different colors. EMODnet Chemistry included the collection of marine litter in its 3rd phase. Since the beginning of 2018, data of seafloor litter collected by international fish-trawl surveys have been gathered and processed in the EMODnet Chemistry Marine Litter Database (MLDB). The harmonization of all the data has been the most challenging task considering the heterogeneity of the data sources, sampling protocols (OSPAR and MEDITS protocols) and reference lists used on a European scale. Moreover, within the same protocol, different gear types are deployed during bottom trawl surveys. Unlike other EMODnet seafloor litter products, all trawls surveyed since 2006 are included in this map even if the wingspread and/or the distance are unknown. Only surveys with an unknown number of items were excluded from this product. More information on data processing and calculation are detailed in the attached document. Warning: the absence of data on the map does not necessarily mean that they do not exist, but that no information has been entered in the Marine Litter Database for this area.
-
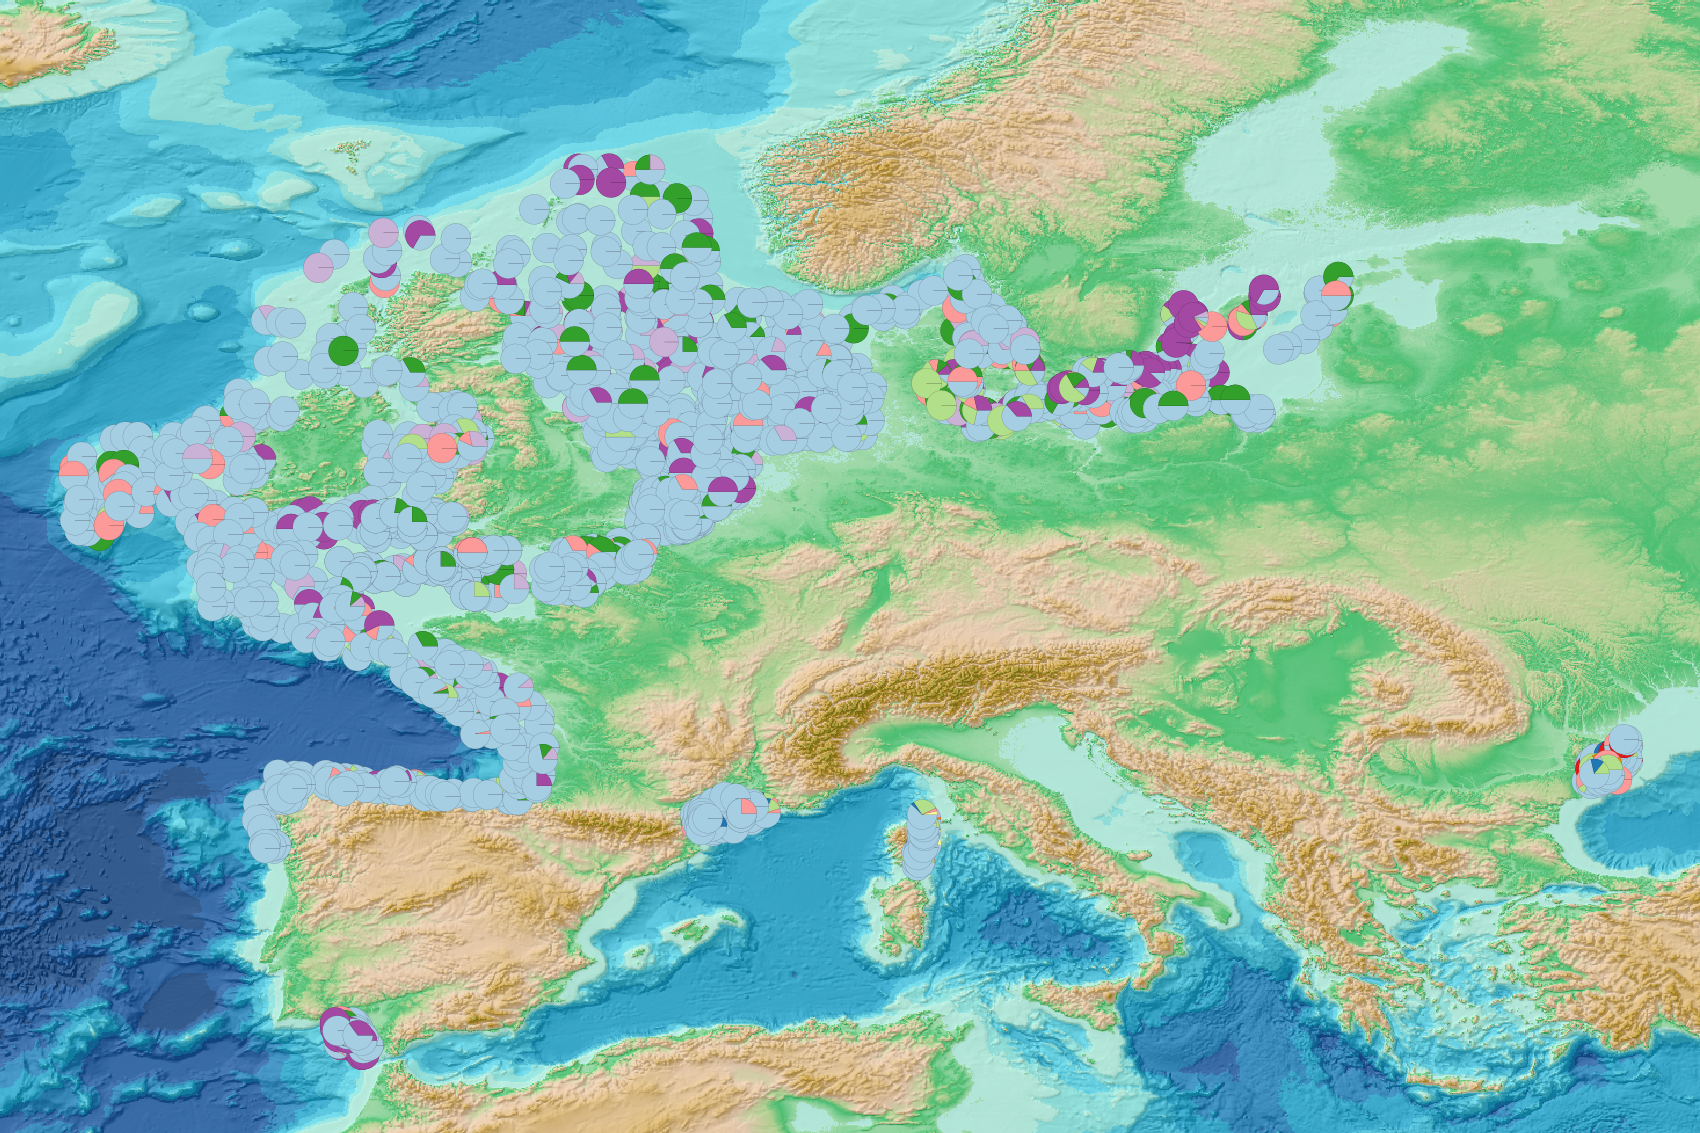
This visualization product displays the marine litter material categories percentage per trawl. EMODnet Chemistry included the collection of marine litter in its 3rd phase. Since the beginning of 2018, data of seafloor litter collected by international fish-trawl surveys have been gathered and processed in the EMODnet Chemistry Marine Litter Database (MLDB). The harmonization of all the data has been the most challenging task considering the heterogeneity of the data sources, sampling protocols (OSPAR and MEDITS protocols) and reference lists used on a European scale. Moreover, within the same protocol, different gear types are deployed during bottom trawl surveys. Unlike other EMODnet seafloor litter products, all trawls surveyed since 2007 are included in this map even if the wingspread and/or the distance are/is unknown. Only surveys with an unknown number of items were excluded from this product. Harmonization of the material categories between ICES and MEDITS lists was performed and the following calculation was applied: Material % = (∑Number of items of each material category*100)/(∑Number of items of all material categories) More information on data processing and calculation are detailed in the attached document. Warning: the absence of data on the map does not necessarily mean that they do not exist, but that no information has been entered in the Marine Litter Database for this area.
-
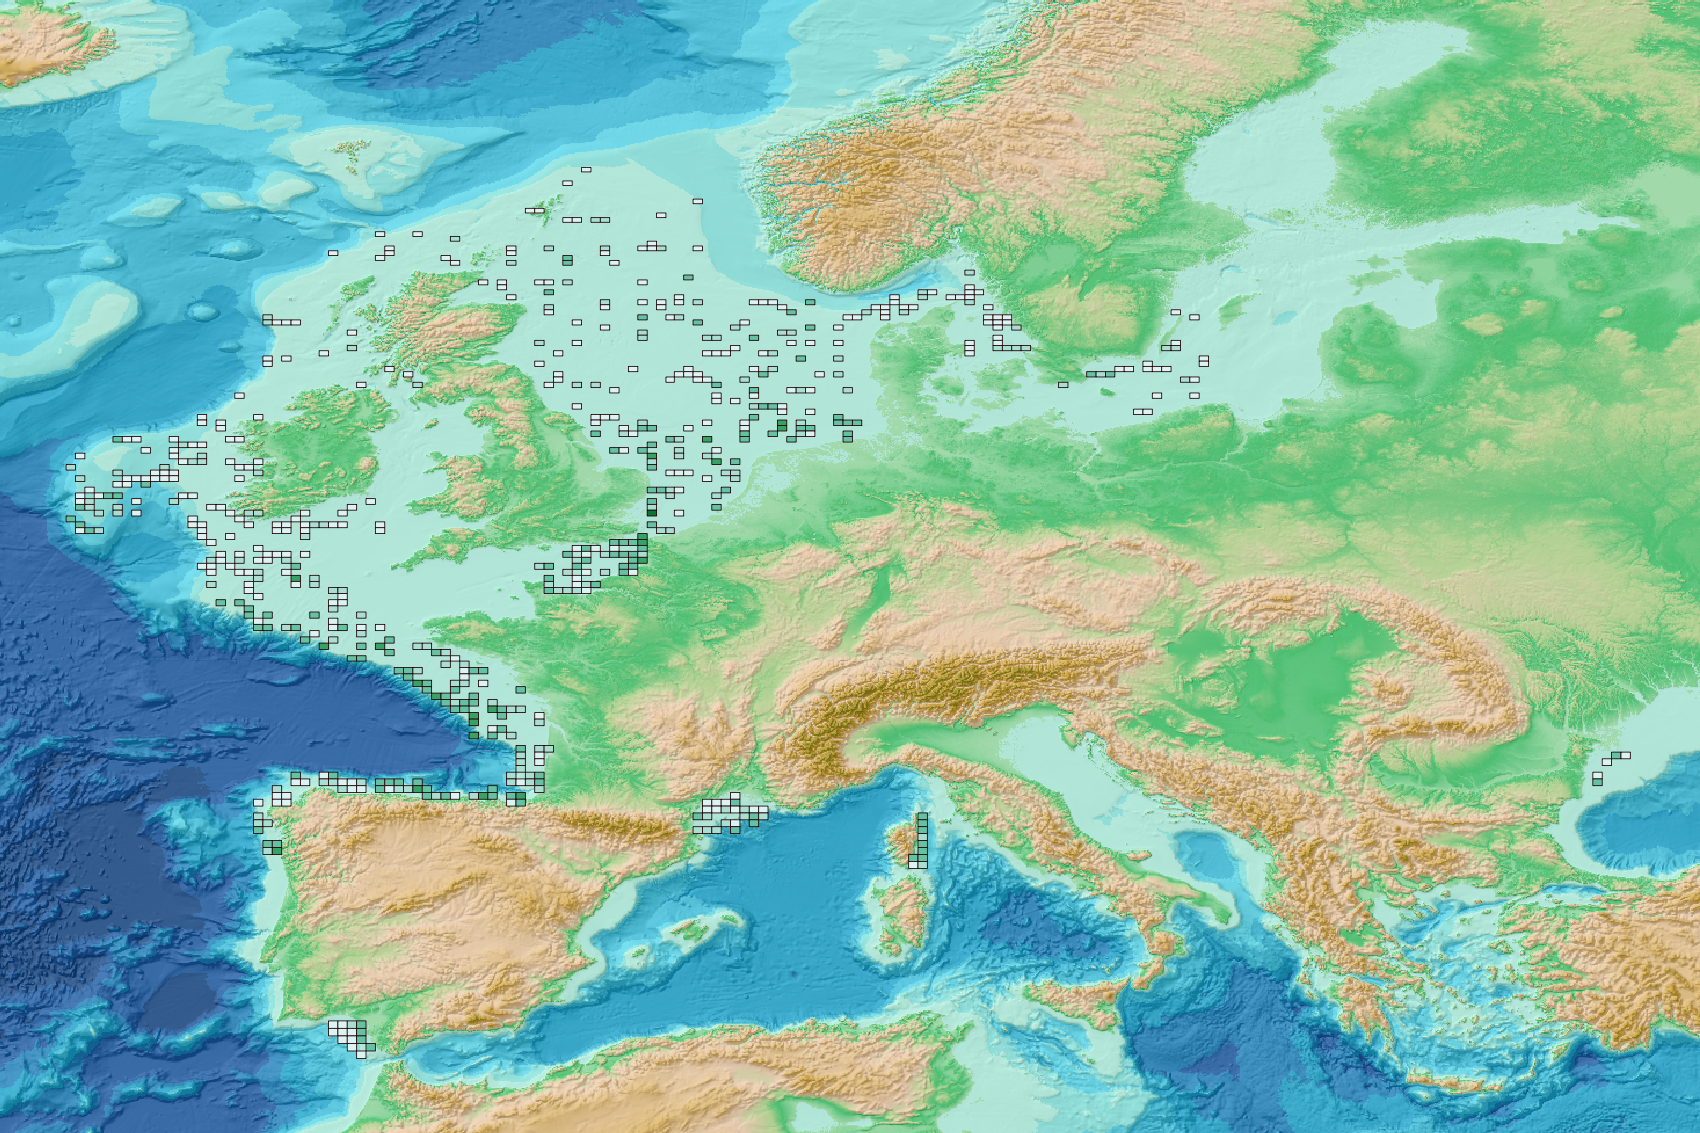
This visualization product displays the spatial distribution of fishing related items density per trawl. EMODnet Chemistry included the collection of marine litter in its 3rd phase. Since the beginning of 2018, data of seafloor litter collected by international fish-trawl surveys have been gathered and processed in the EMODnet Chemistry Marine Litter Database (MLDB). The harmonization of all the data has been the most challenging task considering the heterogeneity of the data sources, sampling protocols (OSPAR and MEDITS protocols) and reference lists used on a European scale. Moreover, within the same protocol, different gear types are deployed during bottom trawl surveys. In cases where the wingspread and/or number of items were/was unknown, it was not possible to use the data because these fields are needed to calculate the density. Data collected before 2011 are concerned by this filter. When the distance reported in the data was null, it was calculated from: - the ground speed and the haul duration using the following formula: Distance (km) = Haul duration (h) * Ground speed (km/h); - the trawl coordinates if the ground speed and the haul duration were not filled in. The swept area was calculated from the wingspread (which depends on the fishing gear type) and the distance trawled: Swept area (km²) = Distance (km) * Wingspread (km) Densities were calculated on each trawl and year using the following computation: Density of fishing related items (number of items per km²) = ∑Number of fishing related items / Swept area (km²) Then a grid with 30km x 30km cells was used to calculate the weighted mean of densities in each cell from the formula : Weighted mean (number of items per km²) = ∑ (Distance (km) * Density (number of items per km²)) / ∑ Distance (km) Percentiles 50, 75, 95 & 99 were calculated taking into account data for all years. More information on data processing and calculation are detailed in the attached methodology document. Warning: the absence of data on the map does not necessarily mean that they do not exist, but that no information has been entered in the Marine Litter Database for this area. This work is based on the work presented in the following scientific article: O. Gerigny, M. Brun, M.C. Fabri, C. Tomasino, M. Le Moigne, A. Jadaud, F. Galgani, Seafloor litter from the continental shelf and canyons in French Mediterranean Water: Distribution, typologies and trends, Marine Pollution Bulletin, Volume 146, 2019, Pages 653-666, ISSN 0025-326X, https://doi.org/10.1016/j.marpolbul.2019.07.030.
-
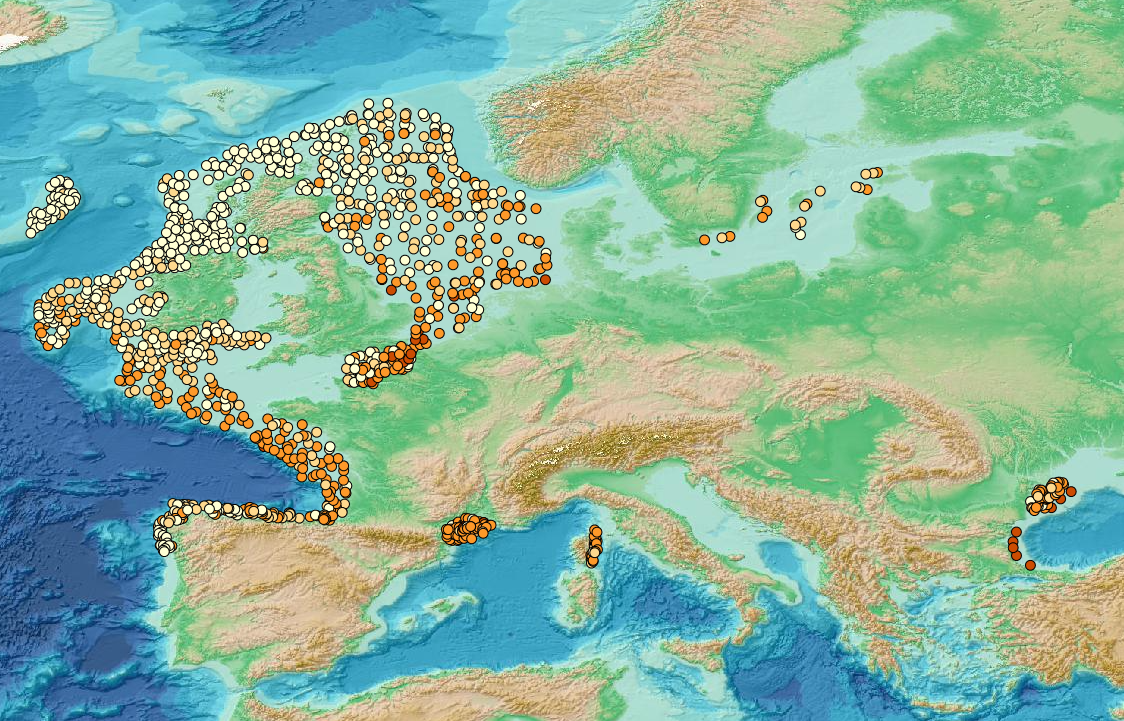
This visualization product displays the density of seafloor litter per trawl. EMODnet Chemistry included the collection of marine litter in its 3rd phase. Since the beginning of 2018, data of seafloor litter collected by international fish-trawl surveys have been gathered and processed in the EMODnet Chemistry Marine Litter Database (MLDB). The harmonization of all the data has been the most challenging task considering the heterogeneity of the data sources, sampling protocols (OSPAR and MEDITS protocols) and reference lists used on a European scale. Moreover, within the same protocol, different gear types are deployed during fishing bottom trawl surveys. In cases where the wingspread and/or number of items were unknown, data could not be used because these fields are needed to calculate the density. Data collected before 2011 are affected by this filter. When the distance reported in the data was null, it was calculated from: - the ground speed and the haul duration using this formula: Distance (km) = Haul duration (h) * Ground speed (km/h); - the trawl coordinates if the ground speed and the haul duration were not filled in. The swept area is calculated from the wingspread (which depends on the fishing gear type) and the distance trawled: Swept area (km²) = Distance (km) * Wingspread (km) Densities have been calculated on each trawl and year using the following computation: Density (number of items per km²) = ∑Number of items / Swept area (km²) Percentiles 50, 75, 95 & 99 have been calculated taking into account data for all years. More information on data processing and calculation are detailed in the document attached. Warning: the absence of data on the map doesn't necessarily mean that they don't exist, but that no information has been entered in the Marine Litter Database for this area.
-
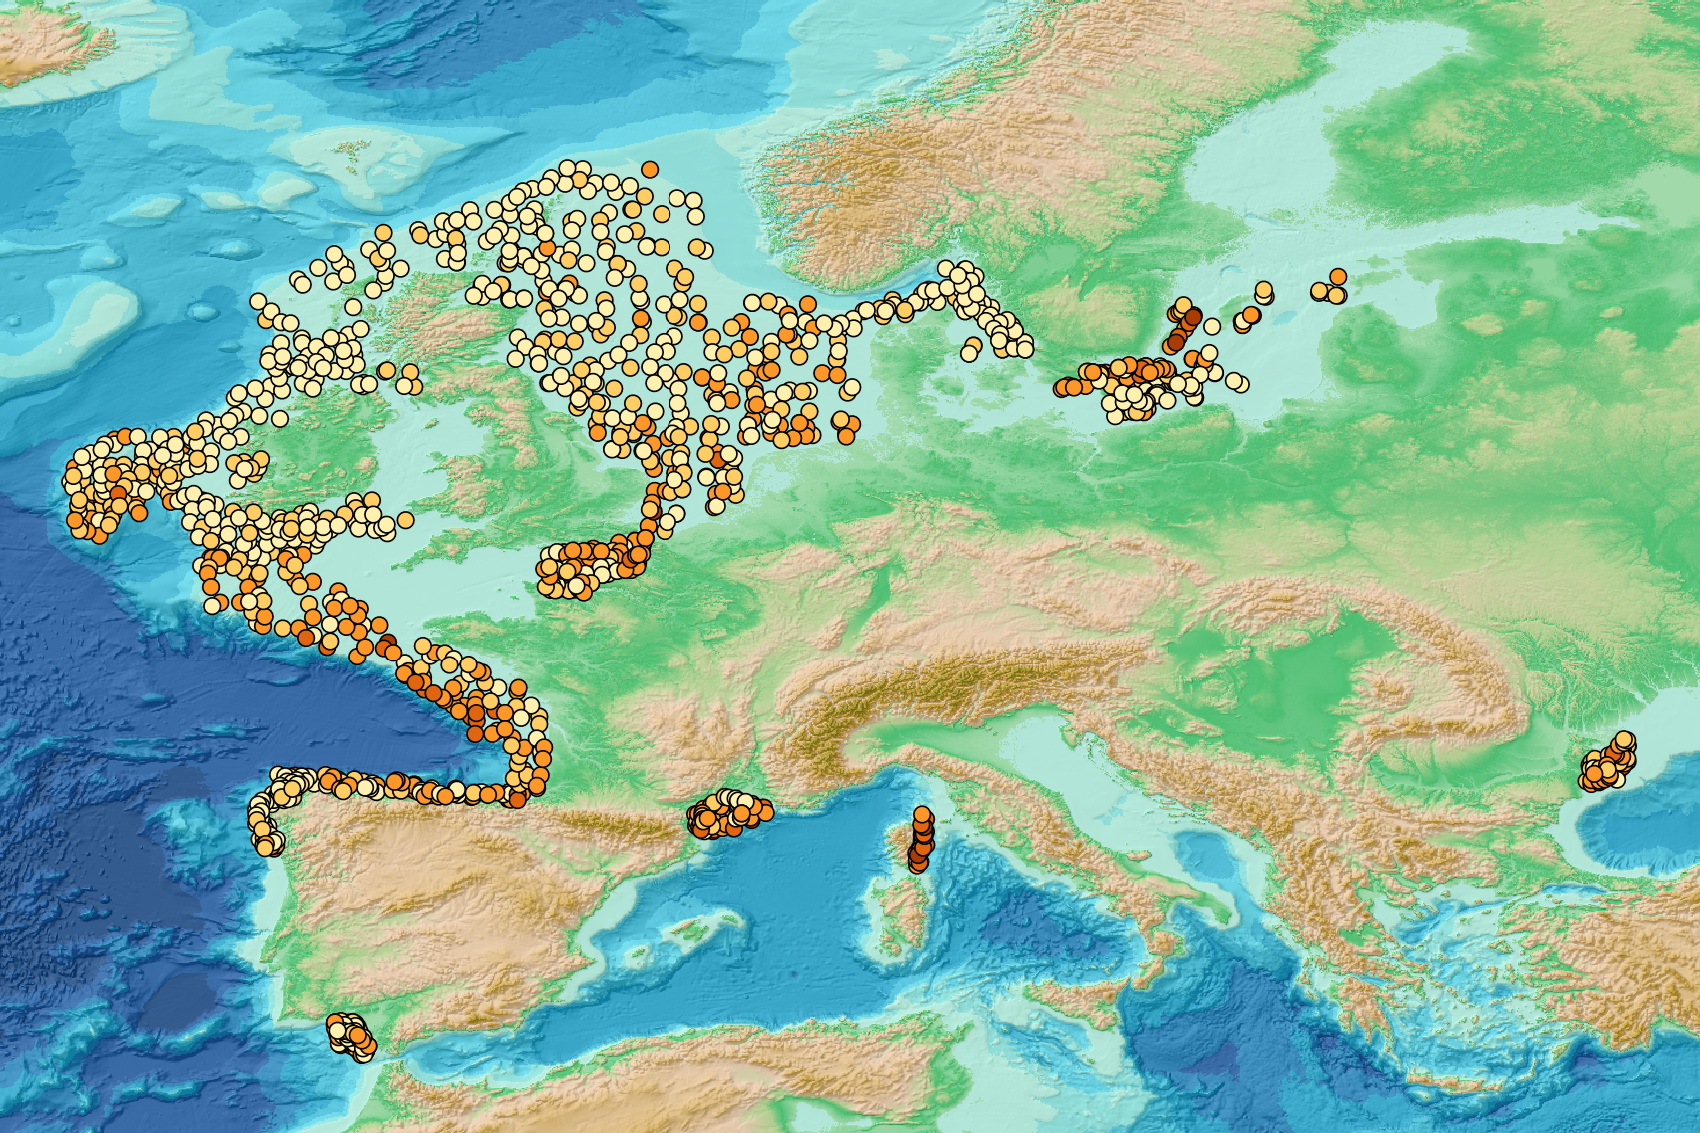
This visualization product displays the density of seafloor litter per trawl. EMODnet Chemistry included the collection of marine litter in its 3rd phase. Since the beginning of 2018, data of seafloor litter collected by international fish-trawl surveys have been gathered and processed in the EMODnet Chemistry Marine Litter Database (MLDB). The harmonization of all the data has been the most challenging task considering the heterogeneity of the data sources, sampling protocols (OSPAR and MEDITS protocols) and reference lists used on a European scale. Moreover, within the same protocol, different gear types are deployed during bottom trawl surveys. In cases where the wingspread and/or the number of items were/was unknown, it was not possible to use the data because these fields are needed to calculate the density. Data collected before 2011 are concerned by this filter. When the distance reported in the data was null, it was calculated from: - the ground speed and the haul duration using the following formula: Distance (km) = Haul duration (h) * Ground speed (km/h); - the trawl coordinates if the ground speed and the haul duration were not filled in. The swept area was calculated from the wingspread (which depends on the fishing gear type) and the distance trawled: Swept area (km²) = Distance (km) * Wingspread (km) Densities were calculated on each trawl and year using the following computation: Density (number of items per km²) = ∑Number of items / Swept area (km²) Percentiles 50, 75, 95 & 99 were calculated taking into account data for all years. More information on data processing and calculation are detailed in the attached document. Warning: the absence of data on the map does not necessarily mean that they do not exist, but that no information has been entered in the Marine Litter Database for this area.
-
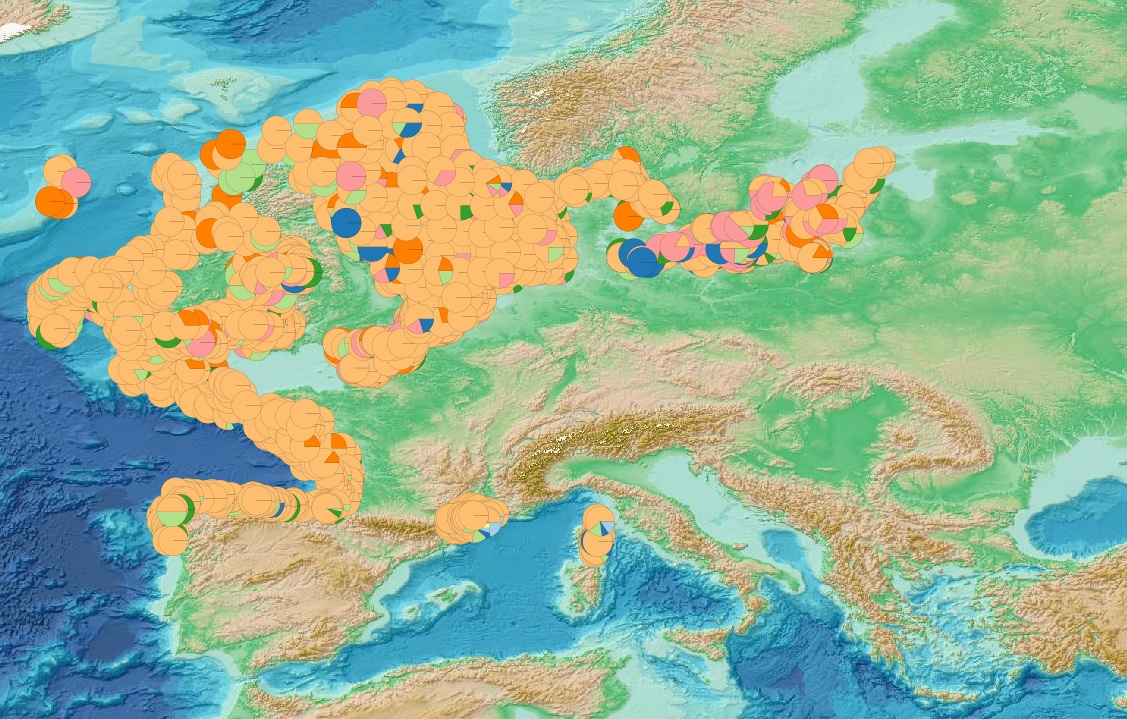
This visualization product displays the marine litter material categories percentage per trawl. EMODnet Chemistry included the collection of marine litter in its 3rd phase. Since the beginning of 2018, data of seafloor litter collected by international fish-trawl surveys have been gathered and processed in the EMODnet Chemistry Marine Litter Database (MLDB). The harmonization of all the data has been the most challenging task considering the heterogeneity of the data sources, sampling protocols (OSPAR and MEDITS protocols) and reference lists used on a European scale. Moreover, within the same protocol, different gear types are deployed during fishing bottom trawl surveys. Unlike other EMODnet seafloor litter products, all trawls surveyed since 2007 are included in this map even if the wingspread and/or the distance are unknown. Only surveys with an unknown number of items were excluded from this product. Harmonization of the material categories between ICES and MEDITS lists has been performed and the following calculation has been applied: Material % = (∑Number of items of each material category*100)/(∑Number of items of all material categories) More information on data processing and calculation are detailed in the document attached. Warning: the absence of data on the map doesn't necessarily mean that they don't exist, but that no information has been entered in the Marine Litter Database for this area.