 Catalogue PIGMA
environment
Type of resources
Available actions
Topics
Keywords
Contact for the resource
Provided by
Years
Formats
Representation types
Update frequencies
status
Scale
Resolution
-

Metagenomic analysis of clams from Sanaga river in Cameroon to describe the virome
-

Analysis of tuna stomach contents
-
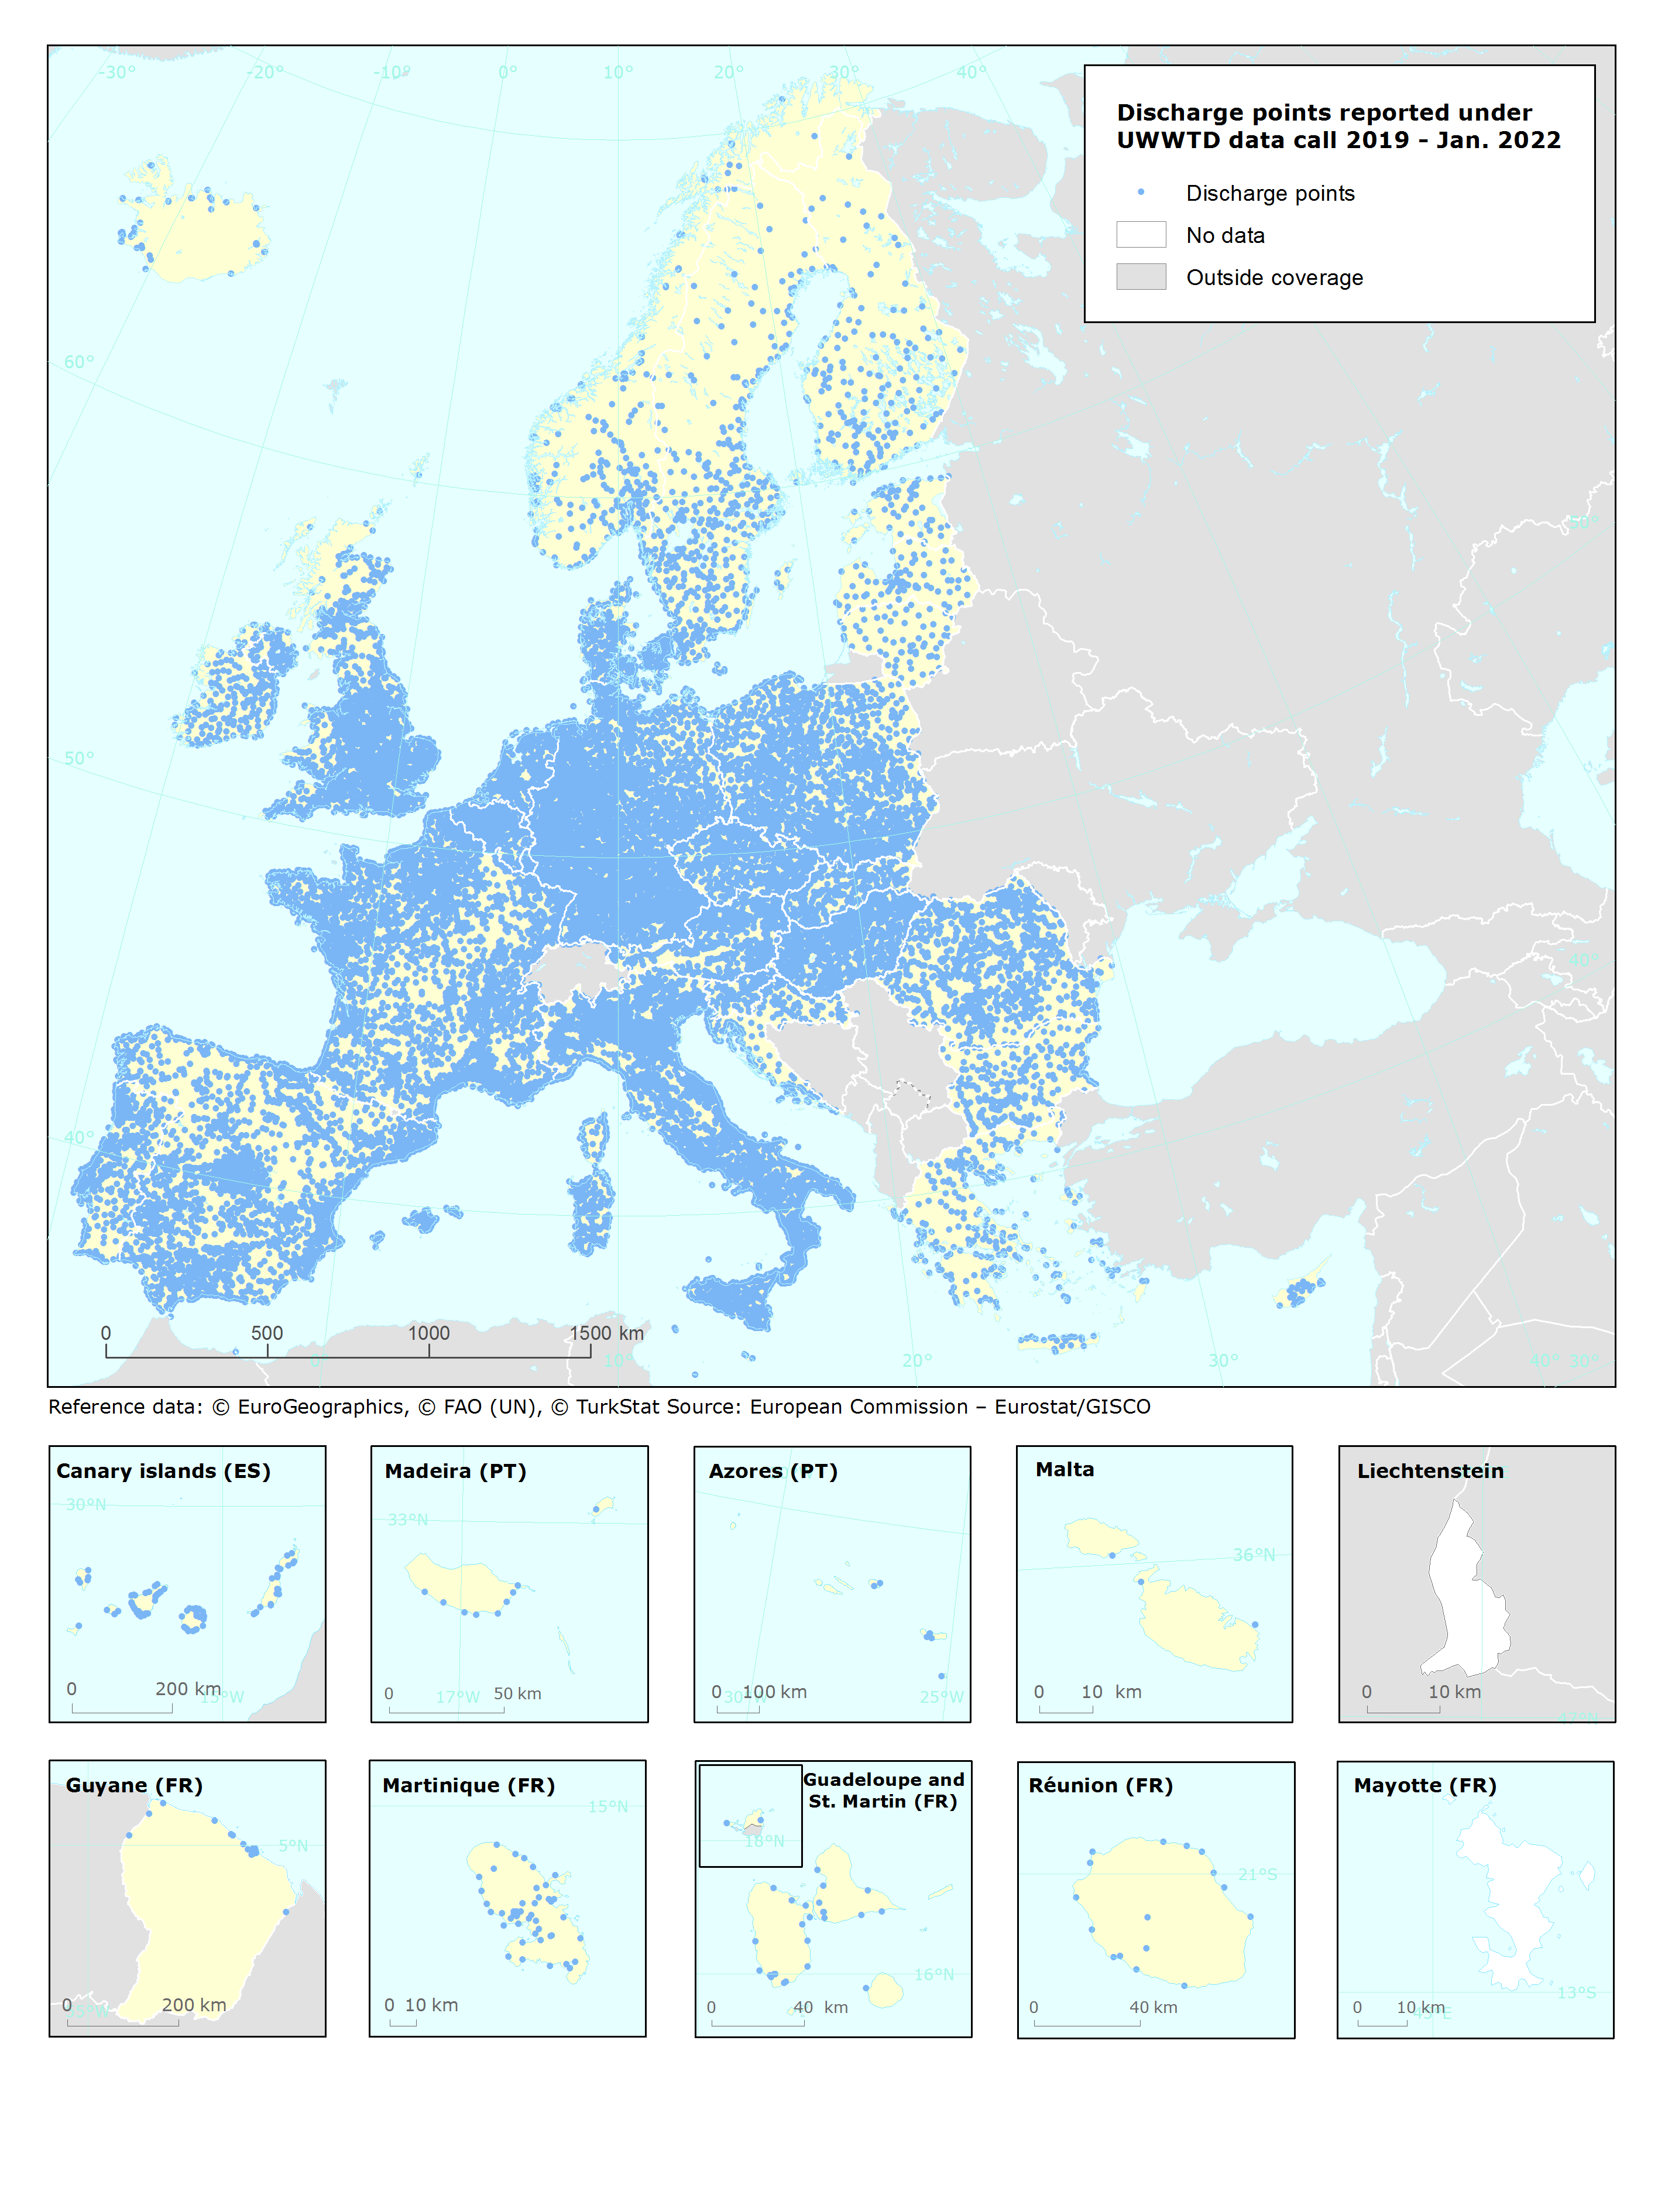
UWWTD Discharge Points, Jan. 2022 is one of the datasets produced within the frame of the reporting under 11th UWWTD Art.15 reporting period (UWWTD data call 2019). The Urban Waste Water Treatment Directive (UWWTD) (91/271/EEC) obliges Member States to report data on the implementation of the Directive upon request from the European Commission bi-annually. Reported data include receiving areas as designated under UWWTD, agglomerations, urban waste water treatment plants serving the agglomerations and points of discharges. Dataset UWWTD_DischargePoints contains information on individual points of discharge from urban waste water treatment plants or collecting systems, including their coordinates of discharge, link to specific treatment plant, type of receiving area into which the effluent / wastewater is discharged, related waterbody (or river basin), information on the discharge on land and potential reuse of the treated waste water. This dataset includes the reported discharge points which are displayed on the UWWTD maps (https://www.eea.europa.eu/themes/water/european-waters/water-use-and-environmental-pressures/uwwtd/interactive-maps/urban-waste-water-treatment-maps-3). The active discharge points with correct coordinates in the reported data were selected from the source European UWWTD tabular dataset, which is available on the download link https://www.eea.europa.eu/data-and-maps/data/waterbase-uwwtd-urban-waste-water-treatment-directive-7. The definition of the UWWTD Discharge Points dataset attributes (fields) is available on the link https://dd.eionet.europa.eu/datasets/latest/UWWTDArt15/tables/DischargePoints The full (internal) dataset including inactive discharge points is available under "Urban Waste Water Treatment Directive, Discharge points reported under UWWTD data call 2019 - INTERNAL VERSION, Jan. 2022". In comparison to the previous version (Nov. 2020), late redeliveries and corrections provided by several countries during 2021 are included in current revision. Next, the dataset is provided in GeoPackage and ESRI File geodatabase formats instead of shapefile used up to now, to avoid truncation of attribute names.
-

Individuals from 5 populations were kept in common garden conditions in order to examine acclimation and adaptation to temperature in the honeycomb worm. Worms were exposed to 5 temperature treatments, and collected for RNAseq analysis. Gene expression patterns were then examined.
-

Présentation de chiffres clés de la filière forêt-bois en région Nouvelle-Aquitaine sur : - les massifs forestiers (2000-2010) - les surfaces boisées (2009-2013) - la récolte (2013/ 2014) - le sciage (2013/ 2014) - le commerce extérieur (2015) - l'emploi (2013) - la formation (2014) - la production et la commercialisation des plants forestiers (2013-2014) - le prix des bois - déstockage (pin maritime) (2008-2015) - le plan gouvernemental suite à la tempête KLAUS (2015)
-

The ABYSS project aims at describing deep-sea benthic biodiversity spanning several branches of the tree of life with eDNA metabarcoding tools. To accommodate both micro- and macro biologists, we designed a bioinformatic pipeline based on Illumina read correction with Dada2 allowing analysing metabarcodes from prokaryotic and eukaryotic life compartments.
-
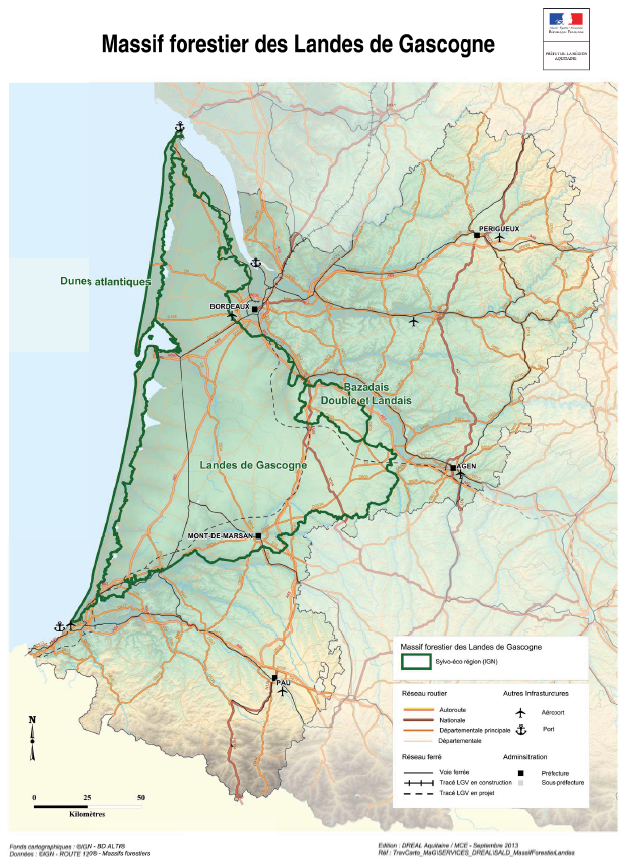
Ces travaux ont été réalisés dans le cadre de la Directive Territoriale d'Aménagement et de Développement Durable (DTADD) portée par la Préfecture de la région ex-Aquitaine. La partie I de ces travaux porte sur les valeurs du massif forestier des Landes de Gascogne. Le massif est dépositaire d’importantes valeurs et fonctions non marchandes d’intérêt général notamment : paysagères, naturalistes, hydrologiques et climatiques. Ce rapport explique également que les modes de valorisation du territoire, autres que ceux liés à la production de bois d’œuvre et d’industrie, interfèrent étroitement avec la présence même de la forêt de production : l'activité touristique, l'arrivée de nouveaux habitants et l'économie induite, ainsi que le foncier forestier.
-

Ce document se décompose en deux parties: La première énonce les valeurs et fonctions du massif forestier communes à tous les acteurs concernés par son avenir. La seconde présente les pressions et les enjeux qui pèsent sur le massif forestier des Landes de Gascogne.
-

Les ministères chargés de l'écologie (Meeddm) et de l'agriculture (Maap) ont confié au Gip Ecofor une mission d'expertise collective scientifique et technique à visée prospective sur « l'avenir du massif forestier des Landes de Gascogne ». Son objectif est de mobiliser la connaissance autour d'options envisageables pour assurer l'avenir du massif forestier landais et de la partager avec l'ensemble des parties intéressées. Les document disponibles sont les rapports finaux des groupes de travail et d'experts.
-

Successive infections with Vibrio harveyi were conducted in two populations of the European abalone in order to examine which genes may be involved in improved survival to the disease in the St. Malo population.