 Catalogue PIGMA
biota
Type of resources
Available actions
Topics
Keywords
Contact for the resource
Provided by
Years
Formats
Representation types
Update frequencies
status
Scale
Resolution
-

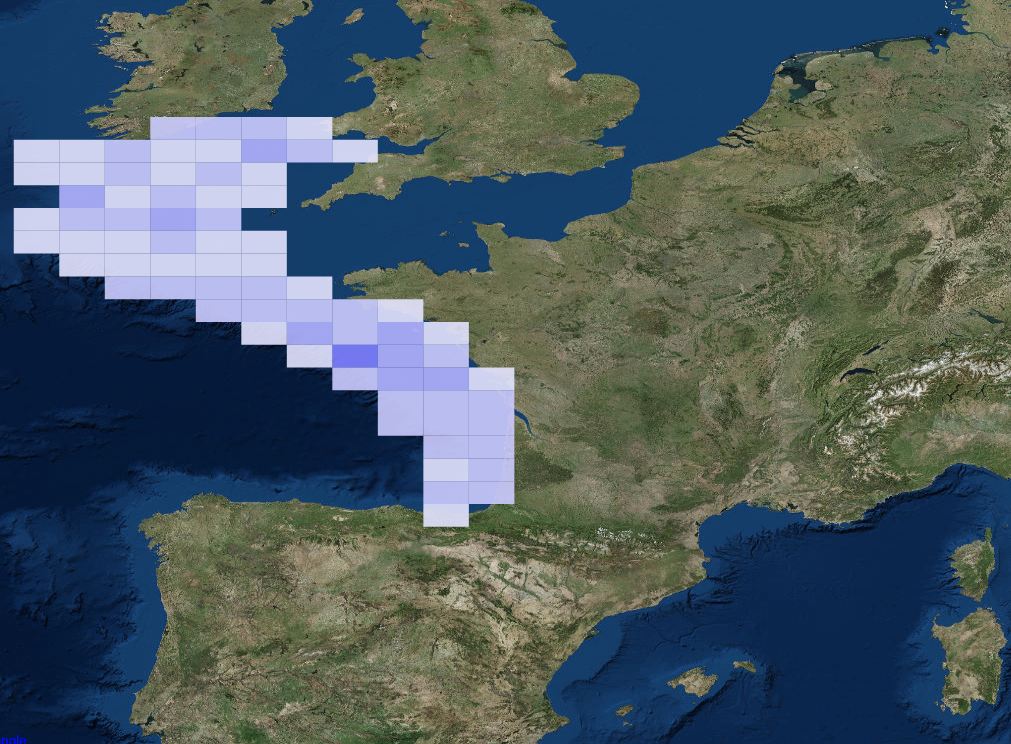
Species distribution models (GAM, Maxent and Random Forest ensemble) predicting the distribution of discrete Lophelia pertusa - Desmophylum pertusum colonies assemblage in the Celtic Sea. This community is considered ecologically coherent according to the cluster analysis conducted by Parry et al. (2015) on image samples. Modelling its distribution complements existing work on their definition and offers a representation of the extent of the areas of the North East Atlantic where they can occur based on the best available knowledge. This work was performed at the University of Plymouth in 2021.
-

Classification of the seabed in the Atlantic Ocean into broad-scale benthic habitats employing a non-hierarchical top-down clustering approach aimed at informing Marine Spatial Planning. This work was performed at the University of Plymouth in 2021 with data provided by a wide group of partners representing the nations surrounding the Atlantic Ocean. It classifies continuous environmental data into discrete classes that can be compared to observed biogeographical patterns at various scales. It has 3 levels of classification. The numbers in the raster layer correspond to individual classes. Description of these classes is given in McQuaid, K.A. et al. (2023).
-

Species distribution models (GAM, Maxent and Random Forest ensemble) predicting the distribution of Solitary Scleractinian fields assemblage in the Celtic Sea. This community is considered ecologically coherent according to the cluster analysis conducted by Parry et al. (2015) on image sample. Modelling its distribution complements existing work on their definition and offers a representation of the extent of the areas of the north-east Atlantic where they can occur based on the best available knowledge. This work was performed at the University of Plymouth in 2021.
-

The dataset includes age- and length-based catch per unit effort data for commercial fish species collected by the French trawl survey EVHOE.
-

Modelled density of the seapen Kophobelemnon stelliferum in the North East Atlantic. The Random Forest density model trained on data collected by an ROV was constrained by an ensemble of Maxent and Random Forest presence-absence model trained on a larger dataset also collected by an ROV. This species provides structural complexity in an environment where it is lacking and, thus, promotes higher biodiversity where they settle. They are vulnerable to mechanical disturbance of the sediment by fishing gear and a better understanding of their distribution will lead to better management of their population. This work was performed at the University of Plymouth in 2021.
-
ICES database of trawl surveys
-
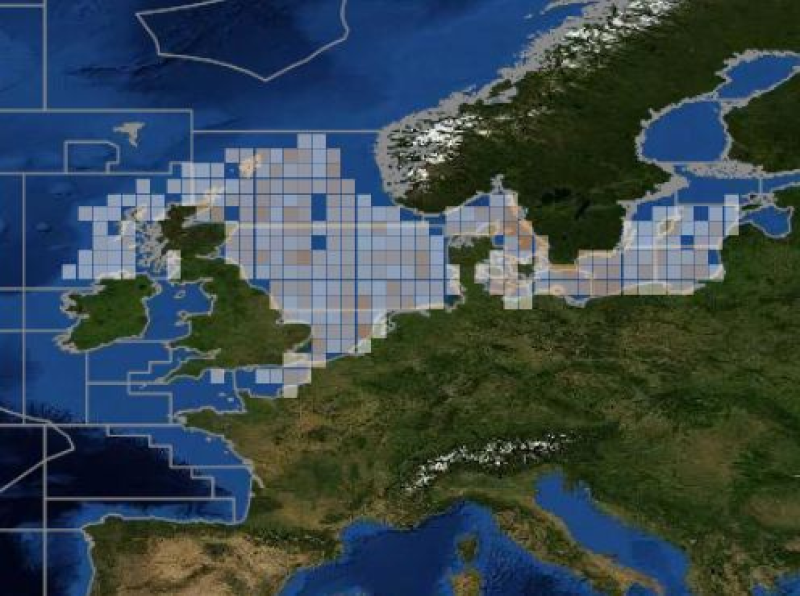
This metadata corresponds to the EUNIS Littoral biogenic habitat types (salt marshes), distribution based on vegetation plot data dataset. Littoral biogenic habitats (commonly known as salt marshes) are formed by animals such as worms and mussels or plants. The verified saltmarsh habitat samples used are derived from the Braun-Blanquet database (http://www.sci.muni.cz/botany/vegsci/braun_blanquet.php?lang=en) which is a centralised database of vegetation plots and comprises copies of national and regional databases using a unified taxonomic reference database. The geographic extent of the distribution data are all European countries except Armenia and Azerbaijan. The dataset is provided both in Geodatabase and Geopackage formats.
-
The dataset includes age- and length-based catch per unit effort data for commercial fish species collected by the French trawl survey EVHOE.
-

Classification of the Atlantic Ocean seabed into broad-scale benthic habitats employing a hierarchical top-down clustering approach aimed at informing Marine Spatial Planning. This work was performed at the University of Plymouth in 2021 with data provided by a wide group of partners representing the nations surrounding the Atlantic Ocean. It classifies continuous environmental data into discrete classes that can be compared to observed biogeographical patterns at various scales. It has 3 levels of classification. For ease of use, a layer is provided for each level. Level 1 has 4 classes. Level 2 has 15 classes nested within level 1. Layers indices are 2 digits (1[level1 class index]1[level 2 class index]). Level 3 has 157 classes nested within level 2 and class names have 4 digits (1digit[level1 class index]1[level 2 class index]2[level 3 class index]). Note that the classification was performed for the whole world and thus it has more classes than in the presented layer.
-
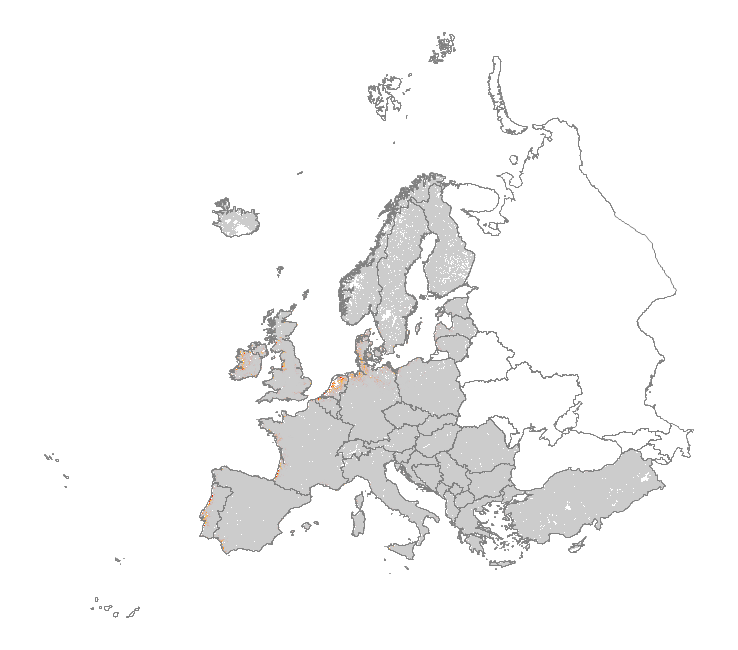
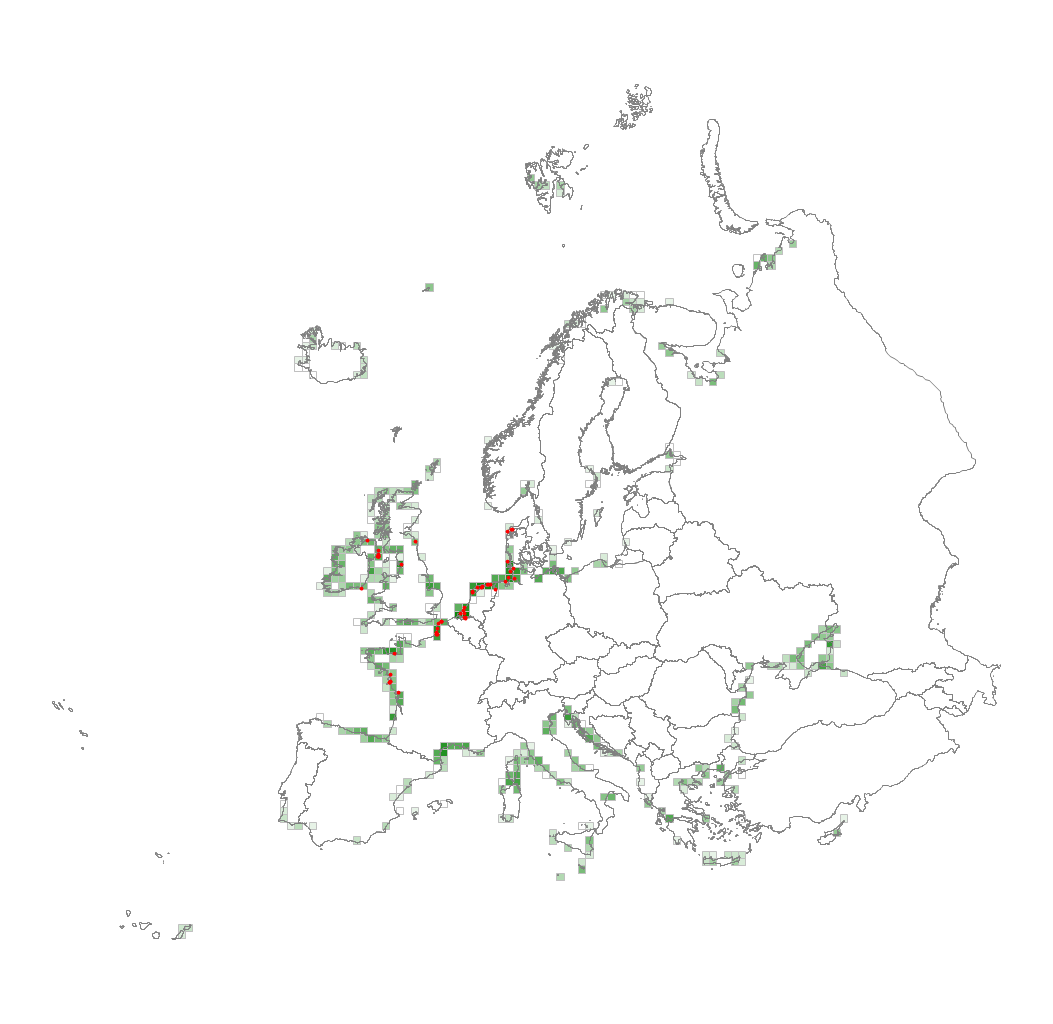
This metadata corresponds to the EUNIS Coastal habitat types, predicted distribution of habitat suitability dataset. Coastal habitats are those above spring high tide limit (or above mean water level in non-tidal waters) occupying coastal features and characterised by their proximity to the sea, including coastal dunes and wooded coastal dunes, beaches and cliffs. Includes free-draining supralittoral habitats adjacent to marine habitats which are normally only very rarely subject to any type of salt water, in as much as they may be inhabited predominantly by terrestrial species, strandlines characterised by terrestrial invertebrates and moist and wet coastal dune slacks and dune-slack pools. Supralittoral sands and wracks may be found also in marine habitats (M). Excludes supralittoral rock pools and habitats, the splash zone immediately above the the mean water line, as well the spray zone and zone subject to sporadic inundation with salt water in as much as it may be inhabited predominantly by marine species, which are included in marine (M). The modelled suitability for EUNIS coastal habitat types is an indication of where conditions are favourable for the habitat type based on sample plot data (Braun-Blanquet database) and the Maxent software package. The modelled suitability map may be used as a proxy for the geographical distribution of the habitat type. Note however that it is not representing the actual distribution of the habitat type. As predictors for the suitability modelling not only climate and soil parameters have been taken into account, but also so-called RS-EVB's, Remote Sensing-enabled Essential Biodiversity Variables, like land use, vegetation height, phenology, and LAI (Leaf Area Index). Because the EBV's are restricted by the extent of the remote sensing data (EEA38 countries and the United Kingdom) the modelling result does also not go beyond this boundary. The dataset is provided both in Geodatabase and Geopackage formats.