 Catalogue PIGMA
/Biological Environment/Habitats
Type of resources
Available actions
Topics
Keywords
Contact for the resource
Provided by
Years
Formats
Representation types
status
Scale
Resolution
-
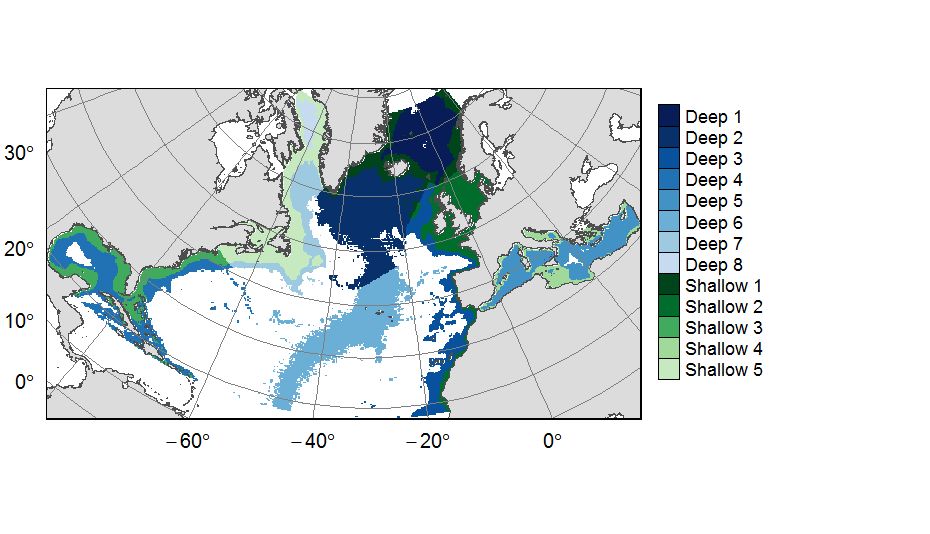
Planning units layers used for ATLAS EU prioritization scenarios on the North Atlantic (18°N to 76°N and 36°E to 98°W). This raster layer is designed on a grid of 25km * 25km resolution, that served to extract all the spatial data used prioritization. The 31 518 planning units (cells with value) corresponded to areas containing depths shallower or equal to 3500m, even if they could also contain deeper areas locally. For connectivity scenarios, only the planning units matching with the extent of available connectivity data were selected. One layer allocates planning units to the 13 geographical provinces (values ranging from 1 to 13) created for the purpose of prioritization. This dataset was built to feed a basin-wide spatial conservation planning exercise, targeting the deep sea of the North Atlantic. The goal of this approach was to identify conservation priority areas for Vulnerable Marine Ecosystems (VMEs) and deep fish species, based on the distribution of species and habitats, human activities and current spatial management.
-

The code and files contained in this repository support replication of a broad-scale benthic habitat classification of the South Atlantic produced by McQuaid et al. (2023). We used statistical clustering algorithms to classify broad-scale (10km2) environmental data into distinct habitat classes, which reflect variation in physical conditions and we assume support distinct biological communities. We request that any use of the input data is referenced as per the table below, and that classification outputs are referenced as: McQuaid K. A. Bridges A. E. H., Howell K. L., Gandra T. B. R., de Souza V., Currie J. C., Hogg O. T., Pearman T. R. R., Bell J. B. B., Atkinson L. J., Baum D., Bonetti J., Carranza A., Defeo O., Furey T., Gasalla M. A., Golding N, Hampton S. L., Horta S., Jones D. O. B., Lombard A. T., Manca E., Marin Y., Martin S., Mortensen P., Passdore C., Piechaud N., Sink K. J. & Yool A. 2023. Broad-scale benthic habitat classification of the South Atlantic. Progress in Oceanography. DOI: https://doi.org/10.1016/j.pocean.2023.103016
-

These rasters correspond to the environmental predictors used in the production of Mediterranean bioregions of megabenthic communities
-

The shapefile corresponds to areas where predicted bioregions were extrapolated for lack of benthic in-situ observations.
-

The rasters correspond to the prediction uncertainties associted with the production of Mediterranean bioregions of megabenthic communities
-

The raster corresponds to the predicted Mediterranean bioregions of megabenthic communities.
-
This is a compilation of OSPAR habitat point data for the northeast Atlantic submitted by OSPAR contracting parties. The compilation is coordinated by the UK's Joint Nature Conservation Committee, working with a representative from each of the OSPAR coastal contracting parties. This public dataset does not contain records relating to sensitive species (e.g. Ostrea edulis) in specific areas, or where data are restricted from public release by the owner's use limitations. This version (v2020) was published in July 2021.
-
Output of the 2019 EUSeaMap broad-scale predictive model, produced by EMODnet Seabed Habitats and aggregated into the Benthic Broad Habitat Types of the Marine Strategy Framework Directive (as defined in the Commission Decision 17 May 2017). The extent of the mapped area includes the Mediterranean Sea, Black Sea, Baltic Sea, and areas of the North Eastern Atlantic extending from the Canary Islands in the south to the Barents Sea in the north. The map was produced using a "top-down" modelling approach using classified habitat descriptors to determine a final output habitat. Habitat descriptors differ per region but include: - Biological zone - Energy class - Oxygen regime - Salinity regime - Seabed substrate - Riverine input Habitat descriptors (excepting Substrate) are calculated using underlying physical data and thresholds derived from statistical analyses or expert judgement on known conditions.
-
Seabed Habitats was one of seven themes of the European Marine Observation and Data Network (EMODnet) initiative, funded by the European Maritime and Fisheries Fund. Since its inception in 2009, EMODnet Seabed Habitats developed, improved and gradually increased the coverage of a broad-scale seabed habitat map for Europe's seabed, also known as EUSeaMap. In addition, EMODnet Seabed Habitats continued the work started by MESH and MESH Atlantic projects in collating and making available seabed habitat maps from surveys, through the EMODnet Seabed Habitats map viewer. In it's third Phase (2017-2019), EMODnet Seabed Habitats collated and provided habitat point data and the outputs of habitat distribution modelling, and the third phase has now been extended to 2021. The extended third phase of the project will: - Continue to grow Europe's only comprehensive library of habitat maps from surveys and collection of survey sample points - Create new composite data products to add to those for the Essential Ocean Variable habitats and OSPAR threatened and/or declining habitats - Update the EMODnet broad-scale seabed habitat map for Europe (EUSeaMap) using the next seabed substrate update from EMODnet Geology - Update web content with extra resources for habitat mapping, including a catalogue highlighting all the most useful data products
-
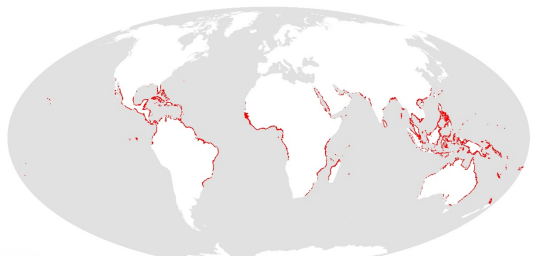
This dataset shows the global distribution of mangroves, and was produced as joint initiatives of the International Tropical Timber Organization (ITTO), International Society for Mangrove Ecosystems (ISME), Food and Agriculture Organization of the United Nations (FAO), UN Environment World Conservation Monitoring Centre (UNEP-WCMC), United Nations Educational, Scientific and Cultural Organization’s Man and the Biosphere Programme (UNESCO-MAB), United Nations University Institute for Water, Environment and Health (UNU-INWEH) and The Nature Conservancy (TNC). Major funding was provided by ITTO through a Japanese Government project grant; the project was implemented by ISME.