 Catalogue PIGMA
EMODnet
Type of resources
Available actions
Topics
Keywords
Contact for the resource
Provided by
Years
Formats
Representation types
Update frequencies
status
Scale
Resolution
-

This layer shows the current known extent and distribution of live hard coral cover in European waters, collated by EMODnet Seabed Habitats. The polygons portion was last updated in 2019. The points were added in Sept 2021. Lophelia pertusa and Coral gardens are both on the OSPAR List of threatened and/or declining species and habitats. The purpose was to produce a data product that would provide the best compilation of evidence for the essential ocean variable (EOV) known as Hard coral cover and composition (sub-variable: Live hard coral cover and extent), as defined by the Global Ocean Observing System (GOOS). This data product should be considered a work in progress and is not an official product.
-
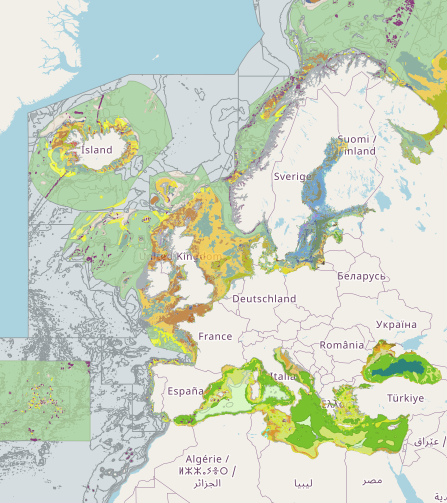
Output of the 2019 EUSeaMap broad-scale predictive model, produced by EMODnet Seabed Habitats. The extent of the mapped area includes the Mediterranean Sea, Black Sea, Baltic Sea, and areas of the North Eastern Atlantic extending from the Canary Islands in the south to the Barents Sea in the north. The map was produced using a "top-down" modelling approach using classified habitat descriptors to determine a final output habitat. Habitat descriptors differ per region but include: Biological zone Energy class Oxygen regime Salinity regime Seabed substrate Riverine input Habitat descriptors (excepting Substrate) are calculated using underlying physical data and thresholds derived from statistical analyses or expert judgement on known conditions. The model is produced using R and Arc Model Builder (10.1). The model was created using raster input layers with a cell size of 0.00104dd (roughly 100 metres). The model includes the sublittoral zone only; due to the high variability of the littoral zone, a lack of detailed substrate data and the resolution of the model, it is difficult to predict littoral habitats at this scale. This map follows the EUNIS 2007-11 classification system where it is appropriate. It has also been classified according to MSFD Benthic Broad Habitat types. This report details the methods used in the previous version (v2016) - a new report is in progress: Populus J. And Vasquez M. (Eds), 2017. EUSeaMap, a European broad-scale seabed habitat map. Ifremer Available from: http://archimer.ifremer.fr/doc/00388/49975/
-
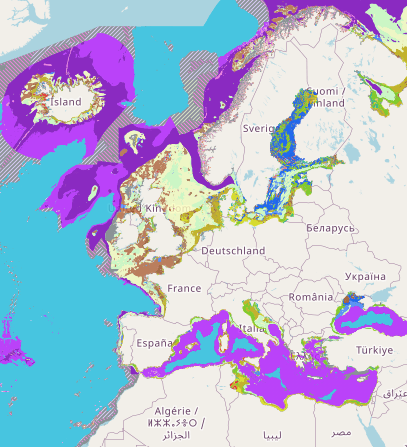
Output of the 2019 EUSeaMap broad-scale predictive model, produced by EMODnet Seabed Habitats and aggregated into the Benthic Broad Habitat Types of the Marine Strategy Framework Directive (as defined in the Commission Decision 17 May 2017). The extent of the mapped area includes the Mediterranean Sea, Black Sea, Baltic Sea, and areas of the North Eastern Atlantic extending from the Canary Islands in the south to the Barents Sea in the north. The map was produced using a "top-down" modelling approach using classified habitat descriptors to determine a final output habitat. Habitat descriptors differ per region but include: - Biological zone - Energy class - Oxygen regime - Salinity regime - Seabed substrate - Riverine input Habitat descriptors (excepting Substrate) are calculated using underlying physical data and thresholds derived from statistical analyses or expert judgement on known conditions.
-

The EMODnet Bathymetry portal is operated and further developed by a European partnership. This comprises members of the SeaDataNet consortium together with organisations from marine science, the hydrographic survey community, and industry. The partners combine expertises and experiences of collecting, processing, and managing of bathymetric data together with expertises in distributed data infrastructure development and operation and providing OGC services (WMS, WFS, and WCS) for viewing and distribution. SeaDataNet is a leading infrastructure in Europe for marine & ocean data management, initiated and managed by the National Oceanographic Data Centres (NODC's). It is actively operating and further developing a Pan-European infrastructure for managing, indexing and providing access to ocean and marine data sets and data products, acquired via research cruises and other in-situ observational activities. The basis of SeaDataNet is interconnecting Data Centres into a distributed network of data resources with common standards for metadata, vocabularies, data transport formats, quality control methods and flags, and access. SeaDataNet is aiming for an extensive coverage of available data sets for the various marine environmental disciplines, such as physical oceanography, marine chemistry, biology, biodiversity, geology, geophysics and bathymetry. This is implemented by seeking active cooperation at a national scale with institutes and at a European scale with communities, that are engaged in data management for these disciplines, and by seeking opportunities for including their data centres and data collections in the SeaDataNet metadata and data provision.
-
-

-
This dataset stems from the Joint Research Centre (JRC) Biomass Mandate (https://knowledge4policy.ec.europa.eu/projects-activities/jrc-biomass-mandate_en) and it is available for viewing and download on EMODnet - Human Activities web portal (www.emodnet-humanactivities.eu) and on the platform from the European Commission’s Knowledge Centre for Bioeconomy (https://knowledge4policy.ec.europa.eu/visualisation/bioeconomy-different-countries_en#algae_prod_plants). Its aim is to build a reliable database to characterize the algae sector and to support informed European policies on Blue Growth and Bioeconomy. More detailed information on the Status of the Algae Production Industry in Europe can be found in a JRC-led study published in Frontiers in Marine Science (https://publications.jrc.ec.europa.eu/repository/handle/JRC122250). Information on the location (geographic coordinates) of the production facilities, group of produced organism (macroalgae, microalgae and spirulina), production method (Fermenters, Harvesting , Photobioreactors, Open ponds, Semi Open ponds, land-based or at sea Aquaculture, Integrated multi-trophic or not) and species (see dataset) have been collected in the following countries: Austria, Belgium, Bulgaria, Croatia, Czech Republic, Denmark, Estonia, Faroe Islands, France, Germany, Greece, Greenland, Hungary, Iceland, Ireland, Italy, Latvia, the Netherlands, Norway, Portugal, Spain, Sweden, Switzerland and the UK. In November 2021, the JRC has updated the database with the latest information on the production units operational at the time.
-
EUSeaMap 2021 is the fifth iteration of EUSeaMap. All versions have been produced as part of the EMODnet Seabed Habitats project, which is one of several thematic lots in EMODnet. The project has brought together a European consortium of specialists in benthic ecology and seabed habitat mapping. The partners first collaborated in EMODnet phase 1 (2009-2012) to deliver a prototype predictive seabed habitat map in four trial basins (Greater North Sea, Celtic Seas, Baltic, Western Mediterranean). This predictive model was named EUSeaMap (Cameron and Askew, 2011). In EMODnet Phase 2 (2012-2016), the consortium extended EUSeaMap coverage to all European regions (Populus et al, 2017). In phase 3 (2017-2021), a first version (2019) extended the spatial coverage further North in order to include the Barents Sea, developed better environmental data were incorporated, and dramatically improved the spatial detail. The new version, developed in the period 2019-2021 and named 2021, is substantially evolved from the previous version as it accounts for new seabed substrate data published by EMODnet Geology in 2021, including in Denmark, Estonia, France, Ireland, Italy, Latvia, Norway and Spain, 2) is published in new classifications, including the new version of the marine section of EUNIS, named EUNIS 2019 and 3) addresses some issues identified in EUSeaMap 2019.
-
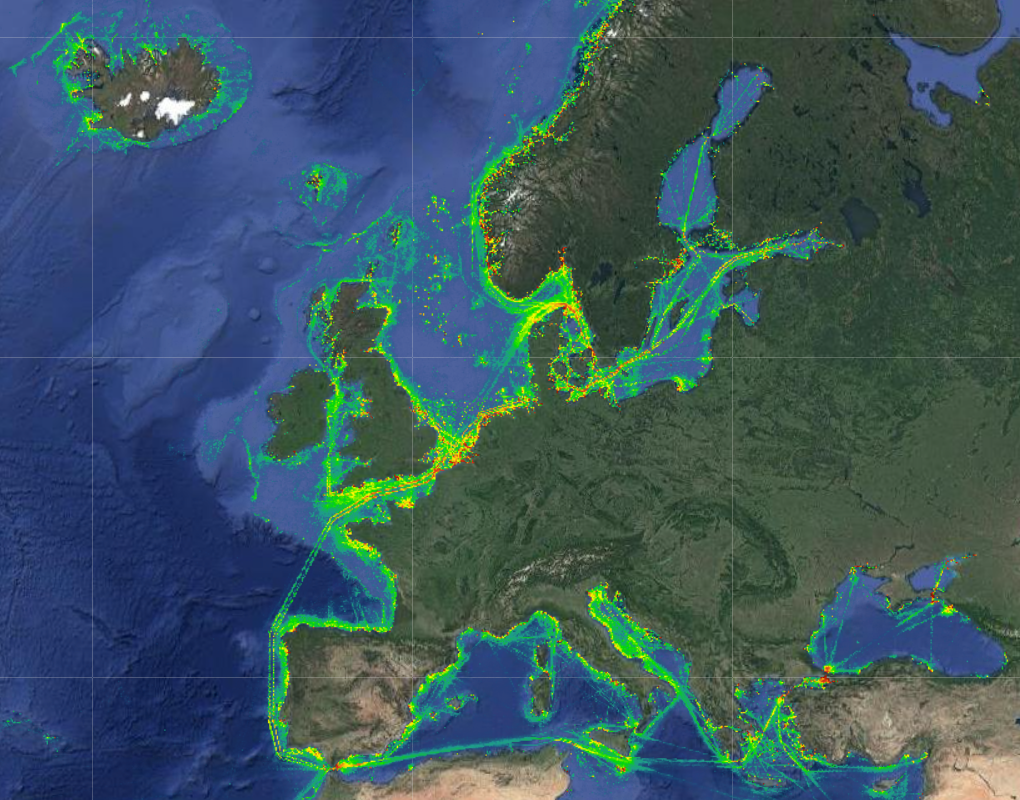
The Vessel Density maps in the EU were created in 2019 by Cogea for the European Marine Observation and Data Network (EMODnet). The dataset is updated every year and is available for viewing and download on EMODnet Human Activities web portal (www.emodnet-humanactivities.eu). The maps are based on AIS data yearly purchased from Collecte Localisation Satellites (CLS) and ORBCOMM. The maps, GeoTIFF format, show shipping density in 1x1km cells of a grid covering all EU waters and some neighbouring areas. Density is expressed as hours per square kilometre per month. The following ship types are available:0 Other, 1 Fishing, 2 Service, 3 Dredging or underwater ops, 4 Sailing, 5 Pleasure Craft, 6 High speed craft, 7 Tug and towing, 8 Passenger, 9 Cargo, 10 Tanker, 11 Military and Law Enforcement, 12 Unknown and All ship types. Data are available by month of year. Yearly averages are also available.
-

The dataset on Natura 2000 sites was created in 2014 by Cogea for the European Marine Observation and Data Network. It is entirely based on spatial data from the European Environmental Agency (EEA), plus additional info, links and selected EEA data joined to the feature attributes, as well as a calculation by Cogea of marine and coastal location of features. It is available for viewing and download on EMODnet - Human Activities web portal (www.emodnet-humanactivities.eu). Natura 2000 is an ecological network composed of sites designated under the Birds Directive (Special Protection Areas, SPAs) and the Habitats Directive (Sites of Community Importance, SCIs, and Special Areas of Conservation, SACs). The dataset covers the whole EU. Following the United Kingdom’s withdrawal from the EU on 31 January 2020, it ceased to be part of the EEA’s institutional networks and governance. In the webmap the EEA dataset has been filtered by Cogea to show only (i) marine sites, i.e. sites with a marine area percentage higher than 0 (as calculated by the EEA) and (ii) sites that, even if not identified as marine by the EEA, intersect the EEA coastline or that are within a distance of 1 km from the coastline (using a 1 km inner buffer from the EEA coastline). In both cases the COAST_MAR field value=1. The EEA coastline dataset is available at https://www.eea.europa.eu/data-and-maps/data/eea-coastline-for-analysis-2. Compared with the previous version, this one includes the updated dataset 'Natura 2000 End 2020', published by the EEA in July 2021. For further information (e.g. biogeographic region, directive, habitats, sites, impact, management, species and metadata) please visit the EEA's website hosting the Natura 2000 tabular data.