 Catalogue PIGMA
coast
Type of resources
Available actions
Topics
Keywords
Contact for the resource
Provided by
Years
Formats
Representation types
Update frequencies
Scale
Resolution
-
Coastal zones are presented as a series of 10 consecutive buffers of 1km width each (towards inland). For this dataset, were treated as sea data all areas with a class value of 523 (sea and ocean) in Corine Land Cover (details in lineage).
-
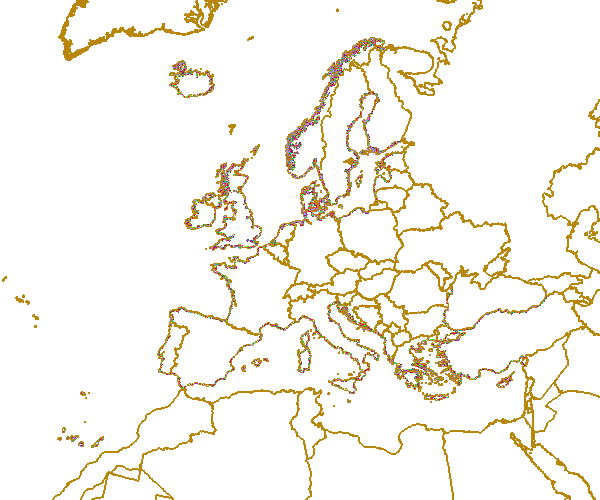
Coastal zones are presented as a series of 10 consecutive buffers of 1km width each (towards inland). For this dataset, were treated as sea data all areas with a class value of 523 (sea and ocean) in Corine Land Cover (details in lineage).
-

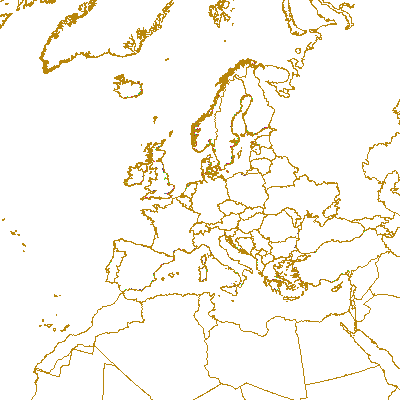
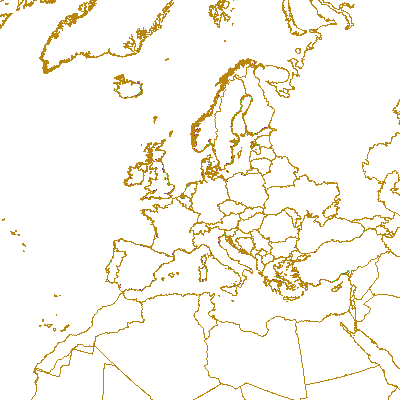
The EEA coastline dataset is created for detailed analysis with a Minimum Mapping Unit of e.g. 1:100000, for geographical Europe. The coastline is a hybrid product obtained from satellite imagery from two projects: 1) EUHYDRO (Pan-European hydrographic and drainage database) [https://land.copernicus.eu/pan-european/satellite-derived-products/eu-hydro/view] and 2) GSHHG (A Global Self-consistent, Hierarchical, High-resolution Geography Database) [http://www.soest.hawaii.edu/pwessel/gshhg/]. The defining criteria was altitude level = 0 from EUDEM [https://land.copernicus.eu/pan-european/satellite-derived-products/eu-dem/view]. Outside the coverage of the EUDEM, the coastline from GSHHG was used without modifications. A few manual amendments to the dataset were necessary to meet requirements from EU Nature Directives, Water Framework Directive and Marine Strategy Framework Directive. In 2015, several corrections were made in the Kalogeroi Islands (coordinates 38.169, 25.287) and two other Greek little islets (coordinates 36.766264, 23.604318), as well as in the peninsula of Porkkala (around coordinates 59.99, 24.42). In this revision (v3, 2017), 2 big lagoons have been removed from Baltic region, because, according to HELCOM, are freshwater lagoons. This dataset is a polygon usable as a water-land mask.
-
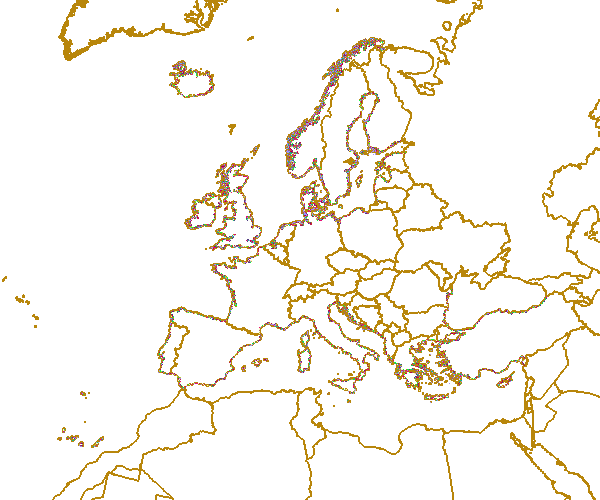
Coastal zones are presented as a series of 10 consecutive buffers of 1km width each (towards inland). For this dataset, were treated as sea data all areas with class values of 52x (521: coastal lagoons, 522: estuaries, 523: sea and ocean) in Corine Land Cover (details in lineage).
-
The EEA coastline for analysis is created for highly detailed analysis, e.g. 1:100 000, for geographical Europe. The coastline is a hybrid product obtained from projects using satellite imagery as data source: EUHYDRO (https://land.copernicus.eu/imagery-in-situ/eu-hydro) and GSHHG (http://www.soest.hawaii.edu/pwessel/gshhg/). The defining criteria was altitude level = 0 from EUDEM (https://land.copernicus.eu/pan-european/satellite-derived-products/eu-dem/view). Outside the coverage of the EUDEM, the coastline from GSHHG was used without modifications. A few manual amendments to the dataset were necessary to meet requirements from EU Nature Directives, Water Framework Directive and Marine Strategy Framework Directive. In 2015, several corrections were made in the Kalogeroi Islands (coordinates 38.169, 25.287) and two other Greek little islets (coordinates 36.766264, 23.604318), as well as in the peninsula of Porkkala (around coordinates 59.99, 24.42). In this revision (v3, 2017), 2 big lagoons have been removed from Baltic region, because, according to HELCOM, are freshwater lagoons.
-
Coastal zones are presented as a series of 10 consecutive buffers of 1km width each (towards inland). For this dataset, were treated as sea data all areas with class values of 52x (521: coastal lagoons, 522: estuaries, 523: sea and ocean) in Corine Land Cover (details in lineage).
-
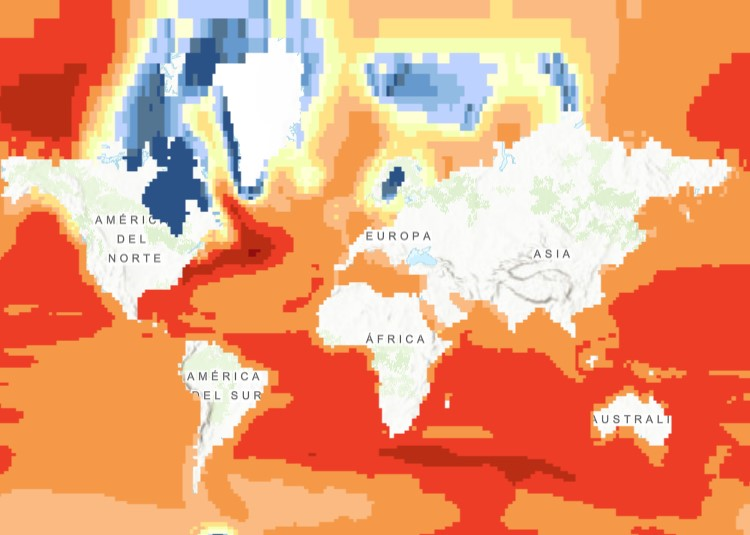
The raster dataset (1ºx1º) shows the projected change in relative sea level (in metres) in 2081-2100 compared to 1986-2005 for the medium-low emission scenario RCP4.5, based on an ensemble of Coupled Model Intercomparison Project Phase 5 (CMIP5) climate models. Projections consider land movement due to glacial isostatic adjustment but not land subsidence due to human activities. No projections are available for the Black Sea. The dataset has been used as a source for an earlier version of the EEA indicator “Global and European Sea Level”: https://www.eea.europa.eu/data-and-maps/indicators/sea-level-rise-5/assessment.
-
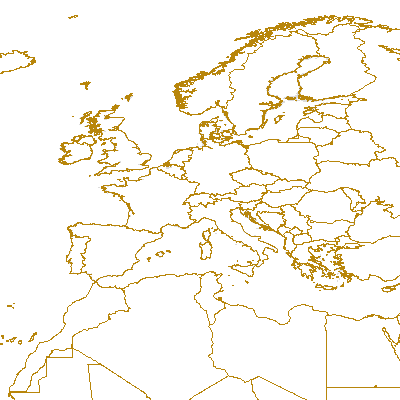
This dataset is the coastal zone land surface region from Europe, derived from the coastline towards inland, as a series of 10 consecutive buffers of 1km width each. The coastline is defined by the extent of the Corine Land Cover 2018 (raster 100m) version 20 accounting layer. In this version all Corine Land Cover pixels with a value of 523, corresponding to sea and oceans, were considered as non-land surface and thus were excluded from the buffer zone.
-
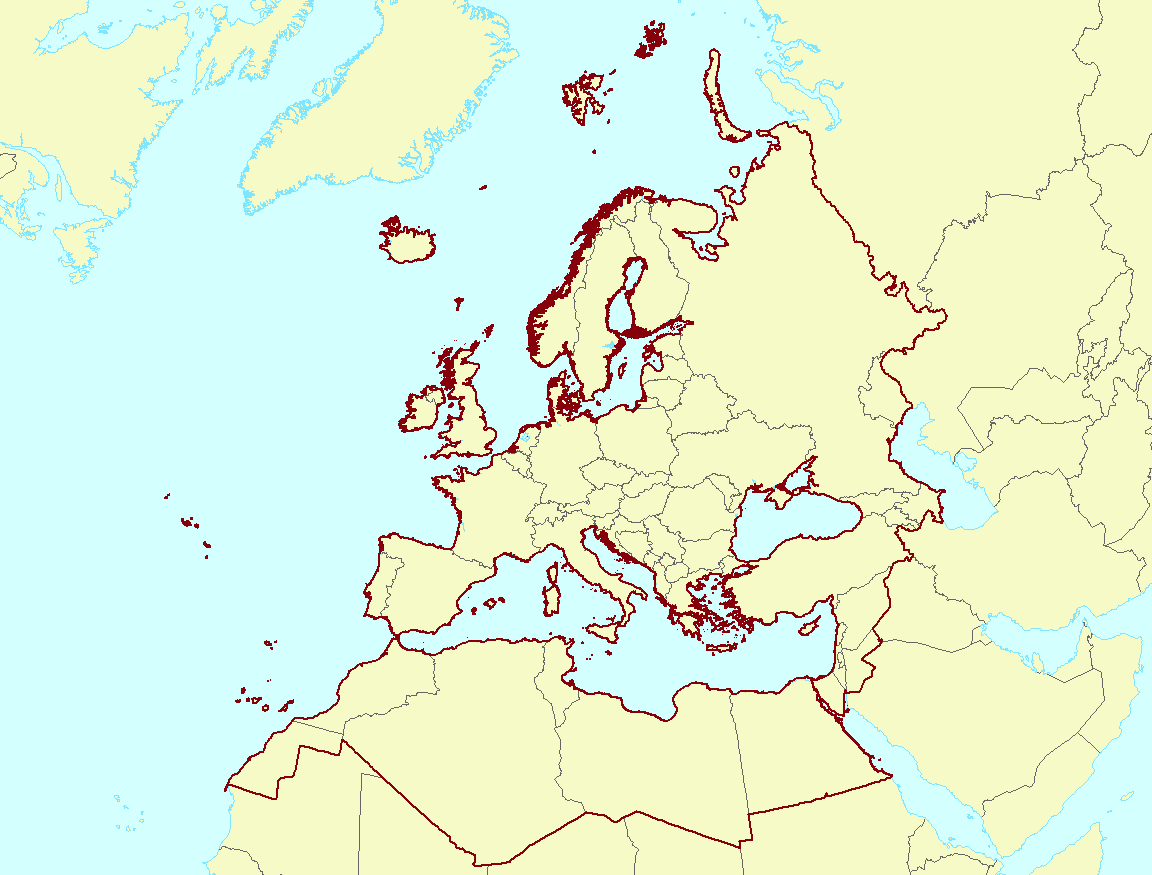
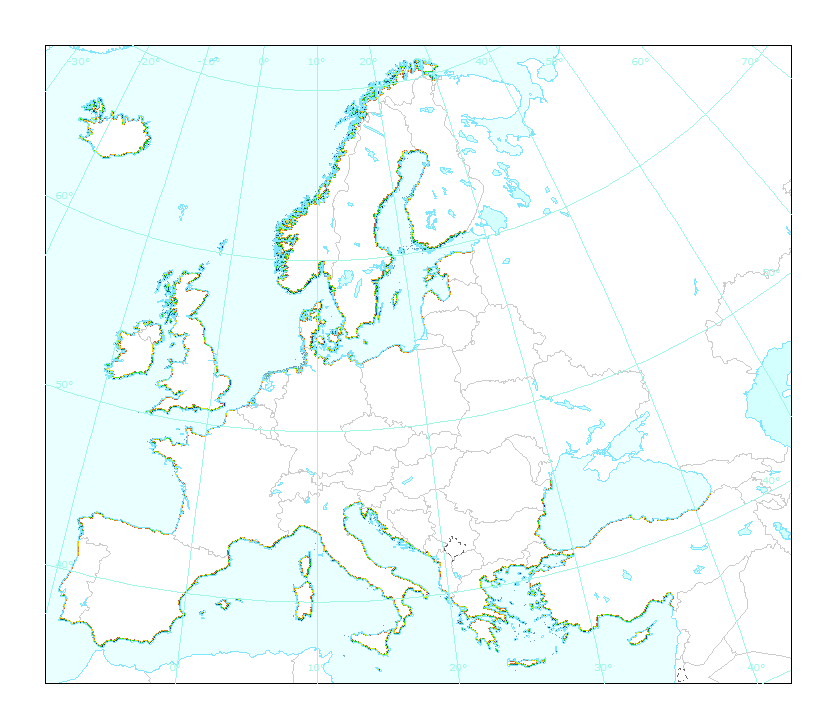
Complete Coastline Features for all the countries that produced Corine Land Cover 2000 and have a coastline, with detailed descriptions on the environment and type of coastal areas. Each coast segment has inherited CLC 2000 class, and also the attributes from Eurosion Coastline version 2.1 2004, regarding geomorphology, type of coast and erosion trends.
-
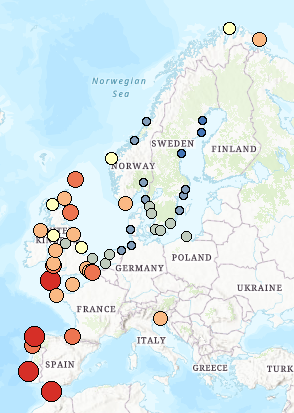
This dataset presents the estimated multiplication factor by which the frequency of flooding events of a given height in European tide gauges will change between 2010 and 2100, due to projected regional sea relative level rise under the Representative Concentration Pathways (RCP) 4.5 scenario. Values larger than 1 indicate an increase in flooding frequency. This dataset is derived from the Figure 13.25(b) of the Working Group I contribution to the IPCC Fifth Assessment Report (http://www.climatechange2013.org/images/report/WG1AR5_ALL_FINAL.pdf). This dataset also contributes to an earlier version of the EEA Indicator "Global and European sea-level": https://www.eea.europa.eu/data-and-maps/indicators/sea-level-rise-5/assessment.