 Catalogue PIGMA
100000
Type of resources
Available actions
Topics
Keywords
Contact for the resource
Provided by
Years
Formats
Representation types
Update frequencies
status
Scale
Resolution
-
Complete Coastline Features for all the countries that produced Corine Land Cover 2000 and have a coastline, with detailed descriptions on the environment and type of coastal areas. Each coast segment has inherited CLC 2000 class, and also the attributes from Eurosion Coastline version 2.1 2004, regarding geomorphology, type of coast and erosion trends.
-

The dataset shows the percentage of cities' administrative area (core city based on the Urban Morphological Zones dataset) inundated by the sea level rise of 1 metre, without any coastal flooding defences present for a series of individual coastal European cities (included in Urban Audit). The dataset has been computed using the CReSIS (Centre for Remote Sensing of Ice Sheets) dataset for 2018.
-

L’objectif général de ce projet de thèse est d’analyser et d’évaluer les données sources (actuelles et potentielles) des matrices de changements d’occupation du sol afin d’améliorer la robustesse de l’inventaire. Il s’agit d’expertiser par une démarche scientifique la pertinence des travaux réalisés annuellement pour l’inventaire UTCATF. En particulier, il s’agit de comprendre les causes des incertitudes des données sources ; compiler les données disponibles et leurs métadonnées ; étudier qualitativement les dynamiques paysagères décrites ; et redéfinir un cadre méthodologique permettant d’estimer des taux de changements plus pertinent.
-
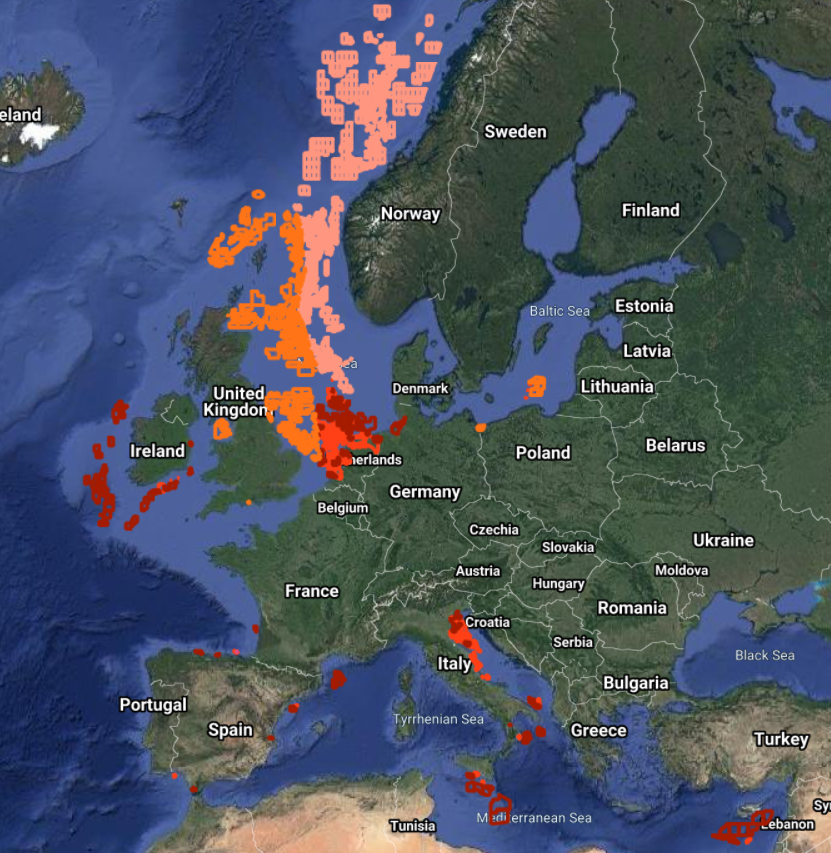
The dataset on offshore active licences for Oil and Gas exploitation and exploration in the EU was created in 2014 by Cogea for the European Marine Observation and Data Network (EMODnet). It is the result of the aggregation and harmonization of datasets provided by several EU and non-EU sources. It is updated every year, and is available for viewing and download on EMODnet - Human Activities web portal (www.emodnet-humanactivities.eu). It contains polygons representing active offshore licenced areas in the following countries: Croatia, Cyprus, Denmark, France, Germany, Ireland, Italy, Malta, Netherlands, Norway, Poland, Spain and United Kingdom. Where available each polygon has the following attributes: country, code, name, type (exploitation, exploration, exploitation and exploration, other, N/A), licensing round (it includes also pending applications in France and Spain), area (square km), area info (it indicates if the area value is original from the source or has been calculated), starting year, ending year, operator or administrator. Compared with the previous release, 'Exploitation, exploration' new type of licence has been added. Italy's exploration licences are all temporarily suspended.
-
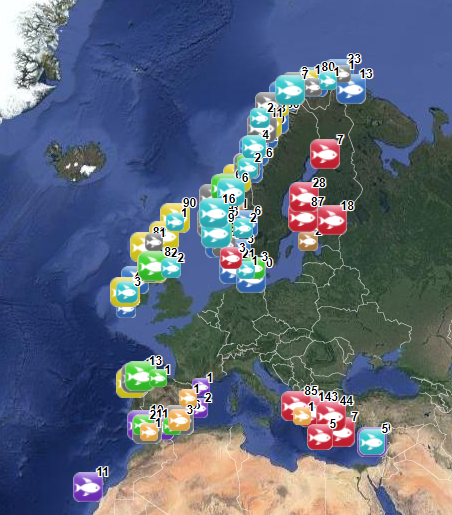
The database on marine finfish aquaculture in the EU was created in 2017 by AND-International for the European Marine Observation and Data Network (EMODnet). The dataset provides information about the location of marine finfish farms in the EU and partner countries where data are available. There is an obligation for EU MS to inventory all authorized aquaculture sites under the Council Directive 2006/88/EC on animal health requirements. Despite this obligation, the availability of data varies among MS from no data available at all to a complete regularly updated dataset (e.g.in Ireland). As far as partner countries are concerned, data have been collected only in Norway and the UK (Scotland only) at this stage, where detailed data are provided online. Data provided here cover Cyprus, Danmark, Finland, Greece, Ireland, Malta, Norway, Spain and the UK (Scotland only). Data collection is still undergoing in other EU MS and neighbouring countries. Each point has the following attributes (where available): Country, Owner name, Status (Active, Expired, Inactive, Renewal, n.a.), Farm type (Flatfish, Diversified farm, Other specialised farm, Salmon, Salmonids, Seabass-seabream, Trout,Tuna, n.a.), Production method (Sea cages, Saltwater tanks/raceways, Saltwater ponds, Saltwater closed (recirculation), Quarantine, Other, n.a.), Production stage (Grow out for human consumption, Hatchery, Nursery, Brood stock, Reproduction, Restoration of wild stock, Put and take fisheries, Processing facility, Salughtering facility, Other, n.a.), Purpose (Commercial, Restocking, Other, n.a.), Products detailed (detailed product information names as presented in the source and translated to English), Point information (Polygon centroid, Original) depending on how the information is provided in the source (polygons or points), Site_ID. The farm type relies on a typology established by AND-International, based on available information on species grown. A relational table provides harmonised information about species grown using Eurostat nomenclature for the Species Group (Cods, hakes, haddocks; Flounders, halibuts, soles; Miscellaneous coastal fishes, Miscellaneous demersal fishes; Miscellaneous pelagic fishes; Salmons, trouts, smelts;Tunas, bonitos, billfishes), the species name (commercial and scientific) and the code. Compared with the previous version this new version has been not only updated but was also reviewed (dataset schema and attributes values), in order to add information on production methods, production stages and purposes and to provide a more useful typology based on species grown.
-
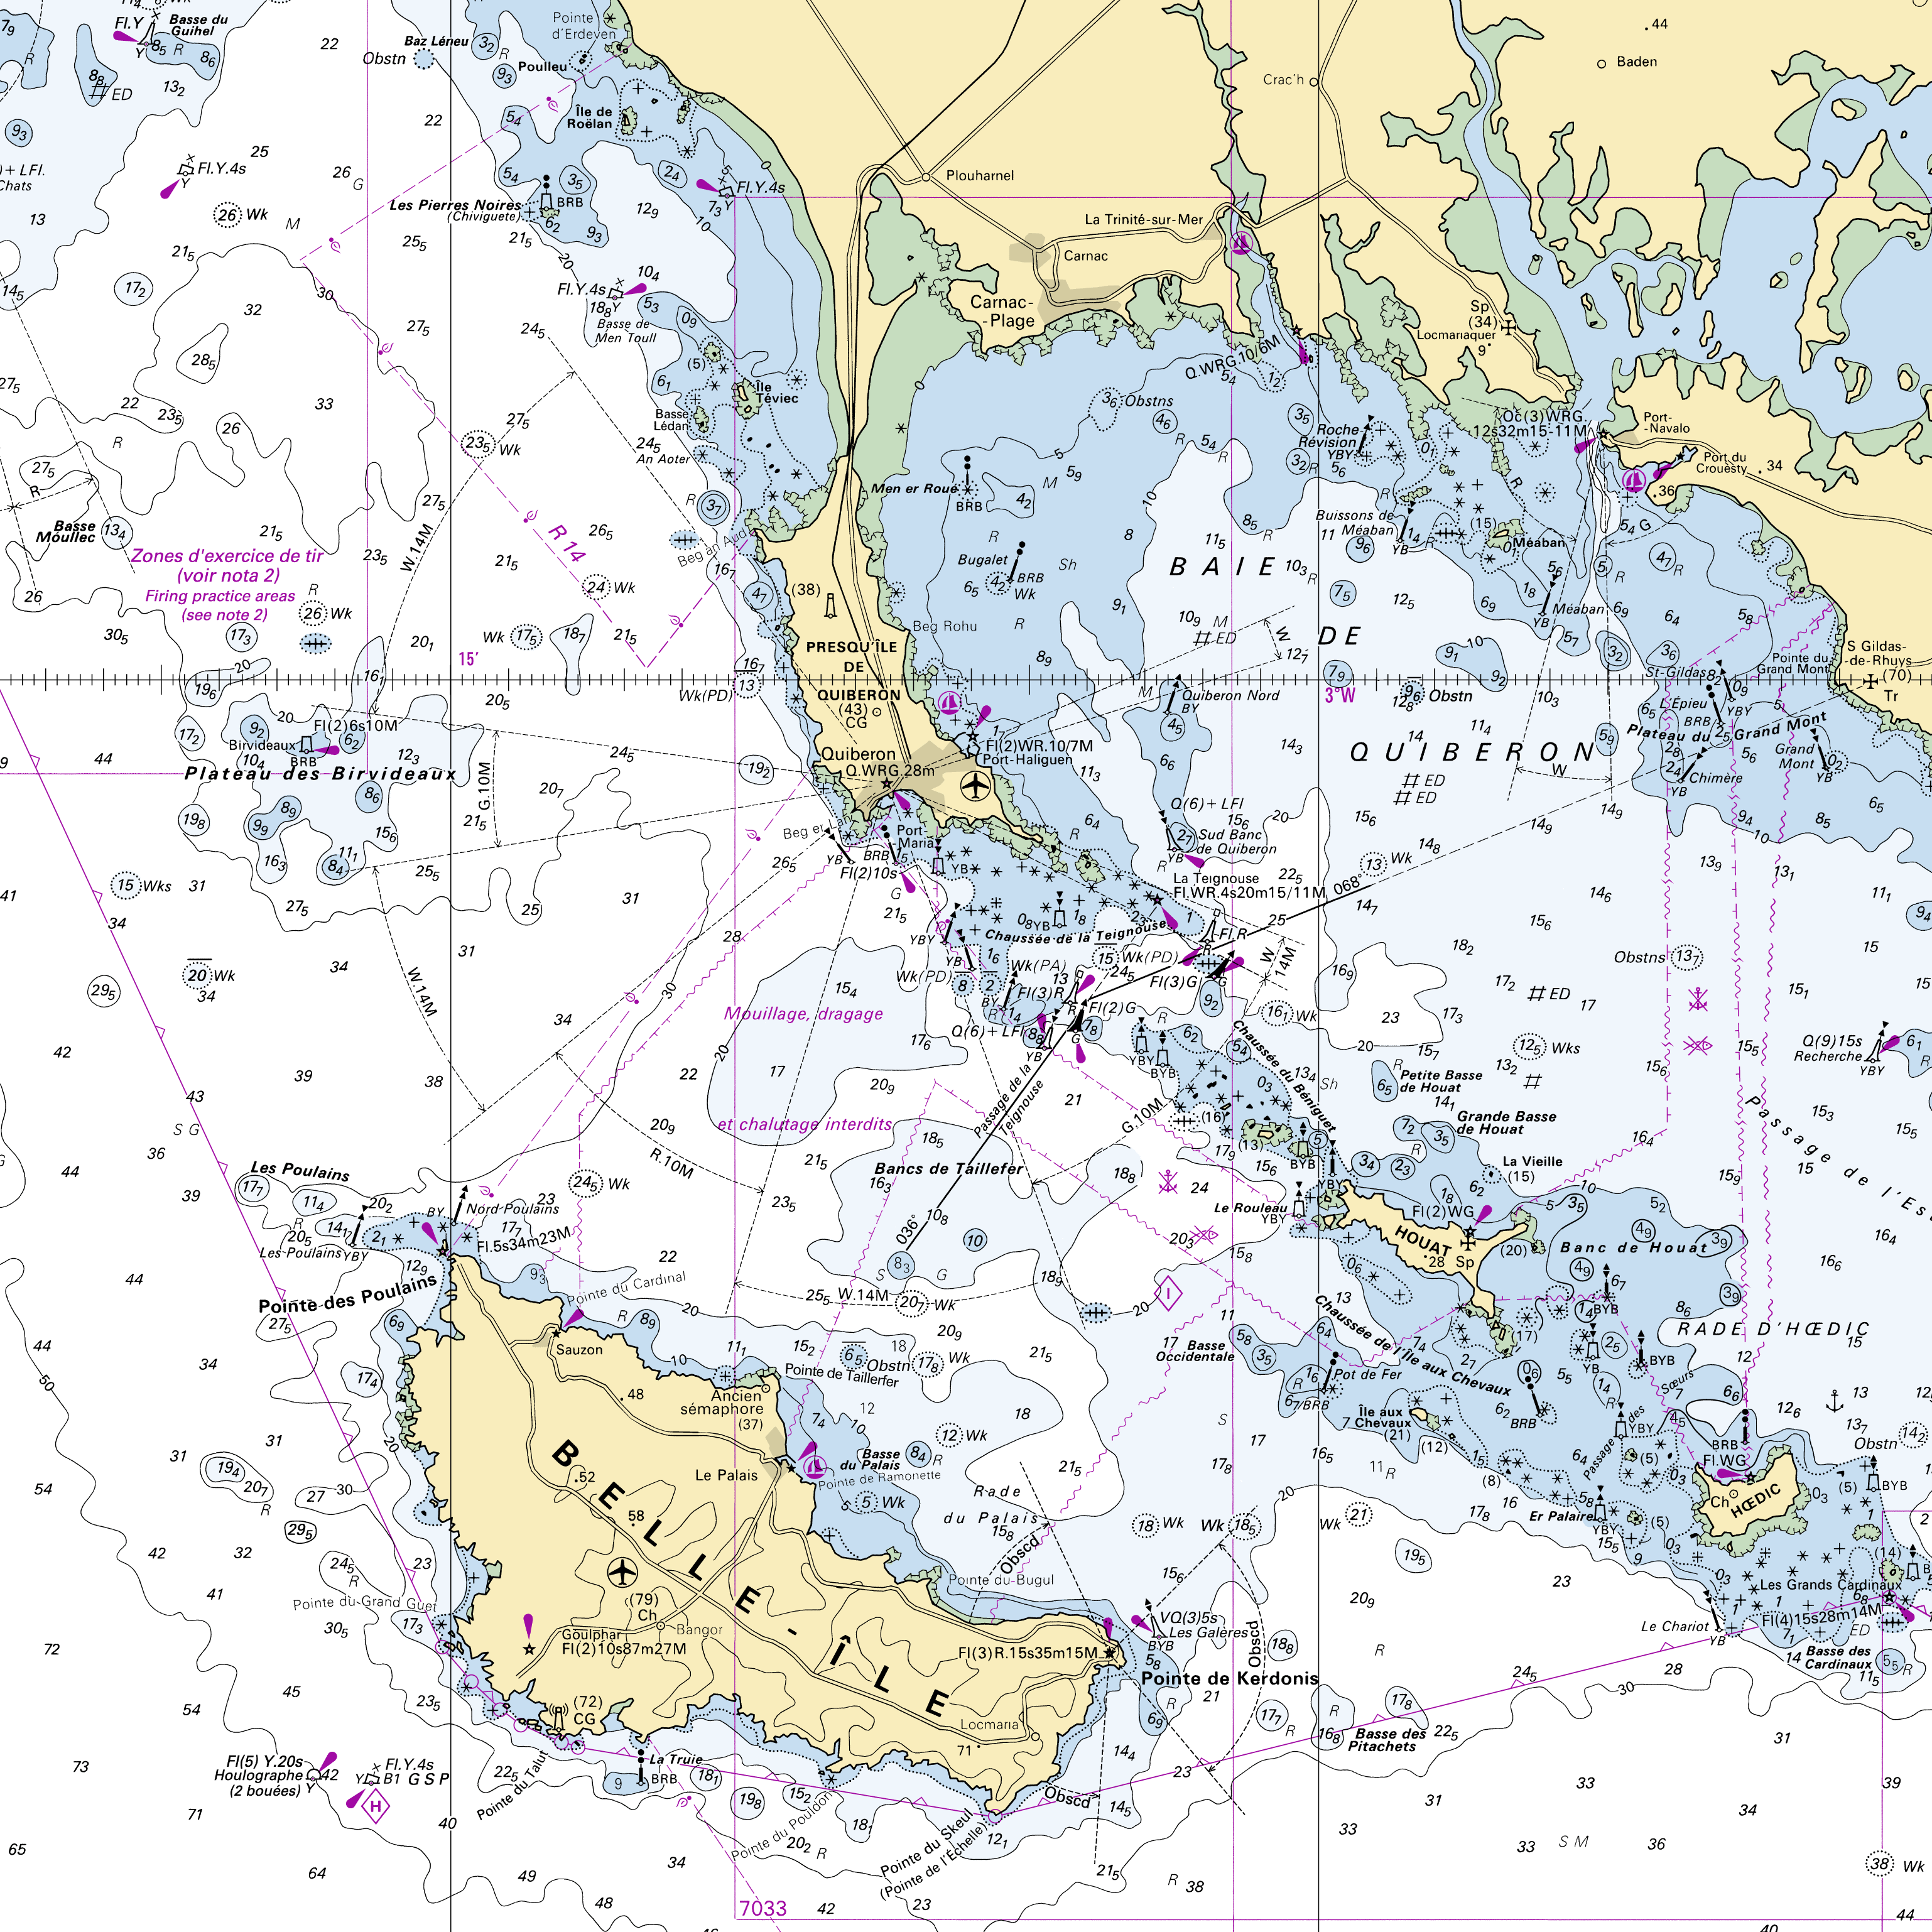
RasterMarine is a series of digital images taken from nautical charts, with no additions, legends or georeferencing information. The RasterMarine range is available at six sets of scales: - RasterMarine10 1:10,000 - RasterMarine25 1:25,000 - RasterMarine50 1:50,000 - RasterMarine100 1:100,000 - RasterMarine350 1:350,000 - RasterMarine1M 1:1,000,000. Unless exceptional circumstances apply, the RasterMarine range is updated on a weekly basis and the modified grid squares are re-published, replacing the previous versions. All corrections, publications, editions and suppressions with an effect on the reference nautical charts are taken into consideration. <br /> 09/07/2026 version <br />
-
.jpg)
The Sir Alister Hardy Foundation for Ocean Science (SAHFOS) is an international charity that operates the Continuous Plankton Recorder (CPR) Survey. The dataset covers the North Atlantic and the North Sea on since 1958.
-
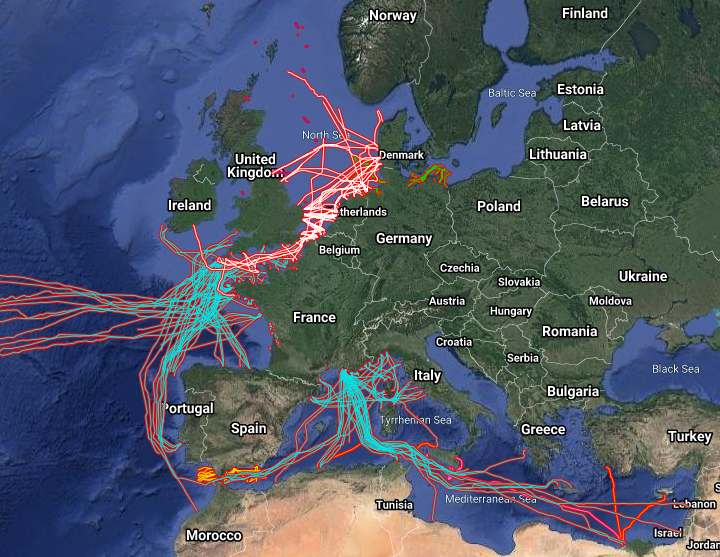
The datasets on subsea telecommunication and power cables (actual routes) in the EU was created in 2014 by Cogea for the European Marine Observation and Data Network (EMODnet). It is the result of the aggregation and harmonization of datasets provided by several sources. It is updated every year and is available for viewing and download on EMODnet Human Activities web portal (www.emodnet-humanactivities.eu). The datasets contain lines representing actual cable routes locations. Compared with the previous version, this version includes an update of the French telecommunication cables, the telecommunication cables that originate from or pass through Spanish (Andalucia) and Dutch waters, and the electric cables that originate from or pass through French, Dutch and Norwegian waters.
-
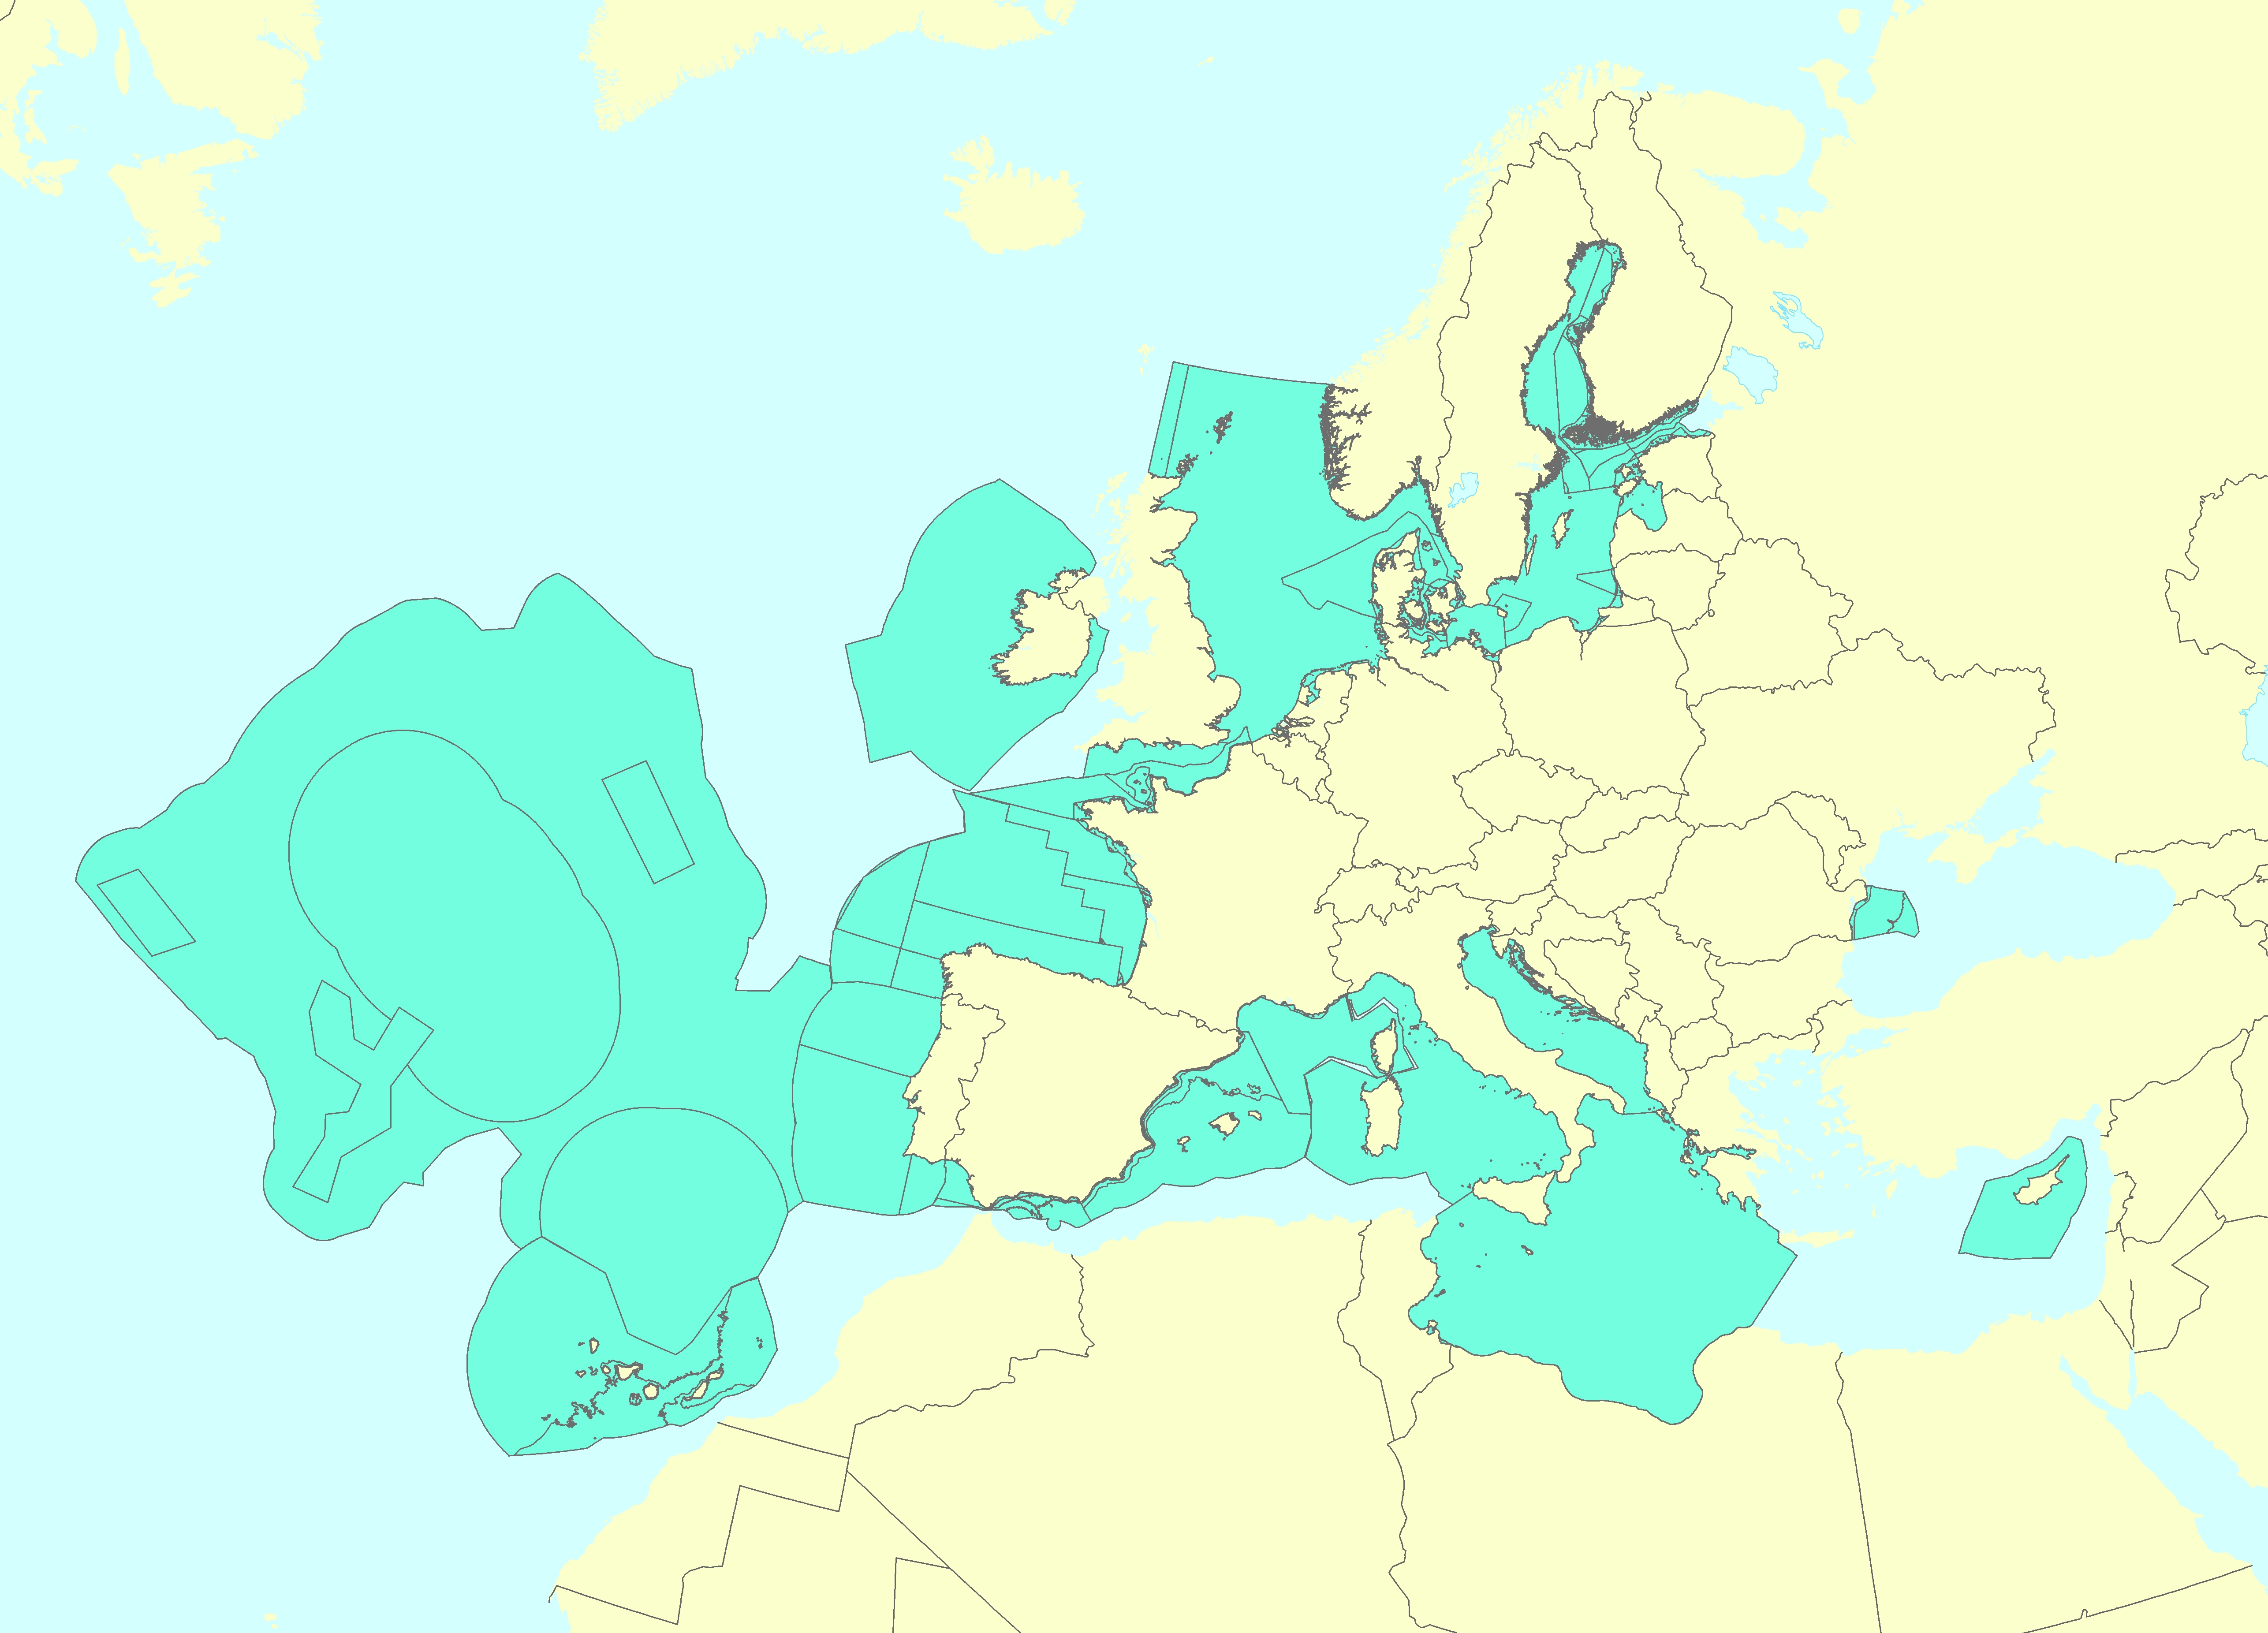
The Marine Reporting Units (MRUs) are used within the reporting obligations of the Marine Strategy Framework Directive (MSFD) in order to link the implementation of the different articles to specific marine areas. The MRUs can be of varying sizes, according to the appropriate scale for the different reports (e.g. region, sub-region, regional or sub-regional subdivision, Member State marine waters, WFD coastal waters, etc.), as indicated in the Good Environmental Status 2017 Decision. The present data set is the second public version released of the MRUs used during the MSFD 2018 reporting exercise on the update of Articles 8, 9 and 10. Only the MRUs of those countries that have gone through the reporting exercise by June 2020 have been included in this data set. Apart from the countries included already in version 1 of the dataset (SE, FI, EE, LV, PL, DE, DK, NL, BE, FR, ES, HR and RO), this version also includes seven more countries, namely MT, LT, IT, SI, CY, PT and IE. The data set is distributed in SHP and in INSPIRE-compliant GML format, made available also through an INSPIRE compliant ATOM service.
-

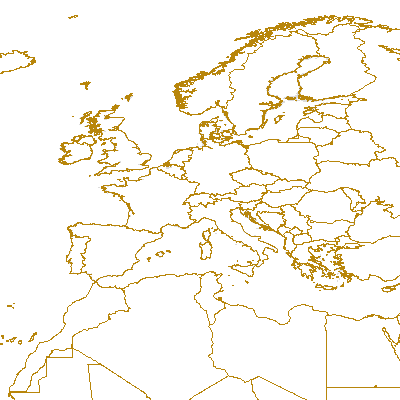
This dataset represents the regions for levels 1, 2 and 3 of the Nomenclature of Territorial Units for Statistics (NUTS) for 2016. The NUTS nomenclature is a hierarchical classification of statistical regions and subdivides the EU economic territory into regions of four different levels (NUTS , 1, 2 and 3, moving respectively from larger to smaller territorial units). NUTS 1 is the most aggregated level. An additional Country level (NUTS 0) is also available for countries where the the nation at statistical level does not coincide with the administrative boundaries. For example Mt Athos in Greece and Mellum and Minsener Ogg in Germany. The NUTS classification has been officially established through Regulation (EC) No 2016/2066 of the European Parliament and of the Council and its amendments. A non-official NUTS-like classification has been defined for the EFTA countries and candidate countries. An introduction to the NUTS classification is available here: http://ec.europa.eu/eurostat/web/nuts/overview. This dataset has been created mainly from the EuroBoundary Map v 12 (Eurogeographics) and geographic information from TurkStat for Turkey. The public dataset is available under the Download link indicated below. Available scales are 1M, 3M, 10M, 20M, 60M). The full dataset is available via the EC restricted download link under GISCO.NUTS_2016. Here six scale ranges (100K, 1M, 3M, 10M and 20M, 60M) are available. Coverage is the economic territory of the EU, EFTA countries and candidate countries as in 2013.