 Catalogue PIGMA
ESA
Type of resources
Available actions
Topics
Keywords
Contact for the resource
Provided by
Years
Formats
Representation types
status
Resolution
-
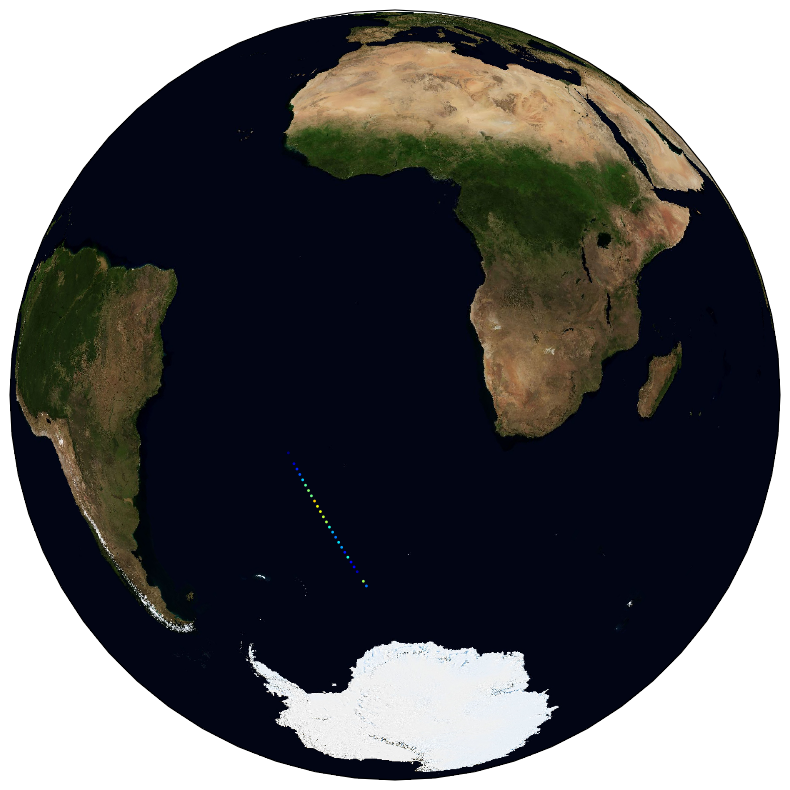
The ESA Sea State Climate Change Initiative (CCI) project has produced global multi-sensor time-series of along-track satellite synthetic aperture radar (SAR) integrated sea state parameters (ISSP) data from ENVISAT (referred to as SAR Wave Mode onboard ENVISAT Level 2P (L2P) ISSP data) with a particular focus for use in climate studies. This dataset contains the ENVISAT Remote Sensing Integrated Sea State Parameter product (version 1.1), which forms part of the ESA Sea State CCI version 3.0 release. This product provides along-track significant wave height (SWH) measurements at 5km resolution every 100km, processed using the Li et al., 2020 empirical model, separated per satellite and pass, including all measurements with flags and uncertainty estimates. These are expert products with rich content and no data loss. The SAR Wave Mode data used in the Sea State CCI SAR WV onboard ENVISAT Level 2P (L2P) ISSP v3 dataset come from the ENVISAT satellite mission spanning from 2002 to 2012.
-

In recent years, large datasets of in situ marine carbonate system parameters (partial pressure of CO2 (pCO2), total alkalinity, dissolved inorganic carbon and pH) have been collated. These carbonate system datasets have highly variable data density in both space and time, especially in the case of pCO2, which is routinely measured at high frequency using underway measuring systems. This variation in data density can create biases when the data are used, for example for algorithm assessment, favouring datasets or regions with high data density. A common way to overcome data density issues is to bin the data into cells of equal latitude and longitude extent. This leads to bins with spatial areas that are latitude and projection dependent (eg become smaller and more elongated as the poles are approached). Additionally, as bin boundaries are defined without reference to the spatial distribution of the data or to geographical features, data clusters may be divided sub-optimally (eg a bin covering a region with a strong gradient). To overcome these problems and to provide a tool for matching in situ data with satellite, model and climatological data, which often have very different spatiotemporal scales both from the in situ data and from each other, a methodology has been created to group in situ data into ‘regions of interest’, spatiotemporal cylinders consisting of circles on the Earth’s surface extending over a period of time. These regions of interest are optimally adjusted to contain as many in situ measurements as possible. All in situ measurements of the same parameter contained in a region of interest are collated, including estimated uncertainties and regional summary statistics. The same grouping is done for each of the other datasets, producing a dataset of matchups. About 35 million in situ datapoints were then matched with data from five satellite sources and five model and re-analysis datasets to produce a global matchup dataset of carbonate system data, consisting of 287,000 regions of interest spanning 54 years from 1957 to 2023. Each region of interest is 50 km in diameter and 5 days in duration, improving the spatial and temporal resolution of the previous version (v3.4). The list of sources added in this dataset includes: - sea surface temperature and sea ice concentration from Copernicus Climate Service Multi-satellite L4 (http://dx.doi.org/10.5285/62c0f97b1eac4e0197a674870afe1ee6) - sea surface salinity from the Copernicus Marine service Multi Observation Global Ocean Sea Surface Salinity and Sea Surface Density (https://doi.org/10.48670/moi-00051) - Surface ocean sea-air CO2 fluxes and total alkalinity from ETH Zurich OceanSODA-ETHZ-v2 gridded dataset (https://doi.org/10.5281/zenodo.11206366) - salinity and mixed layer depth from SODA v3.4.2 reanalysis (https://doi.org/10.1175/JCLI-D-18-0149.1) - chlorophyll-A from ESA Ocean Colour CCI v6 (doi:10.3390/s19194285) - wind at 10 m and mean sea level pressure from ERA5 reanalysis - nitrate, silicate, phosphate, oxygen, temperature and salinity from World Ocean Atlas 2018 - sea level anomaly from Global Ocean Gridded L4 Sea Surface Heights And Derived Variables Multi-Year dataset by Copernicus Marine Service Information (https://doi.org/10.48670/moi-00148) - sea surface salinity from ESA Salinity CCI L4 v3.2.1 (https://dx.doi.org/10.5285/5920a2c77e3c45339477acd31ce62c3c) - sea surface salinity from JPL SMAP Level 3 CAP Sea Surface Salinity (https://doi.org/10.5067/SMP40-3SPCS) - temperature and salinity from Coriolis Observation Re-Analysis CORA5.2 by Copernicus Marine Service (https://doi.org/10.17882/46219) - subskin sea surface temperature from NOAA OISST SST (http://doi.org/10.5067/GHAAO-4BC01) - sea surface salinity from the Arctic salinity dataset (https://doi.org/10.20350/digitalCSIC/9065) the Barcelona Expert Center (http://bec.icm.csic.es/) - pH and spCO2 from Copernicus Marine Service Surface Ocean Carbon Dataset (https://doi.org/10.48670/moi-00047) An example application, the reparameterisation of a global total alkalinity algorithm, is shown. This matchup dataset can be updated as and when in situ and other datasets are updated, and similar datasets at finer spatiotemporal scale can be constructed, for example to enable regional studies. This dataset was funded by ESA OceanHealth / Ocean Acidification project which aims at developing the use of satellite Earth Observation for studying and monitoring marine carbonate chemistry.
-
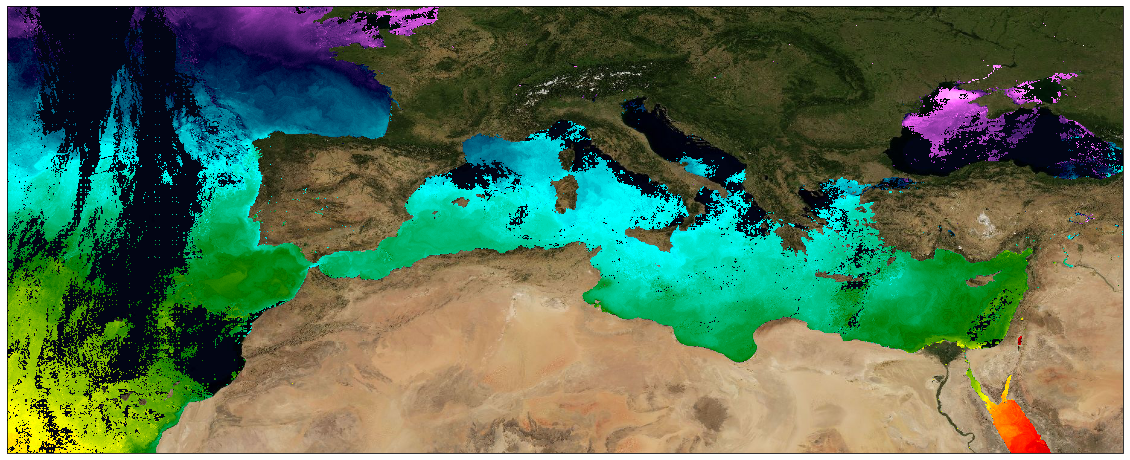
This dataset provide a times series of daily multi-sensor composite fields of Sea Surface Temperature (SST) foundation at ultra high resolution (UHR) on a 0.02 x 0.02 degree grid (approximately 2 x 2 km) over Mediterranean Sea, every 24 hours. Whereas along swath observation data essentially represent the skin or sub-skin SST, the L3S SST product is defined to represent the SST foundation (SSTfnd). SSTfnd is defined within GHRSST as the temperature at the base of the diurnal thermocline. It is so named because it represents the foundation temperature on which the diurnal thermocline develops during the day. SSTfnd changes only gradually along with the upper layer of the ocean, and by definition it is independent of skin SST fluctuations due to wind- and radiation-dependent diurnal stratification or skin layer response. It is therefore updated at intervals of 24 hrs. SSTfnd corresponds to the temperature of the upper mixed layer which is the part of the ocean represented by the top-most layer of grid cells in most numerical ocean models. It is never observed directly by satellites, but it comes closest to being detected by infrared and microwave radiometers during the night, when the previous day's diurnal stratification can be assumed to have decayed. The processing combines the observations of multiple polar orbiting and geostationary satellites, embedding infrared of microwave radiometers. All these sources are intercalibrated with each other before merging. A ranking procedure is used to select the best sensor observation for each grid point. The processing is the same (minus the optimal interpolation step) as for the Atlantic Near Real Time (NRT) L3S dataset available on Copernicus Marine Service [SST_ATL_PHY_L3S_NRT_010_037 dataset] and users can refer to the user manual and quality information documents available there for more details. This dataset is generated daily within a 24 delay and is therefore suitable for assimilation into operational models.
-
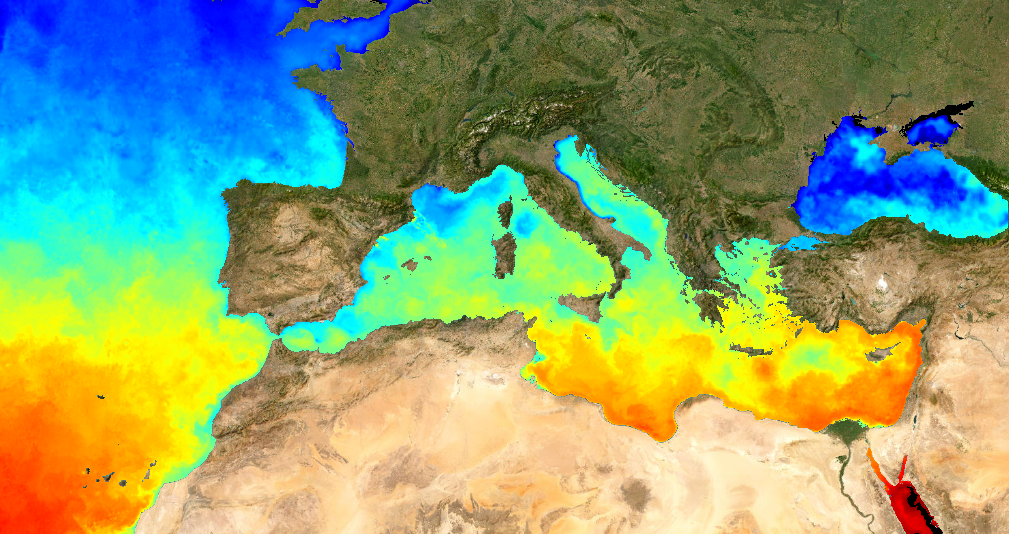
This dataset provide a times series of daily mean fields of Sea Surface Temperature (SST) foundation at ultra-high resolution (UHR) on a 0.02 x 0.02 degree grid (approximately 2 x 2 km) for the Mediterranean Sea, every 24 hours. An Optimal interpolation (OI) technique is used to combine coincident swath measures of SST from different types satellite sensors and to fill gaps where no observations are available or obstructed by clouds. This multi-sensor compositing and interpolation process categorizes this dataset as a Level 4 product. Whereas along swath observation data essentially represent the skin or sub-skin SST, the L4 SST product is defined to represent the SST foundation (SSTfnd). SSTfnd is defined within GHRSST-PP as the temperature at the base of the diurnal thermocline. It is so named because it represents the foundation temperature on which the diurnal thermocline develops during the day. SSTfnd changes only gradually along with the upper layer of the ocean, and by definition it is independent of skin SST fluctuations due to wind- and radiation-dependent diurnal stratification or skin layer response. It is therefore updated at intervals of 24 hrs. SSTfnd corresponds to the temperature of the upper mixed layer which is the part of the ocean represented by the top-most layer of grid cells in most numerical ocean models. It is never observed directly by satellites, but it comes closest to being detected by infrared and microwave radiometers during the night, when the previous day's diurnal stratification can be assumed to have decayed. The processing combines the observations of multiple polar orbiting and geostationary satellites, embedding infrared of microwave radiometers. All these sources are intercalibrated with eachother before merging. The processing is the same as for the Atlantic Near Real Time (NRT) L4 dataset available on Copernicus Marine Service [SST_ATL_SST_L4_NRT_OBSERVATIONS_010_025 dataset] and users can refer to the user manual and quality documents available there for more details. This dataset was developed in the frame of European Space Agency (ESA)'s Medspiration project.
-
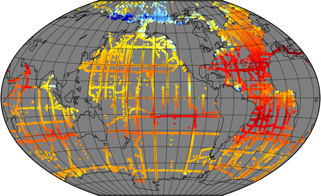
In recent years, large datasets of in situ marine carbonate system parameters (partial pressure of CO2 (pCO2), total alkalinity, dissolved inorganic carbon and pH) have been collated. These carbonate system datasets have highly variable data density in both space and time, especially in the case of pCO2, which is routinely measured at high frequency using underway measuring systems. This variation in data density can create biases when the data are used, for example for algorithm assessment, favouring datasets or regions with high data density. A common way to overcome data density issues is to bin the data into cells of equal latitude and longitude extent. This leads to bins with spatial areas that are latitude and projection dependent (eg become smaller and more elongated as the poles are approached). Additionally, as bin boundaries are defined without reference to the spatial distribution of the data or to geographical features, data clusters may be divided sub-optimally (eg a bin covering a region with a strong gradient). To overcome these problems and to provide a tool for matching in situ data with satellite, model and climatological data, which often have very different spatiotemporal scales both from the in situ data and from each other, a methodology has been created to group in situ data into ‘regions of interest’, spatiotemporal cylinders consisting of circles on the Earth’s surface extending over a period of time. These regions of interest are optimally adjusted to contain as many in situ measurements as possible. All in situ measurements of the same parameter contained in a region of interest are collated, including estimated uncertainties and regional summary statistics. The same grouping is done for each of the other datasets, producing a dataset of matchups. About 35 million in situ datapoints were then matched with data from five satellite sources and five model and re-analysis datasets to produce a global matchup dataset of carbonate system data, consisting of 287,000 regions of interest spanning 54 years from 1957 to 2020. Each region of interest is 100 km in diameter and 10 days in duration. An example application, the reparameterisation of a global total alkalinity algorithm, is shown. This matchup dataset can be updated as and when in situ and other datasets are updated, and similar datasets at finer spatiotemporal scale can be constructed, for example to enable regional studies. This dataset was funded by ESA Satellite Oceanographic Datasets for Acidification (OceanSODA) project which aims at developing the use of satellite Earth Observation for studying and monitoring marine carbonate chemistry. **This version is now superseded by the version 4 with higher spatial and temporal resolution**
-
Archive de toutes les données de température de surface (SST) satellite produites dans le cadre du projet international GHRSST. Ifremer est un GDAC pour ces données, miroir du GDAC NASA/JPL. Ces données sont utilisées pour la génération de produits multi-capteurs (CMEMS, Medspiration) mais également dans le cadre d'un grand nombre d'études ou projets nécessitant l'utilisation de mesures de SST. L'archive regroupe plusieurs jeux de données provenant de différents satellite ainsi que des données in situ de référence pour leur validation. Elle est mise à jour en temps quasi-réel depuis 10 ans, avec service de diffusion opérationnelle associé (FTP et HTTP). Une fiche sextant (issue du catalogue CERSAT) sera fournie pour chaque dataset dans cette archive.
-

Variations régionales du contenu en chaleur de l'océan Atlantique avec l'approche géodésique spatiale : "4DAtlantic-OHC" Le "Contenu en chaleur de l'océan" (ou OHC pour "Ocean Heat Content") est estimé à partir de la mesure de la dilatation thermique de l'océan basée sur les différences entre le contenu total du niveau de la mer dérivé des mesures altimétriques et le contenu massique dérivé des données gravimétriques, noté «altimétrie-gravimétrie». Sont disponibles : - les grilles mensuelles des variations de l'OHC (1°x1°) - les tendances de l'OHC et incertitudes. La stratégie établie à l'échelle globale (voir fiche de métadonnées associée "Contenu en Chaleur de l'Océan (OHC) et déséquilibre énergétique de la Terre (EEI)") a été étendue et développée à l'échelle régionale à la fois pour la génération de données et l'estimation des incertitudes. En particulier, les variations halostériques du niveau de la mer dues aux variations de la salinité qui ne sont pas négligeables régionalement sont prises en compte dans la chaîne de traitement. Elles sont estimées à partir des données in situ et sont ensuite retirées des variations stériques du niveau de la mer "altimétrie - gravimétrie". Les versions 1 et 2 du produit étaient seulement disponibles sur l'Océan Atlantique, alors que la version 3 est désormais disponible sur l'Océan global. À partir de l'équation du bilan du niveau de la mer, la variation thermostérique du niveau de la mer est calculée selon : ΔSLthermosteric = ΔSLtotal - ΔSLmass - ΔSLhalosteric Avec ΔSLtotal : à partir de données d'altimétrie spatiale provenant du Copernicus Climate Change Service. ΔSLmass : données de Gravimétrie spatiale de GRACE(-FO), mise à jour de Blazquez et al. 2018 ΔSLhalosteric : données in situ, à partir d'Argo, combinaison de ISAS20 (0-2000m) et EN4.2.2.l09 (en-dessous de 2000m) La variation de l'OHC est calculée à l'échelle régionale en divisant la variation thermostérique du niveau de la mer par le coefficient d'efficacité d'expansion intégrée de la chaleur (IEEH) : elle exprime la variation de la densité de l'océan due à l'absorption de chaleur et est estimée à partir des mesures in situ de la température et de la salinité. Les incertitudes sur les changements de l'OHC sont estimées par propagation des incertitudes à partir des données d'entrée jusqu'au changement de l'OHC.
-

La variation du **contenu thermique des océans** (Ocean Heat Content - OHC) peut être estimée directement à partir des flux thermiques nets à la surface de l’océan mesurés grâce aux données spatiales CERES, des données _in situ_ recueillies par les flotteurs ARGO ou des réanalyses issues de modèles océaniques. Nous estimons ici la variation de l’OHC à l’aide d’une approche innovante qui, pour la première fois, combine des données _in situ_, altimétriques et gravimétriques à l’aide d’une méthode inverse. L’intégration des données _in situ_ ARGO permet de contraindre la distribution verticale de la chaleur jusqu’à 1 000 m, résolvant ainsi les ambiguïtés de l’approche géodésique. En minimisant les résidus entre l’OHC _in situ_ et l’OHC géodésique et en appliquant des techniques de cartographie objectives, la méthode produit des champs d’OHC cohérents accompagnés d’estimations d’incertitude associées. Cette approche géodésique spatiale offre un échantillonnage spatial et temporel cohérent de l’océan. Elle couvre la quasi-totalité des océans mondiaux, à l’exception des régions polaires où la mer est entièrement recouverte de glace de mer (c’est-à-dire essentiellement au nord de 80° N), et fournit des estimations des variations de l’OHC sur toute la profondeur de l’océan. L'indicateur du **déséquilibre énergétique terrestre** (Earth energy imbalance - EEI) est dérivé des variations temporelles du contenu thermique des océans, c'est-à-dire en calculant sa dérivée temporelle (appelée **absorption de chaleur par les océans** (Global Ocean Heat Uptake - GOHU), voir figure). L'absorption de chaleur provenant des réservoirs terrestres, de la cryosphère et de l’atmosphère représentent environ 10 % de l’EEI et sont prises en compte. Les utilisateurs trouveront donc notamment: - les séries chronologiques relatives à l'évolution du contenu thermique océanique mondial - les séries chronologiques relatives à l'absorption thermique océanique mondiale - les séries chronologiques relatives au déséquilibre énergétique de la Terre (qui correspondent à l'absorption thermique océanique mondiale multipliée par un facteur de 0,91) - les incertitudes associées à ces jeux de données.