 Catalogue PIGMA
CDS-CERSAT
Type of resources
Available actions
Topics
Keywords
Contact for the resource
Provided by
Years
Formats
Representation types
Update frequencies
status
Scale
Resolution
-
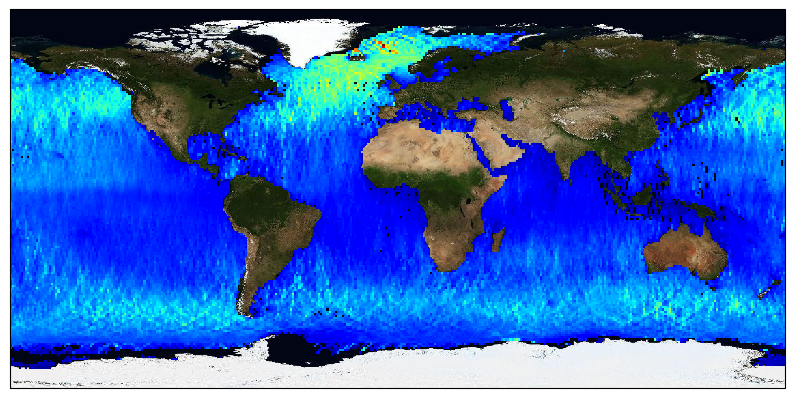
The ESA Sea State Climate Change Initiative (CCI) project has produced global multi-sensor time-series of along-track satellite altimeter significant wave height data (referred to as Level 4 (L4) data) with a particular focus for use in climate studies. This dataset contains the Version 3 Remote Sensing Significant Wave Height product, gridded over a global regular cylindrical projection (1°x1° resolution), averaging valid and good measurements from all available altimeters on a monthly basis (using the L2P products also available). These L4 products are meant for statistics and visualization. The altimeter data used in the Sea State CCI dataset v3 come from multiple satellite missions spanning from 2002 to 2021 ( Envisat, CryoSat-2, Jason-1, Jason-2, Jason-3, SARAL, Sentinel-3A), therefore spanning over a shorter time range than version 1.1. Unlike version 1.1, this version 3 involved a complete and consistent retracking of all the included altimeters. Many altimeters are bi-frequency (Ku-C or Ku-S) and only measurements in Ku band were used, for consistency reasons, being available on each altimeter but SARAL (Ka band).
-

This daily High-Resolution (HR) Level 3 gridded wind product is derived from Copernicus Sentinel-1 SAR (Synthetic Aperture Radar) observations, over the North Western Atlantic ("ATL" area). It is based on the European Space Agency (ESA) Level-2 OCN products at the highest available resolution. Although L2-OCN products already contain wind vectors, those are calculated using the CMOD5.n Geophysical Model Function (GMF) applied to the co-polarized (co-pol) VV channel (emitting in Vertical polarization and receiving in Vertical polarization). This VV GMF was mapped from scatterometer sensors (Hersbach et al., 2007) which are only able to use co-pol measurements. However, these co-pol GMF are known to lose sensitivity for wind above 20 m/s. Therefore, wind based on such GMF alone, are known to under-estimate wind speed (Polverari et al., 2022). For the L3 products winds based on SAR, we take advantage of the available cross-polarized (cross-pol) VH channel (emitting in Vertical polarization and receiving in Horizontal polarization) for which GMF were specifically derived based on C-Band SAR (Mouche et al., 2017, Mouche et al., 2019). Winds estimated from the combination of both the co-pol and cross-pol channels are referred to as dual-polarization (or dual-pol) winds. As shown in Mouche et al. (2019), taking advantage of the dual polarization strongly improves the wind estimation for high wind conditions thanks to the much greater VH channel sensitivity compared to VV. These new wind estimations are then gridded with a 0.012 degree resolution (between 0.5 and 1.2 km in zonal direction depending on the latitude and 1.3 km in meridional direction) using a cylindrical equidistant projection, independently for ascending and descending satellite passes and for each satellite (so 4 wind fields are available per day for two satellites). This dataset is generated over all Sentinel-1 mission time series starting from March 2018 and updated in delayed mode with a 4-months delay. It is also produced for 4 other different European areas. This dataset is produced and disseminated in the frame of Copernicus Marine Service.
-

This dataset contains the high-frequency total horizontal current at 15m depth on a global grid at 1/4° resolution. It is composed by the addition of two components, the first is the Geostrophic current derived by Altimetry, from the DT-2018 CMEMS database, and the second is the unsteady-Ekman ageostrophic component forced by the wind. All the details about the algorithm and the physical content of this ageostrophy component are given in the ATBD. The data are available through HTTP and FTP; access to the data is free and open. This dataset was generated by Datlas Ocean and is distributed by Ifremer / CERSAT in the frame of the World Ocean Circulation (WOC) project funded by the European Space Agency (ESA).
-

Level 3, four times a day, sub-skin Sea Surface Temperature derived from AVHRR on Metop satellites and VIIRS or AVHRR on NOAA and NPP satellites, over North Atlantic and European Seas and re-projected on a polar stereographic at 2 km resolution, in GHRSST compliant netCDF format. This catalogue entry presents Metop-A North Atlantic Regional Sea Surface Temperature. SST is retrieved from infrared channels using a multispectral algorithm and a cloud mask. Atmospheric profiles of water vapor and temperature from a numerical weather prediction model, Sea Surface Temperature from an analysis, together with a radiative transfer model, are used to correct the multispectral algorithm for regional and seasonal biases due to changing atmospheric conditions. The quality of the products is monitored regularly by daily comparison of the satellite estimates against buoy measurements. The product format is compliant with the GHRSST Data Specification (GDS) version 2.Users are advised to use data only with quality levels 3,4 and 5.
-
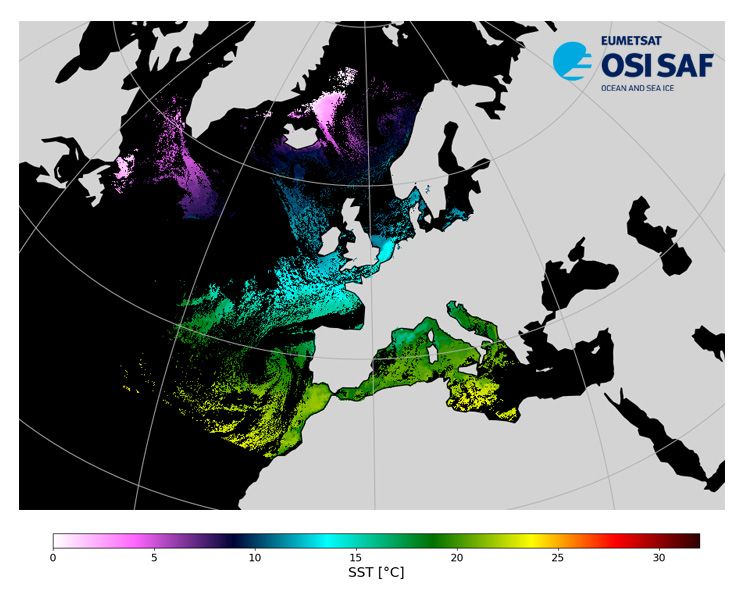
Level 3, four times a day, sub-skin Sea Surface Temperature derived from AVHRR on Metop satellites and VIIRS or AVHRR on NOAA and NPP satellites, over North Atlantic and European Seas and re-projected on a polar stereographic at 2 km resolution, in GHRSST compliant netCDF format. This catalogue entry presents NOAA-19 North Atlantic Regional Sea Surface Temperature. SST is retrieved from infrared channels using a multispectral algorithm and a cloud mask. Atmospheric profiles of water vapor and temperature from a numerical weather prediction model, Sea Surface Temperature from an analysis, together with a radiative transfer model, are used to correct the multispectral algorithm for regional and seasonal biases due to changing atmospheric conditions. The quality of the products is monitored regularly by daily comparison of the satellite estimates against buoy measurements. The product format is compliant with the GHRSST Data Specification (GDS) version 2.Users are advised to use data only with quality levels 3,4 and 5.
-

Level 3, four times a day, sub-skin Sea Surface Temperature derived from AVHRR on Metop satellites and VIIRS or AVHRR on NOAA and NPP satellites, over North Atlantic and European Seas and re-projected on a polar stereographic at 2 km resolution, in GHRSST compliant netCDF format. This catalogue entry presents Metop-B North Atlantic Regional Sea Surface Temperature. SST is retrieved from infrared channels using a multispectral algorithm and a cloud mask. Atmospheric profiles of water vapor and temperature from a numerical weather prediction model, Sea Surface Temperature from an analysis, together with a radiative transfer model, are used to correct the multispectral algorithm for regional and seasonal biases due to changing atmospheric conditions. The quality of the products is monitored regularly by daily comparison of the satellite estimates against buoy measurements. The product format is compliant with the GHRSST Data Specification (GDS) version 2.Users are advised to use data only with quality levels 3,4 and 5.
-

This daily High-Resolution (HR) Level 3 gridded wind product is derived from Copernicus Sentinel-1 SAR (Synthetic Aperture Radar) observations, over the Mediterranean Sea ("MED" area). It is based on the European Space Agency (ESA) Level-2 OCN products at the highest available resolution. Although L2-OCN products already contain wind vectors, those are calculated using the CMOD5.n Geophysical Model Function (GMF) applied to the co-polarized (co-pol) VV channel (emitting in Vertical polarization and receiving in Vertical polarization). This VV GMF was mapped from scatterometer sensors (Hersbach et al., 2007) which are only able to use co-pol measurements. However, these co-pol GMF are known to lose sensitivity for wind above 20 m/s. Therefore, wind based on such GMF alone, are known to under-estimate wind speed (Polverari et al., 2022). For the L3 products winds based on SAR, we take advantage of the available cross-polarized (cross-pol) VH channel (emitting in Vertical polarization and receiving in Horizontal polarization) for which GMF were specifically derived based on C-Band SAR (Mouche et al., 2017, Mouche et al., 2019). Winds estimated from the combination of both the co-pol and cross-pol channels are referred to as dual-polarization (or dual-pol) winds. As shown in Mouche et al. (2019), taking advantage of the dual polarization strongly improves the wind estimation for high wind conditions thanks to the much greater VH channel sensitivity compared to VV. These new wind estimations are then gridded with a 0.012 degree resolution (between 0.5 and 1.2 km in zonal direction depending on the latitude and 1.3 km in meridional direction) using a cylindrical equidistant projection, independently for ascending and descending satellite passes and for each satellite (so 4 wind fields are available per day for two satellites). This dataset is generated over all Sentinel-1 mission time series starting from March 2018 and updated in delayed mode with a 4-months delay. It is also produced for 4 other different European areas. This dataset is produced and disseminated in the frame of Copernicus Marine Service.
-
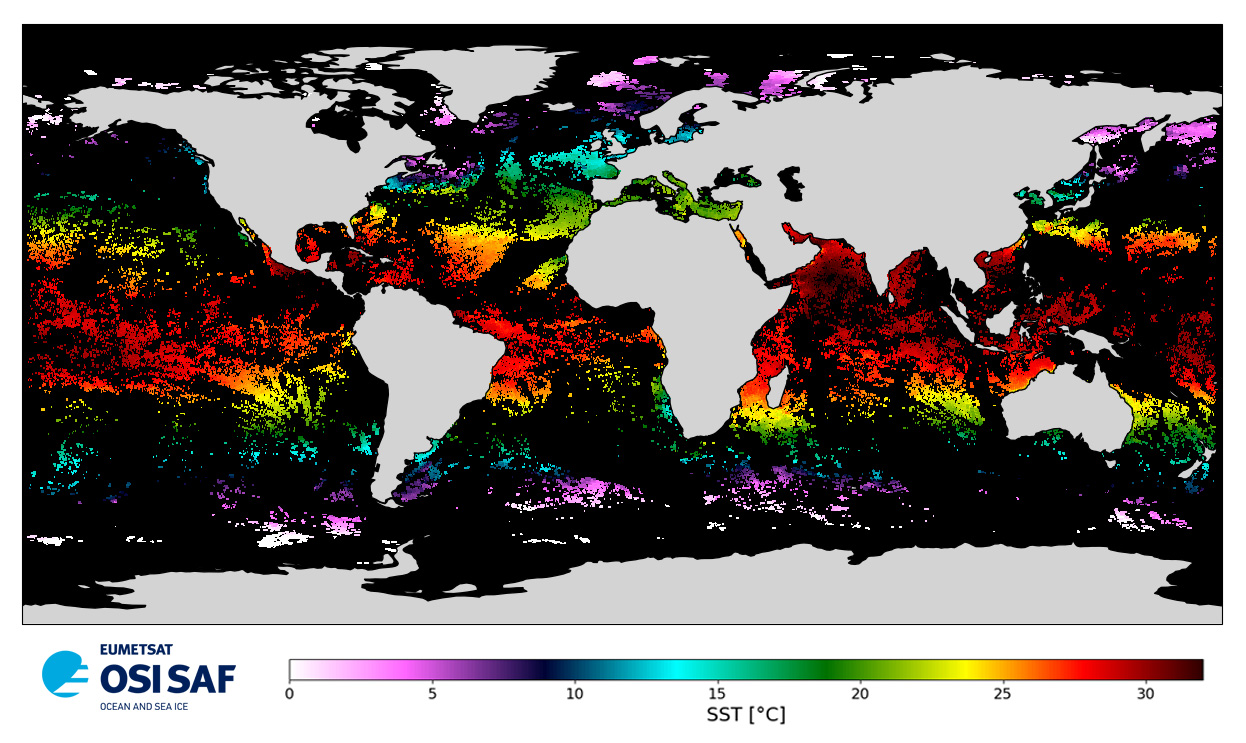
Level 2 skin Sea Surface Temperature derived from IASI on Metop-B, global and provided in full-resolution swath (12 km at nadir to 40 km), in GHRSST compliant netCDF format. SST is retrieved using a multispectral algorithm and a cloud mask. Atmospheric profiles of water vapor and temperature from a numerical weather prediction model, Sea Surface Temperature from an analysis, together with a radiative transfer model, are used to correct the multispectral algorithm for regional and seasonal biases due to changing atmospheric conditions. The quality of the products is monitored regularly by daily comparison of the satellite estimates against buoy measurements. The product format is compliant with the GHRSST Data Specification (GDS) version 2. Users are advised to use data only with quality levels 3, 4 and 5.
-
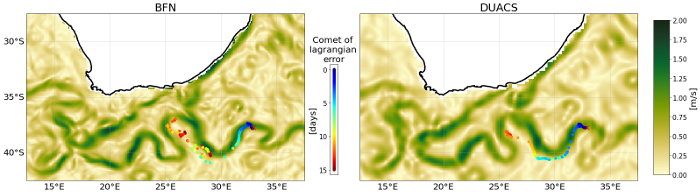
This dataset provides Level 4 total current including geostrophy and a data-driven approach for Ekman and near-inertial current, based on a convolution between drifter observation and wind history, to fit empirically a complex and time-lag dependant transfert function between ERA5 wind stress and current The data are available through HTTP and FTP; access to the data is free and open. In order to be informed about changes and to help us keep track of data usage, we encourage users to register at: https://forms.ifremer.fr/lops-siam/access-to-esa-world-ocean-circulation-project-data/ This dataset was generated by Datlas and is distributed by Ifremer / CERSAT in the frame of the World Ocean Circulation (WOC) project funded by the European Space Agency (ESA).
-
Satellite altimeters routinely supply sea surface height (SSH) measurements which are key observations to monitor ocean dynamics. However, below a wavelength of about 70 km, along-track altimeter measurements are often characterized by a dramatic drop in the signal-to-noise ratio, making it very challenging to fully exploit available altimeter observations to precisely analyze small mesoscale variations in SSH. Although various approaches have been proposed and applied to identify and filter noise from measurements, no distinctive methodology emerged to be systematically applied in operational products. To best cope with this unresolved issue, the Copernicus Marine Environment Monitoring Service (CMEMS) actually provides simple band-pass filtered data to mitigate noise contamination in the along-track SSH signals and more innovative and adapted noise filtering methods are thus left to users seeking to unveil small-scale altimeter signals. Here demonstrated, a fully data-driven approach is developed and applied to provide robust estimates of noise-free Sea Level Anomaly (SLA) signals. The method combines Empirical Mode Decomposition (EMD), to help analyze non-stationary and non-linear processes, and an adaptive noise filtering technique inspired by Discrete Wavelet Transform (DWT) decompositions. It is now found to best resolve the distribution of the sea surface height variability in the mesoscale 30-120 km wavelength band. A practical uncertainty variable is attached to the denoised SLA estimates that accounts for errors related to the local signal to noise ratio, but also for uncertainties in the denoising process, which assumes that SLA variability results in part from a stochastic process. Here, measurements from the Jason-3, Sentinel-3 A and SARAL/AltiKa altimeters are processed and analyzed, and their energy spectral and seasonal distributions characterized in the small mesoscale domain. Anticipating data from the upcoming Surface Water and Ocean Topography (SWOT) mission, these denoised SLA measurements for three reference altimeter missions already yield valuable opportunities to assess global small mesoscale kinetic energy distributions. This dataset was developed within the Ocean Surface Topography Science Team (OSTST) activities. A grant was awarded to the SASSA (Satellite Altimeter Short-scale Signals Analysis) project by the TOSCA board in the framework of the CNES/EUMETSAT call CNES-DSP/OT 12-2118. Altimeter data were provided by the Copernicus Marine Environment Monitoring Service (CMEMS) and by the Sea State Climate Change Initiative (CCI) project.