 Catalogue PIGMA
/Etat du Milieu/Bathymétrie
Type of resources
Available actions
Topics
Keywords
Contact for the resource
Provided by
Years
Formats
Representation types
Update frequencies
status
Scale
Resolution
-
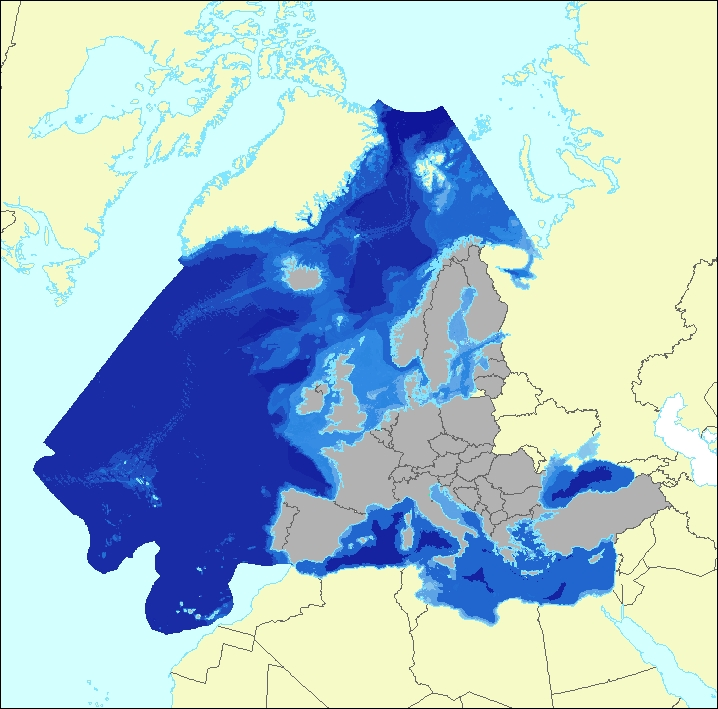
The data set aims to contribute to a better biological characterization of European marine ecosystems. As such it represents probabilities of EUNIS (EUropean Nature Information System) habitat presence at Level 3 for marine habitats including information on sea ice coverage (this corresponds to EUNIS level 2 for terrestrial habitats). The map combines spatially explicit data on marine bathymetry and sea-bed with non-spatially referenced habitat information of the EUNIS classification. The objective of the data set produced by EEA and its Topic Centre ETC/ULS is to improve the biological description of marine based ecosystem types and their spatial distribution. The work supports Target 2 Action 5 of the implementation of the EU Biodiversity Strategy to 2020, established to achieve the Aichi targets of the Convention of Biological Diversity (CBD). It further addresses the MAES process (Mapping and Assessing of Ecosystems and their Services). The data set represents 2 classes of the MAES classification level 3, namely “Marine inlets and transitional waters” and “Marine”. The dataset comprises the following information: • Sea region (1 – Arctic, 2 – Atlantic, 3 – Baltic, 4 – Mediterranean, 5 – Black Sea) • Sea zone (1 – Littoral, 2 – Infralittoral, 3 – Circalittoral, 4 – Offshore circalittoral, 5 – Upper bathyal, 6 – Lower bathyal, 7 – Abyssal,8 - Coastal Lagoons, 9 - Coastal Lagoons) • Substrate (0 – undetermined substrate, 1 – rock and biogenic, 3 – coarse sediment, 4 – mixed sediment, 5 – sand, 6 – mud) • Sea ice coverage (0 – no sea ice presence, 1 – seasonal sea ice presence, 2 – perennial sea ice presence)
-
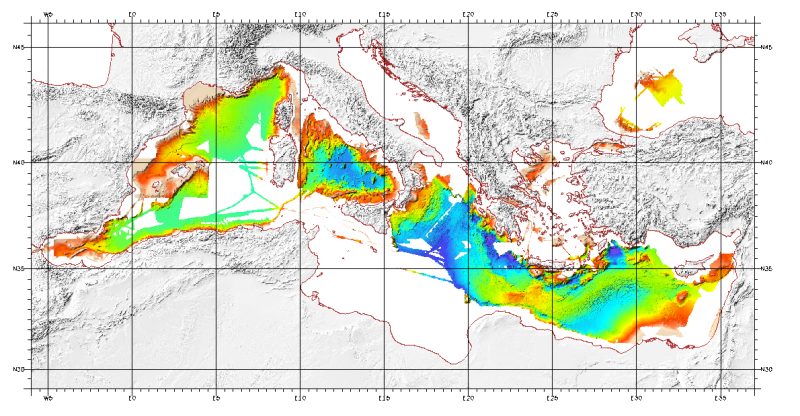
Pour ce produit consulter les données plus récentes du projet EMODnet Bathymetry : https://emodnet.ec.europa.eu/en/bathymetry. Modèle bathymétrique (Modèle Numérique de Terrain) de la Méditerranée. Groupe Medimap. Données de bathymétrie acquises par les sondeurs multifaisceaux au cours des campagnes Almofront.leg1 et Almofront.leg2, Almofront, Bretane, Seamewe2, Heralis, Medee, Anaxiprobe, Almofront2 - leg1 et leg2, Prismed2, Marmara, Fanil, Tvic5 et 6, Progres, Maradja, Blac, Nautinil, Medor-Simed1 / 2 / 3 / 4 / 5, Maradja2, Sardinia, Prisme, Assemblage et Thertou. Intégration des MNT des organismes partenaires. Ce MNT est disponible aux résolutions de 500 mètres et 1 000 mètres. Partenaires MediMap : - SHOM (service Hydrographique et Océanographique de la Marine) ; - CNRS/INSU (Centre National de la recherche Scientifique / Institut National des Sciences de l'Univers) ; - Géosciences Azur / Observatoire Océanologique de Villefranche sur Mer ; - ENS Paris (Ecole Nationale Supérieure de Paris) ; - UBO/IUEM (Université de Bretagne Occidentale / Institut Universitaire Européen de la Mer) - UP (Université de Perpignan / Laboratoire d'Etudes des Géo-environnements Marins) ; - UB/GRC-GM (Universitat de Barcelona / Geociències Marines) ; - IEO (Instituto Espanol de Oceanografia) ; - IHM (Instituto Hidrografico de la Marina) ; - Instituto Andaluz de Ciencias de la Tierra / Unitat de Tecnologia Marina, CMIMA / Universidad de Granada ; - ISMAR (Istituto di Scienze Marine) ; - Istituto Nazionale di Oceanografia e di Geofisica Sperimentale OGS/RIMA ; - Università di Trieste / Università della Calabria - Scienze della Terra ; - HCMR (Hellenic Centre for Marine Research) ; - NWO (Nederlandse organisatie voor Wetenschappelijk Onderzoek / Vrije Universiteit Amsterdam ; - Israel's national Bathymetric Survey.
-
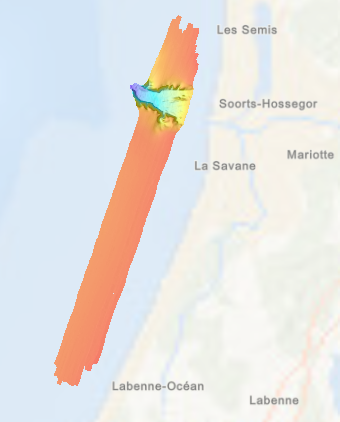
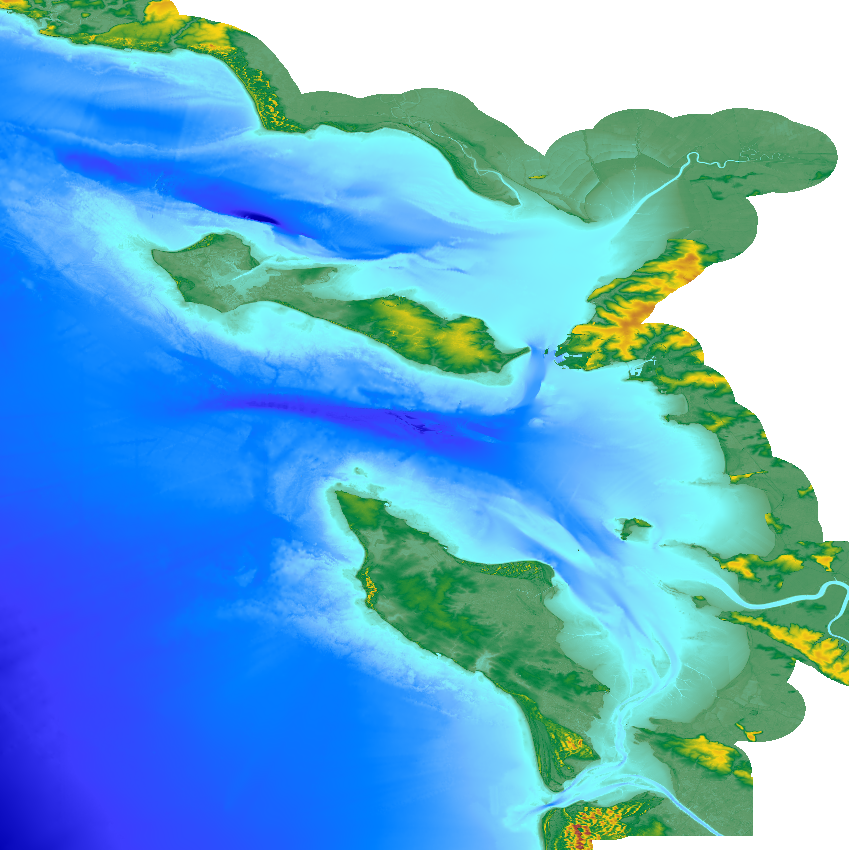
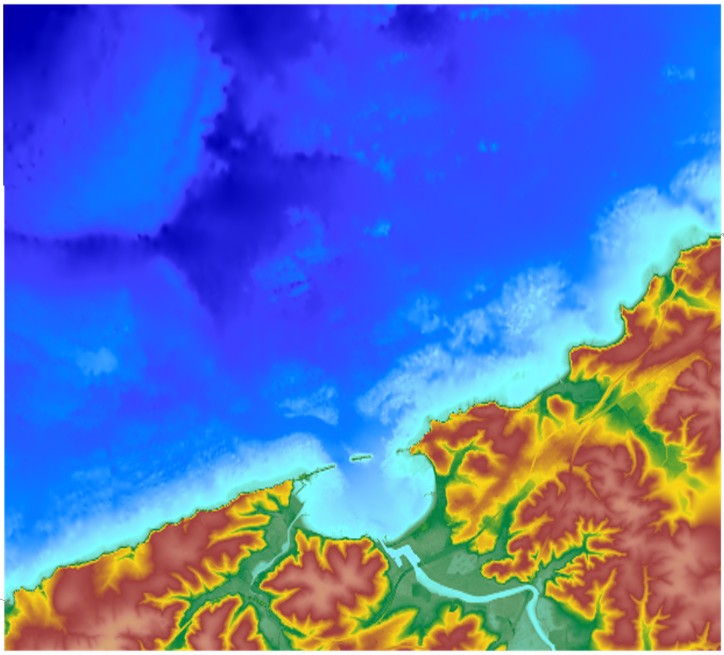
Bathymétrie de l'entrée du canyon de Capbreton dans le golfe de Gascogne (campagne ITSAS V, 2001). Les données ont été acquises par le sondeur multifaisceau EM1000 de la Thalia. Le pas de la grille est de 10 mètres (Mercator 46°N). Référence verticale : niveau observé des mers. Description de la campagne : CIRAC Pierre (2001) ITSAS V cruise, RV Thalia, https://doi.org/10.17600/1070060
-
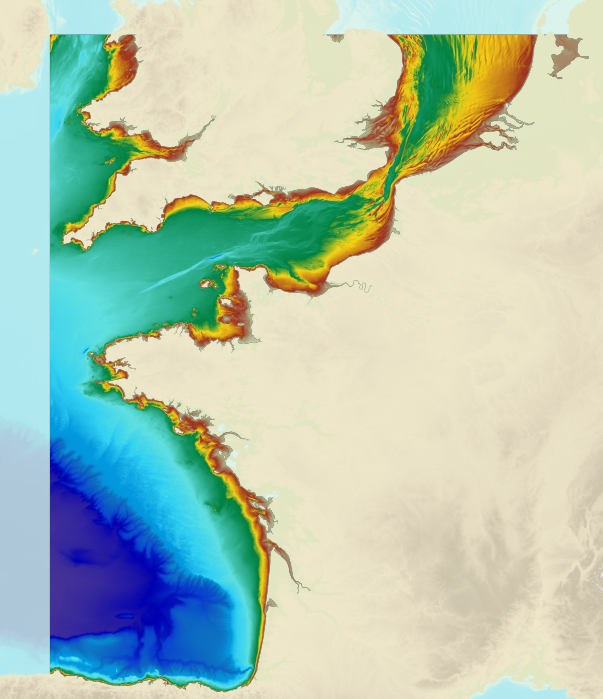
The bathymetric DEM of the atlantic facade with a resolution of 0.001° (~ 100 m) was prepared as part of the HOMONIM project. It encompasses part of the North Sea, the Channel and the Bay of Biscay. Offshore, this DTM extends beyond the slope to approximately 4800 m depth. The DEM is designed to be used in hydrodynamic models in order to produce high-precision forecasts for coastal water levels and sea conditions and therefore improve the pertinence of the Waves-Submersion monitoring programme. This product is available with the Lowest Astronomic Tide (LAT) or the Mean Sea Level (MSL) as a vertical datum.
-
The update of the coastal topo-bathymetric DEM of the Pertuis charentais at a resolution of 0.0002° (~ 20 m) was carried out in the third phase of the HOMONIM project. The DEM extends from the terrestrial domain to about 60 meters depth over all the pertuis (pertuis Breton, pertuis d’Antioche and pertuis of Maumusson). The DEM is intended to be implemented in hydrodynamic models in order to produce forecasts as accurate as possible of water heights and sea states at the coast to improve the relevance of the Wave-Submergence Vigilance. This product is available with either the Lowest Astronomic Tide (LAT) or the Mean Sea Level (MSL) as a vertical reference.
-
Bathymétrique du canyon de Capbreton (synthèse, édition 2007), au pas de 40 mètres. Acquisition des données par le sondeur multifaisceau EM1000, du N/O Thalia. Référence verticale : niveau observé des mers Référence bibliographique : Bourillet Jean-Francois, Augris Claude, Cirac Pierre, Maze Jean-Pierre, Normand Alain, Loubrieu Benoit, Crusson Alban, Gaudin Mathieu, Poirier Dominique, Satra Le Bris Catherine, Simplet Laure (2007). Le canyon de Capbreton - Carte morpho-bathymétrique - Échelle 1/50 000. Campagnes océanographiques : - AUGRIS Claude (1993) PLABAS cruise, RV Thalia, https://doi.org/10.17600/93000660 - AUGRIS Claude (1994) PLABAS 94/2 cruise, RV Thalia, https://doi.org/10.17600/94070180 - LERICOLAIS Gilles, AUGRIS Claude (1995) PLACETA / PLABAS 3 cruise, RV Thalia, https://doi.org/10.17600/95070070 - CIRAC Pierre (1998) ITSAS cruise, RV Le Suroît, https://doi.org/10.17600/98020070 - CIRAC Pierre (2001) ITSAS II cruise, RV Le Suroît, https://doi.org/10.17600/1020050 - CIRAC Pierre (2001) ITSAS V cruise, RV Thalia, https://doi.org/10.17600/1070060 - CIRAC Pierre (2002) ITSAS VI cruise, RV Thalia, https://doi.org/10.17600/2070100 - CIRAC Pierre (2004) PROSECAN 2 cruise, RV Thalia, https://doi.org/10.17600/4070150
-
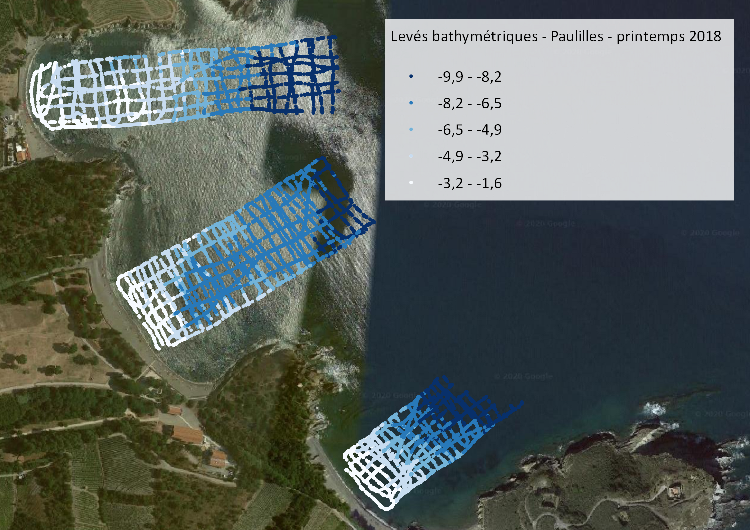
Bathymétrie de la plage de Paulilles à 5 cm de résolution. Effectuée à partie de données acquises au sondeur mono-faisceau lors de la campagne SENVISAT – Paulilles (Port-Vendres, département des Pyrénées-Orientales).
-
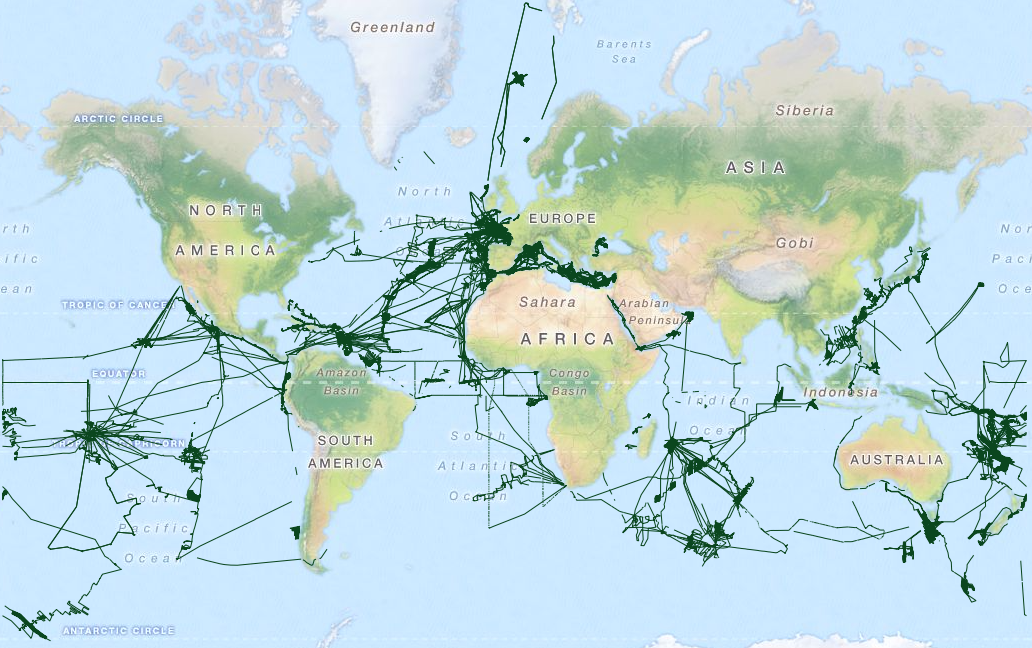
Données brutes (à l'état de sortie des navires) des sondeurs multifaisceaux (données bathymétriques et imagerie) archivées au SISMER, acquises: - par les navires océanographiques et les équipements nationaux gérés de la Flotte Océanographiques Française (FOF) - par les navires océanographiques étrangers en collaboration avec l'Ifremer - par les navires historiques de l'Ifremer (Jean Charcot, Nadir, Suroit) opérés avant la mise en place de la FOF
-
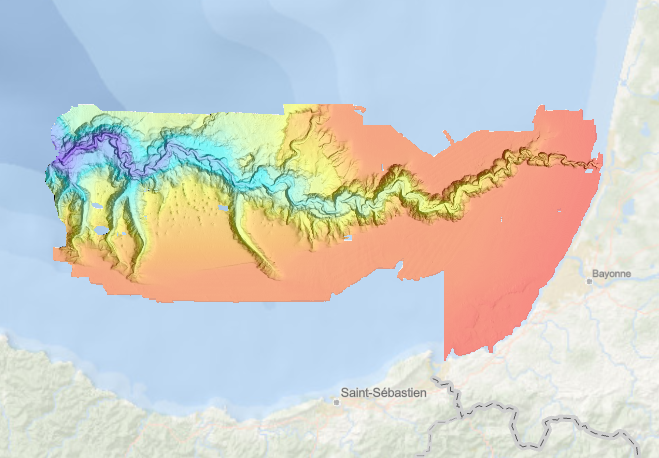
The coastal topo- bathymetric DEM for the coasts of the Saint-Jean-de-Luz bay with a resolution of 0.0002° (~ 20 m) was prepared as part of the TANDEM project. It covers Saint-Jean-de-Luz bay and the surrounding area. The DEM is designed to be implemented in the hydrodynamic models of the TANDEM project in order to estimate the coastal effects of tsunamis for the Atlantic and English Channel, where French nuclear power plants have been installed for about 30 years. This product is available with the Lowest Astronomic Tide (LAT) or the Mean Sea Level (MSL) as a vertical datum.
-
La topographie de la plage sableuse du Truc Vert (Nouvelle-Aquitaine) est suivie par DGPS depuis 2005 pendant les marées basses de vives eaux en moyenne deux fois par mois. La longueur de plage couverte a augmenté au fur et à mesure des ans, de 300 m en 2005 jusqu'à 1500 m depuis 2012. Les données sont interpolées par krigeage avec anisotropie sur une grille de résolution de 20 m et 2 m respectivement dans la direction longitudinale et transversale à la côte.