 Catalogue PIGMA
Bay of Biscay
Type of resources
Available actions
Topics
Keywords
Contact for the resource
Provided by
Years
Formats
Representation types
Update frequencies
status
Scale
Resolution
-
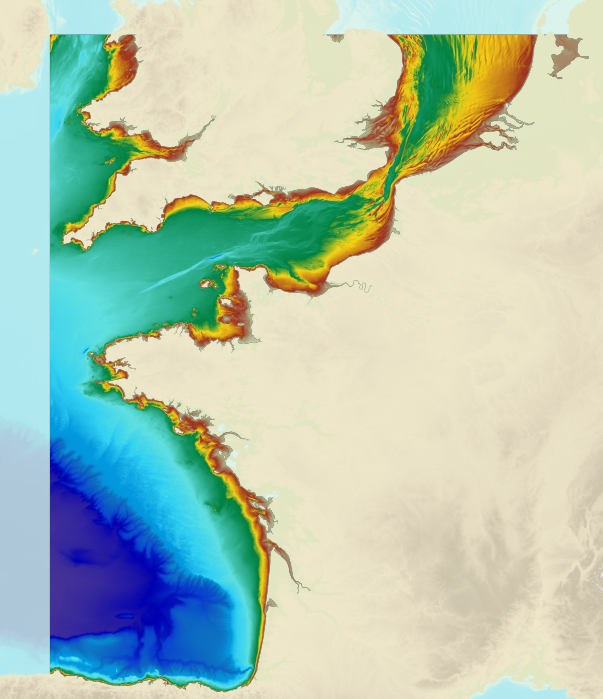
The bathymetric DEM of the atlantic facade with a resolution of 0.001° (~ 100 m) was prepared as part of the HOMONIM project. It encompasses part of the North Sea, the Channel and the Bay of Biscay. Offshore, this DTM extends beyond the slope to approximately 4800 m depth. The DEM is designed to be used in hydrodynamic models in order to produce high-precision forecasts for coastal water levels and sea conditions and therefore improve the pertinence of the Waves-Submersion monitoring programme. This product is available with the Lowest Astronomic Tide (LAT) or the Mean Sea Level (MSL) as a vertical datum.
-
The anchovy (Engraulis encrasicolus) and sardine (Sardina pilchardus) populations in the Bay of Biscay are jointly surveyed each year in May since 2000 and in September since 2003 by means of acoustic surveys. The integrated survey PELGAS (Doray et al., 2018) is run in May by France and covers the French shelf of the Bay of Biscay. Its objectives are to monitor the Bay of Biscay pelagic ecosystem in springtime and assess the biomass of its small pelagic fish species, including sardine and anchovy. Amongst many information on the ecosystem, the survey PELGAS provides knowledge on the adults of anchovy and sardine during their spawning in spring. The survey JUVENA (Boyra et al., 2013) is run in September by Spain. It has a larger spatial coverage than PELGAS, including part of the Spanish coast and open ocean outside the shelf because it targets juvenile anchovy. It also provides knowledge on sardine as well as other pelagic species. Both surveys are coordinated by the ICES Working Group on Acoustic and Egg Surveys for Small Pelagic Fish (WGACEGG), together with other pelagic surveys in ICES areas 7, 8 and 9. Survey protocoles are detailed in Doray et al. (2021). Briefly, fish backscatter data are recorded along the survey transect lines and pelagic trawl hauls are undertaken opportunistically to identify the echotraces to species and collect fish samples for biometric data. The trawl haul catches have provided the anchovy and sardine length data, from which the maps presented here are derived. At each trawl haul, the catch is sorted by species and weighted. A subsample by species is measured to estimate the species’ length distribution. The four maps presented here correspond to the average maps of anchovy and sardine length distributions in May and September, derived from the PELGAS and JUVENA trawl haul data series. The maps were obtained by kriging, following the procedure explained in Petitgas et al. (2011) for mapping functions instead of variables. For each species, the experimental length distribution at each haul was fitted by a linear combination of Legendre polynomials, the coefficients of which were co-kriged. The number of polynomials varied from 15 to 22 depending on the survey and species, with a higher number for sardine and in autumn. The length histogram at each grid node was then deduced from the mapped coefficients. When the length distribution at a given haul was estimated with less than 40 individual fish, the haul was not taken into account for mapping. This threshold defined presence and absence of the species in the haul data sets. The trawl hauls from 2000 to 2019 were pooled for the PELGAS series (1965 stations) and from 2003 to 2020 for JUVENA (852 stations). The mapping was performed on the same grid for both PELGAS and JUVENA and both species, and with similar moving kriging neighbourhoods. The grid has a mesh size of 0.25 x 0.25 decimal degree square. In addition to mapping the length distribution, presence/absence was mapped for each species by ordinary kriging on the same grid and with the same neighbourhoods as previously. The computations were performed in R (version 4.0.5) with the RGeostats package (version 13.0.1) freely available at http://rgeostats.free.fr. The map data files comprise for each species the following information: the geographical coordinates of the grid points, the probability of presence and the probability of each length class of width 0.5 cm ranging from 2.5 to 27 cm.
-
A consistent dataset of bottom trawl survey data spanning 47 years in the Bay of Biscay was assembled. The dataset includes data from the current EVHOE survey from 1987 to 2019 and two previous surveys carried out in 1973 and 1976. The recent EVHOE time-series from 1997 is also available from DATRAS (https://www.ices.dk/data/data-portals/Pages/DATRAS.aspx). The catch in numbers and weight (kg) per haul of all Rajiformes species caught in these surveys is provided. Haul information is provided for all hauls, including those with no catch of Rajiformes. Areas of the sampling strata of the survey and spatial polygones of these strata are provided in separate files.
-
This dataset comprises stomach contents of small pelagic fish species on the french shelf of the Bay of Bisacy, in spring, autumn and winter, from 2004 to 2024. The spring data were acquired in May on the pelagic survey series PELGAS from 2004 to 2024, the autumn data in October/Novermber on the demersal survey series EVHOE from 2020 to 2024 and the winter data were acquired on chartered fishing vessels in February 2023 and 2024. The dataset concerns anchovy (Engraulis encrasicolus) and sardine (Sardina pilchardus) in the 3 seasons and also mackerel (Scomber scombrus), sprat (Sprattus, sprattus) and horse mackerel (Trachurus trachurus) in spring for some years. The dataset represents a unique long-term monitoring of stomach contents characterized with a low taxonomic resolution and semi-quantitative abundance quotation. The pelagic ecosystem survey PELGAS (Doray et al., 2018) is run in each year in May since 2000, to monitor the Bay of Biscay pelagic ecosystem at springtime and assess the biomass of its small pelagic fish species. During the survey, pelagic trawl hauls are undertaken to identify echotraces to species and to measure individual fish traits. All hauls are performed during day time. In 2010, some hauls were undertaken at night to sample stomach contents over the day/night cycle. The fish stomachs are sampled from the haul catch. For a given species, twenty individuals are selected at random from the catch, their stomachs dissected and preserved. This is repeated at three hauls in each of the ten spatial strata defined to cover the entire Biscay shelf. In some years, fish length categories (lower and greater than 14 cm for anchovy and 18 cm for sardine) were also considered when sampling the stomachs. Stomach sampling by species depended on the trawl haul catch and all species were not systematically sampled jointly at the same trawl haul. Also, the number of stations with stomach sampling varied between species and years. The stomachs were preserved in formaline until 2018 and in ethanol since. Anchovy and sardine stomach sampling on the demersal survey EVHOE (Mahe and Poulard, 2005) followed the same protocole as for PELGAS but with fewer stations, depending on the catch of anchovy and sardine in the bottom trawl. In 2020 due to the Covid pandemic, the PELGAS survey was canceled and to compensate, a pair-trawler was chartered in autumn to perform some pelagic trawl hauls during the EVHOE 2020 survey. In winter 2023 and 2024 a pair-trawler was also chartered, for identifying echotraces observed previously on the survey DRIX (Doray et al., 2024) in the area delimited by the Gironde and Loire estuaries, the coast and the 100 m isobath. On the fishing vessels the fish were frozen onboard, the stomachs were dissected on land in the laboratory and preserved in ethanol. The taxonomic analysis of the stomach contents was performed in the laboratory under a binocular magnifyer by the company LAPHY. A simplified taxonomic resolution was used, which considered five ichtyoplankton groups, two copepod groups, euphausids or mysids, amphipods, two decapod groups, other crustacea, other zooplankton, phytoplankton and pulp. Taxon abundance was defined by a quotation : 0 (absence), 1 (presence : <10 individuals), 2 (abundant : between 10 and 100), 3 (very abundant : > 100). The dataset comprises trawl haul information, information on the quality of the stomach contents and abundance quotes for the list of plankton taxons. A preliminary analysis of the data (Petitgas, 2024) showed a large overlap in stomach contents between species, the importance of small copepods in the diets, and how different drivers such as habitat and length influence the diets.
-
The Pélagiques Gascogne (PELGAS, Doray et al., 2000) integrated survey aims at assessing the biomass of small pelagic fish and monitoring and studying the dynamics and diversity of the Bay of Biscay pelagic ecosystem in springtime. PELGAS has been conducted within the EU Common Fisheries Policy Data Collection Framework and Ifremer’s Fisheries Information System. The PELGAS survey model has allowed for the establishment of a long-term time-series of spatially-explicit data of the Bay of Biscay pelagic ecosystem since the year 2000. Main sampled components of the targeted ecosystem are: hydrology, phytoplankton, mesozooplankton, fish and megafauna (cetacean and seabirds). This dataset presents gridded maps of standard pelagic ecosystem parameters collected in the main sampled components during the PELGAS survey. Ecosystem parameters were mapped on a 15km x 15km grid by applying a block averaging procedure (Petitgas et al., 2009, 2014). The dataset also includes the ecologically meaningful survey dates proposed by Huret et al. (2017), mapped on the same grid. Details on survey protocols and data processing methodologies can be found in Doray et al., (2014, 2017a). This dataset was used in Authier et al., 2017; Doray et al., 2017b, 2017c, 2017a; Huret et al., 2017; Petitgas et al., 2017.
-
These data are outputs of a spatio-temporal model inferring fish distribution. The maps are based on high-resolution catch data (VMS-logbook). They have a montly time resolution and a 0.05° spatial resolution. Four demersal species of the Bay of Biscay are available in the dataset: common sole (Solea solea), megrim (Lepidorhombus whiffiagonis), anglerfish (Lophius spp) and thornback ray (Raja clavata). Maps are provided for year 2008 to 2018 ; they were produced in the context of the MACCO project (https://www.macco.fr/en/accueil-english/), an Ifremer project that aims at proposing alternative management strategies for the mixed demersal fisheries of the Bay of Biscay.
-

This set of data documents the radiocarbon dates (n=19) obtained thanks to the accelerator mass spectrometry method (AMS) at the LMC14/ARTEMIS French national facility on the cores (Multicorer, Kullenberg) retrieved from the West-Gironde mud patch (WGMP) during the JERICObent-7 cruise (10-15 July 2019; NR Côtes de la Manche, https://doi.org/10.17600/18001022). The WGMP registers very high sedimentation rates since the last 600 years (≥ 0.3 cm/yr) and is thus of great interest for palaeoceanographic investigations. At present, this depocenter marks the mid-shelf of the temperate Bay of Biscay off major French rivers from the Aquitaine basin. The fine mud deposits of the WGMP are of 3 to 4 meters thick and lie on palimpsest levels rich in gravels and shells. They cover a V-shaped structure, oriented SW-NE, which is attributed to the incision(s) of a paleovalley in the Cenozoic substrate, mainly linked to the paleo-Gironde routing changes during past glacials/interglacials, and its potential past convergences with the paleo-rivers of the Antioche perthuis (Seudre, Charente paleovalleys?) at that times. Detailed information on each sample is presented with the 14C results obtained by the Artemis AMS facility at LMC14 laboratory (Dumoulin et al. 2017- https://doi.org/10.1017/RDC.2016.116, Beck et al. 2024- https://doi.org/10.1017/RDC.2023.23). Raw ages are indicated together with calibration calculations using the last two versions of the Calib software (http://calib.org/, Calib 7 and 8) to show the dispersion of ages linked to the updating of calibration curves (Marine13, Intcal13, Marine20, Intcal 20). The calibrated ages finally retained for publications (used in the related Seanoe document - https://doi.org/10.17882/104237 - and published in Eynaud et al., 2025 for the ST3c core, https://doi.org/10.1016/j.gloplacha.2025.105039) are those obtained with the last Calib 8.1 version. Raw 14C ages were calibrated and converted to calendar ages using the IntCal20 calibration curve with a reservoir age correction of 400 years deduced from Radionuclide analyses (137Cs and 210Pb) at the top of the studied cores (see Schmidt, 2025, https://www.seanoe.org/data/00968/107979/).
-
The Pélagiques Gascogne (PELGAS, Doray et al., 2000) integrated survey aims at assessing the biomass of small pelagic fish and monitoring and studying the dynamics and diversity of the Bay of Biscay pelagic ecosystem in springtime. PELGAS has been conducted within the EU Common Fisheries Policy Data Collection Framework and Ifremer’s Fisheries Information System. Details on survey protocols and data processing methodologies can be found in Doray et al., (2014, 2018). This dataset comprises the abundance (no. of individuals), biomass (metric tons), mean length (cm), mean weight (g) of marine organisms collected by midwater trawling to identify fish echoes detected during PELGAS surveys (2000-2018). All parameters have been raised to the trawl haul level. Trawl haul metadata and species reference list are also provided.
-
We genotyped 1680 thornback ray Raja clavata sampled in the Bay of Biscay using a DNA chip described in Le Cam et al. (2019). After quality control 4604 SNPs were retained for identifying potential sex-linked SNPs using three methods: i) identification of excess of heterozygotes in one sex, ii) FST outlier analysis between the two sexes and iii) neuronal net modelling. Genotype coding: 0 homozygous for major allele, 1 heterozygous, 2 homozygous for minor allele. Flanking DNA sequences of SNPs identified with methods i) and ii) are also provided.
-
This dataset comprises energy density and proximal composition (water, ash, lipid and protein contents) for anchovy (Engraulis encrasicolus) and sardine (Sardina pilchardus) from the Bay of Biscay, the English Channel and the southern North Sea between 2014 and 2017. Fish were sampled throughout various seasons thanks to the PELGAS (May, Bay of Biscay), EVHOE (October-November, Bay of Biscay), CGFS and CAMANOC (September-October, English Channel) surveys conducted by IFREMER on the RV “Thalassa”, to the JUVENA (September-October, Bay of Biscay) survey conducted by AZTI, and from commercial landings within the European Data Collection Framework (DCF) during the CAPTAIN project (France Filière Pêche). During the surveys, pelagic (PELGAS and JUVENA) or demersal (EVHOE and CGFS) trawl hauls are undertaken to identify species and measure individual fish traits. Professional sampling was performed from pelagic trawl or purse-seine catches. From the various surveys, a sub-sampling of the trawls was performed to cover as much as possible the spatial extent of the surveys along the french coast. From the various selected trawls, a sub-sampling of 5 fish per size class (when possible) was performed to cover the size range of each species, based on the following size classes : sardine (1 : <15 cm ; 2 : 15-20 cm ; 3 : >20cm), anchovy (1 : <10cm ; 2 : 10-14 cm ; 3 : >14cm). Each fish was individually measured to the nearest tenth of a centimeter and weighted to the nearest tenth of a gram. These measurements were taken either at sea or later in the laboratory. The collected fish were frozen individually at -20°C before laboratory processing. In the laboratory, maturity stages were determined following ICES guidelines (ICES, 2008) based on macroscopic gonads observation and using a six-stage key as follows: stages 1 & 2 indicate immature and developing individuals, stages 3–5 indicate three steps of increasing gonad development and the spawning period (stage 3: partial pre-spawning; stage 4: spawning (hydrated); stage 5: partial post-spawning), and stage 6 features the final post-spawning period. Fish characterised by maturity stages 3, 4 or 5 were considered as being in an active reproductive period as opposed to fish in stages 1, 2 or 6. Fish were then ground and freeze-dried during at least 48 hours. Water content of the entire fish was determined from dry mass and wet mass ratio. Then, fish were ground again to obtain fine homogeneous dry powder for subsequent analysis. Energy density measurements were performed following the protocols of Gatti et al. (2018). Two subsamples of fish powder were placed in an adiabatic bomb calorimeter (IKA C-4000 adiabatic bomb calorimeter, IKA-WerkeGmbh & co. KG) for energy measurements. The energy density (ED, kJ.g-1 dry mass) was determined by measuring the heat released through the combustion of a small subsample, approximately 200 mg. If the coefficient of variation between the two measurements exceeded 3%, a third measurement was made. Finally, ED subsamples measurements were averaged and assigned to each individual fish. Energy density analyses were conducted on 503 individuals for anchovy and 976 individuals for sardine. Ash content was determined gravimetrically by combusting dried tissue in a muffle furnace at 550°C for six hours. Lipids and proteins were analysed by a certified laboratory (Labocea, Plouzané, France). Protein content was estimated using the Kjeldahl method. It consists in first determining the quantity of nitrogen contained in the sample, and to convert it into protein content using a conversion factor (6.25 here). Lipid content was determined by hydrolysis, using petroleum ether as an organic solvent. Carbohydrates represent less than 1% of fish mass and were thus neglected. Protein, lipid and ash content did not exactly sum to 1 in DW (anchovy: mean = 0.91, sd = 0.04; sardine: mean = 0.90, sd = 0.04). This discrepancy may arise from residual water, measurement uncertainties, or to a lesser extent the exclusion of carbohydrates. Body component contents have been normalised by dividing each component by the sum of lipids, proteins and ash content, to sum to one, enabling comparisons between fishes, assuming proportional errors across the components. A total of 116 and 104 proximate composition analyses were performed for anchovy and sardine, respectively.