 Catalogue PIGMA
CDS-CERSAT
Type of resources
Available actions
Topics
Keywords
Contact for the resource
Provided by
Years
Formats
Representation types
Update frequencies
status
Scale
Resolution
-
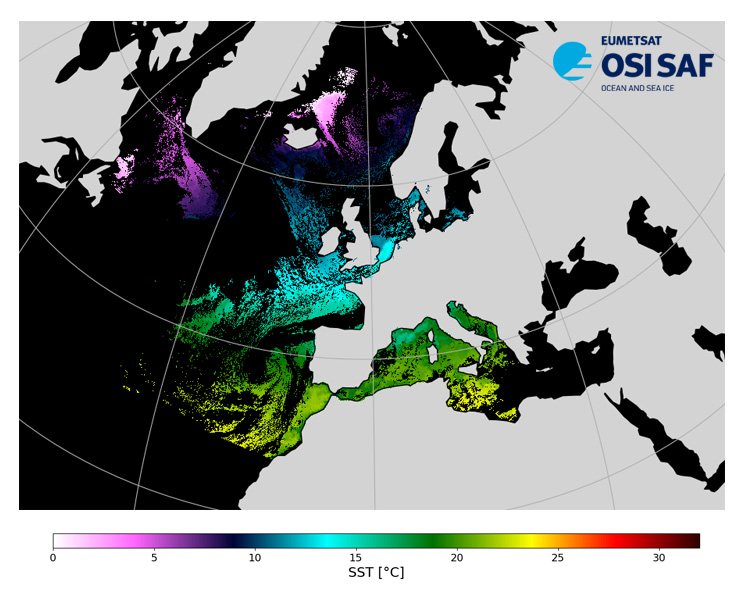
Level 3, four times a day, sub-skin Sea Surface Temperature derived from AVHRR on Metop satellites and VIIRS or AVHRR on NOAA and NPP satellites, over North Atlantic and European Seas and re-projected on a polar stereographic at 2 km resolution, in GHRSST compliant netCDF format. This catalogue entry presents Suomi-NPP North Atlantic Regional Sea Surface Temperature. SST is retrieved from infrared channels using a multispectral algorithm and a cloud mask. Atmospheric profiles of water vapor and temperature from a numerical weather prediction model, Sea Surface Temperature from an analysis, together with a radiative transfer model, are used to correct the multispectral algorithm for regional and seasonal biases due to changing atmospheric conditions. The quality of the products is monitored regularly by daily comparison of the satellite estimates against buoy measurements. The product format is compliant with the GHRSST Data Specification (GDS) version 2.Users are advised to use data only with quality levels 3,4 and 5.
-
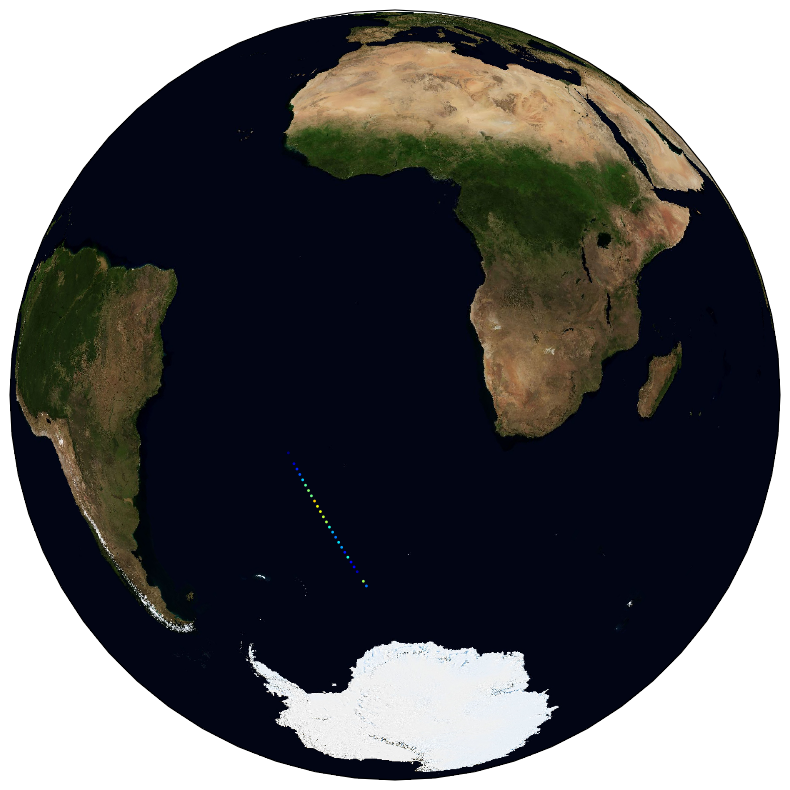
The ESA Sea State Climate Change Initiative (CCI) project has produced global multi-sensor time-series of along-track satellite synthetic aperture radar (SAR) integrated sea state parameters (ISSP) data from ENVISAT (referred to as SAR Wave Mode onboard ENVISAT Level 2P (L2P) ISSP data) with a particular focus for use in climate studies. This dataset contains the ENVISAT Remote Sensing Integrated Sea State Parameter product (version 1.1), which forms part of the ESA Sea State CCI version 3.0 release. This product provides along-track significant wave height (SWH) measurements at 5km resolution every 100km, processed using the Li et al., 2020 empirical model, separated per satellite and pass, including all measurements with flags and uncertainty estimates. These are expert products with rich content and no data loss. The SAR Wave Mode data used in the Sea State CCI SAR WV onboard ENVISAT Level 2P (L2P) ISSP v3 dataset come from the ENVISAT satellite mission spanning from 2002 to 2012.
-
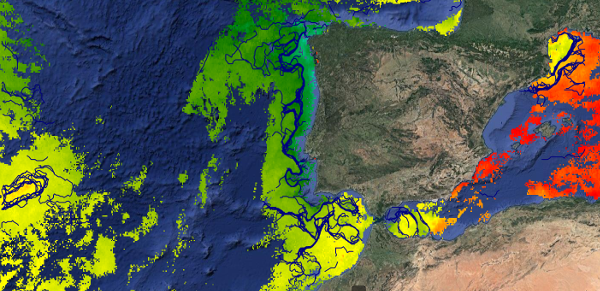
This dataset provides detections of fronts derived from high resolution remote sensing SST observations by SEVIRI L3C from OSISAF over Western Europe region. The data are available through HTTP and FTP; access to the data is free and open. In order to be informed about changes and to help us keep track of data usage, we encourage users to register at: https://forms.ifremer.fr/lops-siam/access-to-esa-world-ocean-circulation-project-data/ This dataset was generated by OceanDataLab and is distributed by Ifremer / CERSAT in the frame of the World Ocean Circulation (WOC) project funded by the European Space Agency (ESA).
-
4-Dimensional Daily Temperature and Marine Heatwaves Categories from ESA/CAREHeat project, version 2

The 4D Marine Heatwaves (MHW) atlas contains 4D (x, y, z, t) **daily temperature and marine heatwaves categories** for global region [82.875°S-89.875°N, 0.125°E-359.875°E], from 0 to 300m depth and a spatial resolution of 1/8°. It covers the period 1993-2022. The MHW atlas has been computed from the temperature 4D fields of the ARMOR3D global product delivered in the Copernicus Marine Service (MULTIOBS_GLO_PHY_TSUV_3D_MYNRT_015_012 - https://doi.org/10.48670/moi-00052 ). The MHW categories are derived from the Hobday’s method [Hobday et al.,2018]. Each MHW event is classified among four categories (moderate to extreme), identified in terms of multiples of the local difference between the 90th percentile and climatological values, and defined as moderate (1-2×, Category I), strong (2-3×, Category II), severe (3-4×, Category III), and extreme (>4×, Category IV). When the category is zero, this means that there is no MHW. The period 1993-2021 is used as a baseline for defining the climatology to be as close as possible to the 30-year period suggested by Hobday. This choice is motivated by the need of altimetry data to constrain the vertical temperature reconstruction, which is required for most ocean reanalyses as well. Additionally, ancillary data are provided together with the data. It consists of 4D daily **temperature climatology** and **90 percentiles of the temperature**. These fields have been used to compute the MHW categories. They are delivered over the same domain as the MHW atlas. ARMOR3D **temperature uncertainties** are also supplied as they can help users to select only the most reliable events in the database. This dataset was generated by CLS (Collecte Localisation satellite) and is distributed by Ifremer /CERSAT in the frame of the CAREHeat project (CAREHeat Website) funded by the European Space Agency (ESA).
-

Level 3, four times a day, sub-skin Sea Surface Temperature derived from AVHRR on Metop satellites and VIIRS or AVHRR on NOAA and NPP satellites, over North Atlantic and European Seas and re-projected on a polar stereographic at 2 km resolution, in GHRSST compliant netCDF format. This catalogue entry presents NOAA-19 North Atlantic Regional Sea Surface Temperature. SST is retrieved from infrared channels using a multispectral algorithm and a cloud mask. Atmospheric profiles of water vapor and temperature from a numerical weather prediction model, Sea Surface Temperature from an analysis, together with a radiative transfer model, are used to correct the multispectral algorithm for regional and seasonal biases due to changing atmospheric conditions. The quality of the products is monitored regularly by daily comparison of the satellite estimates against buoy measurements. The product format is compliant with the GHRSST Data Specification (GDS) version 2.Users are advised to use data only with quality levels 3,4 and 5.
-
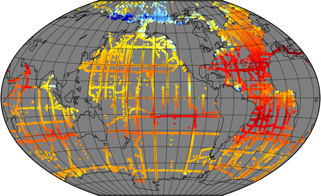
In recent years, large datasets of in situ marine carbonate system parameters (partial pressure of CO2 (pCO2), total alkalinity, dissolved inorganic carbon and pH) have been collated. These carbonate system datasets have highly variable data density in both space and time, especially in the case of pCO2, which is routinely measured at high frequency using underway measuring systems. This variation in data density can create biases when the data are used, for example for algorithm assessment, favouring datasets or regions with high data density. A common way to overcome data density issues is to bin the data into cells of equal latitude and longitude extent. This leads to bins with spatial areas that are latitude and projection dependent (eg become smaller and more elongated as the poles are approached). Additionally, as bin boundaries are defined without reference to the spatial distribution of the data or to geographical features, data clusters may be divided sub-optimally (eg a bin covering a region with a strong gradient). To overcome these problems and to provide a tool for matching in situ data with satellite, model and climatological data, which often have very different spatiotemporal scales both from the in situ data and from each other, a methodology has been created to group in situ data into ‘regions of interest’, spatiotemporal cylinders consisting of circles on the Earth’s surface extending over a period of time. These regions of interest are optimally adjusted to contain as many in situ measurements as possible. All in situ measurements of the same parameter contained in a region of interest are collated, including estimated uncertainties and regional summary statistics. The same grouping is done for each of the other datasets, producing a dataset of matchups. About 35 million in situ datapoints were then matched with data from five satellite sources and five model and re-analysis datasets to produce a global matchup dataset of carbonate system data, consisting of 287,000 regions of interest spanning 54 years from 1957 to 2020. Each region of interest is 100 km in diameter and 10 days in duration. An example application, the reparameterisation of a global total alkalinity algorithm, is shown. This matchup dataset can be updated as and when in situ and other datasets are updated, and similar datasets at finer spatiotemporal scale can be constructed, for example to enable regional studies. This dataset was funded by ESA Satellite Oceanographic Datasets for Acidification (OceanSODA) project which aims at developing the use of satellite Earth Observation for studying and monitoring marine carbonate chemistry. **This version is now superseded by the version 4 with higher spatial and temporal resolution**
-

This daily High-Resolution (HR) Level 3 gridded wind product is derived from Copernicus Sentinel-1 SAR (Synthetic Aperture Radar) observations, over the North Western Atlantic ("ATL" area). It is based on the European Space Agency (ESA) Level-2 OCN products at the highest available resolution. Although L2-OCN products already contain wind vectors, those are calculated using the CMOD5.n Geophysical Model Function (GMF) applied to the co-polarized (co-pol) VV channel (emitting in Vertical polarization and receiving in Vertical polarization). This VV GMF was mapped from scatterometer sensors (Hersbach et al., 2007) which are only able to use co-pol measurements. However, these co-pol GMF are known to lose sensitivity for wind above 20 m/s. Therefore, wind based on such GMF alone, are known to under-estimate wind speed (Polverari et al., 2022). For the L3 products winds based on SAR, we take advantage of the available cross-polarized (cross-pol) VH channel (emitting in Vertical polarization and receiving in Horizontal polarization) for which GMF were specifically derived based on C-Band SAR (Mouche et al., 2017, Mouche et al., 2019). Winds estimated from the combination of both the co-pol and cross-pol channels are referred to as dual-polarization (or dual-pol) winds. As shown in Mouche et al. (2019), taking advantage of the dual polarization strongly improves the wind estimation for high wind conditions thanks to the much greater VH channel sensitivity compared to VV. These new wind estimations are then gridded with a 0.012 degree resolution (between 0.5 and 1.2 km in zonal direction depending on the latitude and 1.3 km in meridional direction) using a cylindrical equidistant projection, independently for ascending and descending satellite passes and for each satellite (so 4 wind fields are available per day for two satellites). This dataset is generated over all Sentinel-1 mission time series starting from March 2018 and updated in delayed mode with a 4-months delay. It is also produced for 4 other different European areas. This dataset is produced and disseminated in the frame of Copernicus Marine Service.
-

Level 3, four times a day, sub-skin Sea Surface Temperature derived from AVHRR on Metop satellites and VIIRS or AVHRR on NOAA and NPP satellites, over North Atlantic and European Seas and re-projected on a polar stereographic at 2 km resolution, in GHRSST compliant netCDF format. This catalogue entry presents Metop-B North Atlantic Regional Sea Surface Temperature. SST is retrieved from infrared channels using a multispectral algorithm and a cloud mask. Atmospheric profiles of water vapor and temperature from a numerical weather prediction model, Sea Surface Temperature from an analysis, together with a radiative transfer model, are used to correct the multispectral algorithm for regional and seasonal biases due to changing atmospheric conditions. The quality of the products is monitored regularly by daily comparison of the satellite estimates against buoy measurements. The product format is compliant with the GHRSST Data Specification (GDS) version 2.Users are advised to use data only with quality levels 3,4 and 5.
-

Level 3, four times a day, sub-skin Sea Surface Temperature derived from AVHRR on Metop satellites and VIIRS or AVHRR on NOAA and NPP satellites, over North Atlantic and European Seas and re-projected on a polar stereographic at 2 km resolution, in GHRSST compliant netCDF format. This catalogue entry presents Metop-A North Atlantic Regional Sea Surface Temperature. SST is retrieved from infrared channels using a multispectral algorithm and a cloud mask. Atmospheric profiles of water vapor and temperature from a numerical weather prediction model, Sea Surface Temperature from an analysis, together with a radiative transfer model, are used to correct the multispectral algorithm for regional and seasonal biases due to changing atmospheric conditions. The quality of the products is monitored regularly by daily comparison of the satellite estimates against buoy measurements. The product format is compliant with the GHRSST Data Specification (GDS) version 2.Users are advised to use data only with quality levels 3,4 and 5.
-
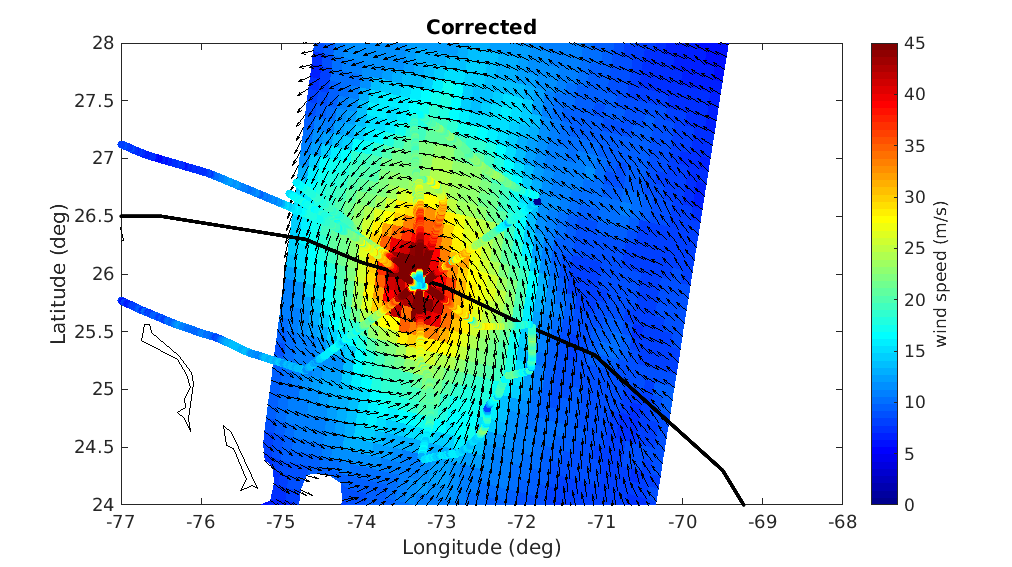
A prerequisite for a successful development of a multi-mission wind dataset is to ensure good inter-calibration of the different extreme wind datasets to be integrated in the product. Since the operational hurricane community is working with the in-situ dropsondes as wind speed reference, which are in turn used to calibrate the NOAA Hurricane Hunter Stepped Frequency Microwave Radiometer (SFMR) wind data, MAXSS has used the latter to ensure extreme-wind inter-calibration among the following scatterometer and radiometer systems: the Advanced Scatterometers onboard the Metop series (i.e., ASCAT-A, -B, and -C), the scatterometers onboard Oceansat-2 (OSCAT) and ScatSat-1 (OSCAT-2), and onboard the HY-2 series (HSCAT-A, -B); the Advanced Microwave Scanning Radiometer 2 onboard GCOM-W1(AMSR-2), the multi-frequency polarimetric radiometer (Windsat), and the L-band radiometers onboard the Soil Moisture and Ocean Salinity (SMOS) and the Soil Moisture Active Passive (SMAP) missions. In summary, a two-step strategy has been followed to adjust the high and extreme wind speeds derived from the mentioned scatterometer and radiometer systems, available in the period 2009-2020. First, the C-band ASCATs have been adjusted against collocated storm-motion centric SFMR wind data. Then, both SFMR winds and ASCAT adjusted winds have been used to adjust all the other satellite wind systems. In doing so, a good inter-calibration between all the systems is ensured not only under tropical cyclone (TC) conditions, but also elsewhere. This dataset was produced in the frame of the ESA funded Marine Atmosphere eXtreme Satellite Synergy (MAXSS) project. The primary objective of the ESA Marine Atmosphere eXtreme Satellite Synergy (MAXSS) project is to provide guidance and innovative methodologies to maximize the synergetic use of available Earth Observation data (satellite, in situ) to improve understanding about the multi-scale dynamical characteristics of extreme air-sea interaction.