 Catalogue PIGMA
/Biological Environment/Species/Fish Species of Commercial Interest
Type of resources
Available actions
Topics
Keywords
Contact for the resource
Provided by
Years
Formats
Representation types
status
Scale
-
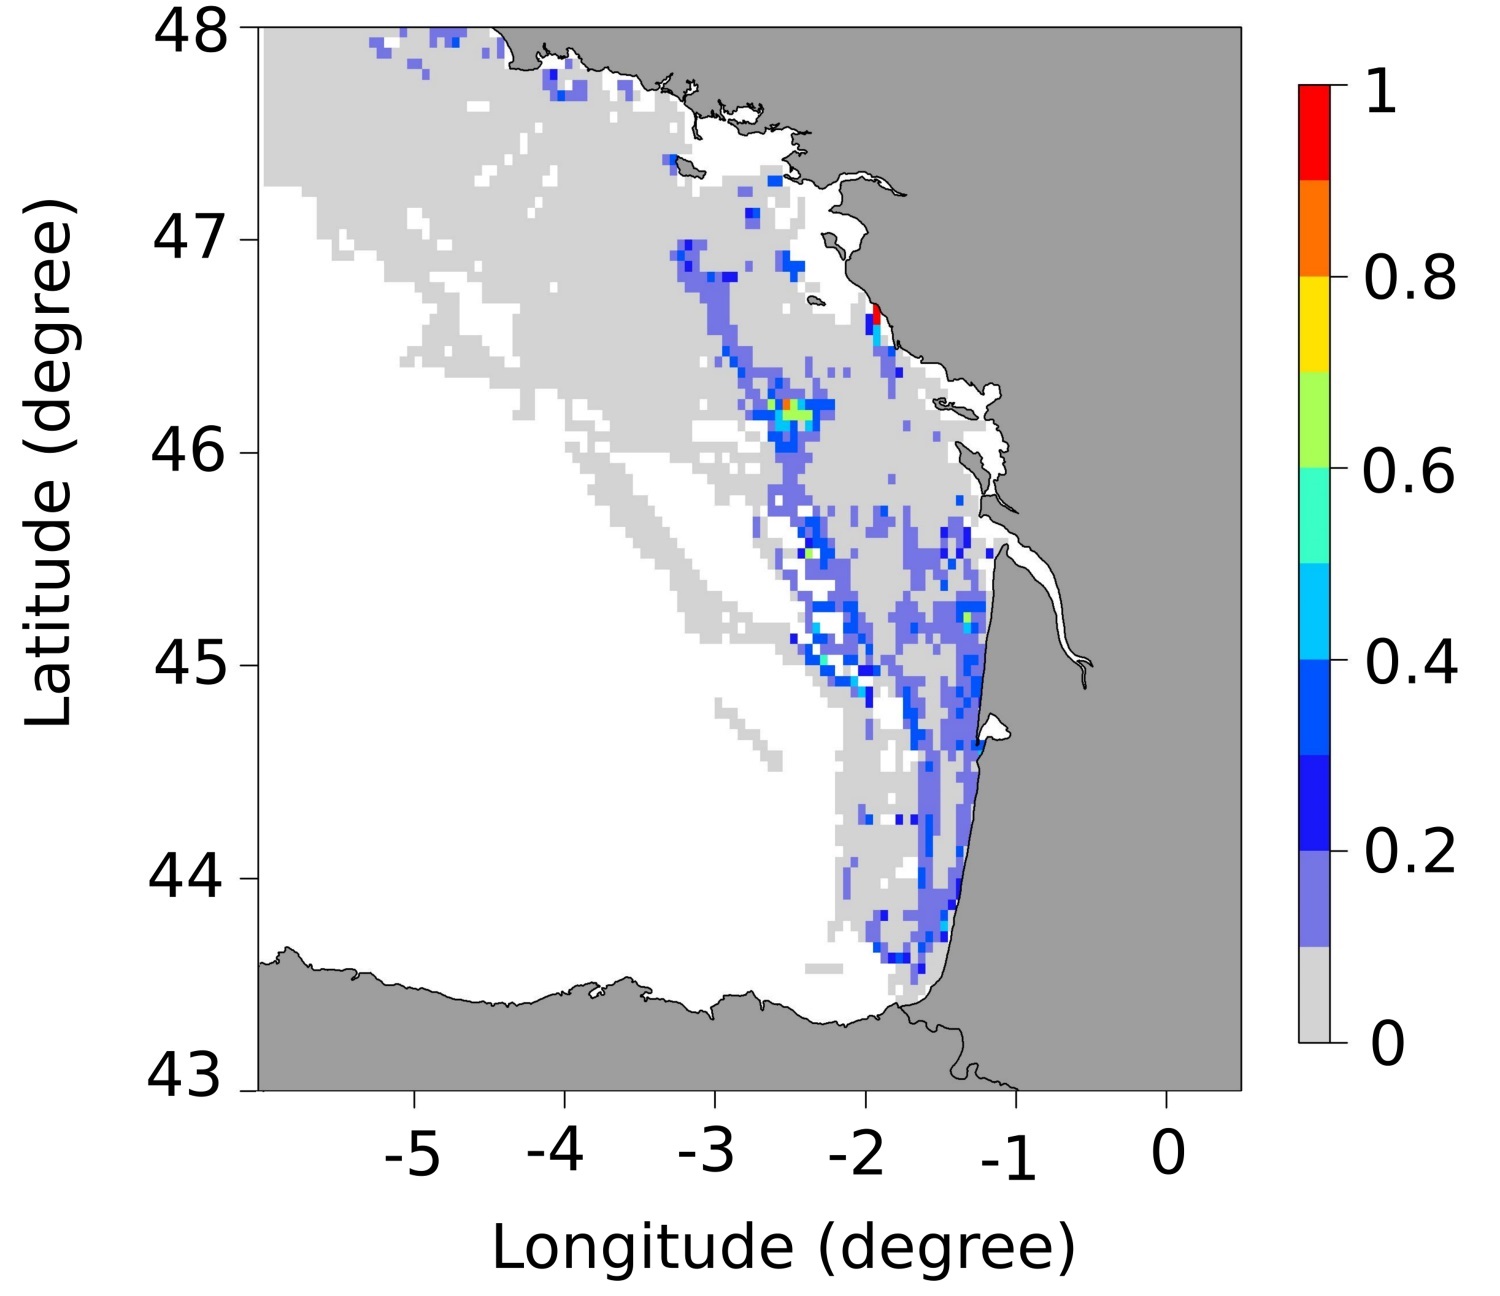
These maps represent the monthly probability of being a seabass spawning area for each month of the spawning season (January to March), and the mean probability of being a seabass spawning area over all spawning months in the Bay of Biscay. These probability maps were calculated by performing a geostatistical analysis of fishing data from geolocated vessels, and have a spatial resolution of 3 by 3 nautical miles.
-
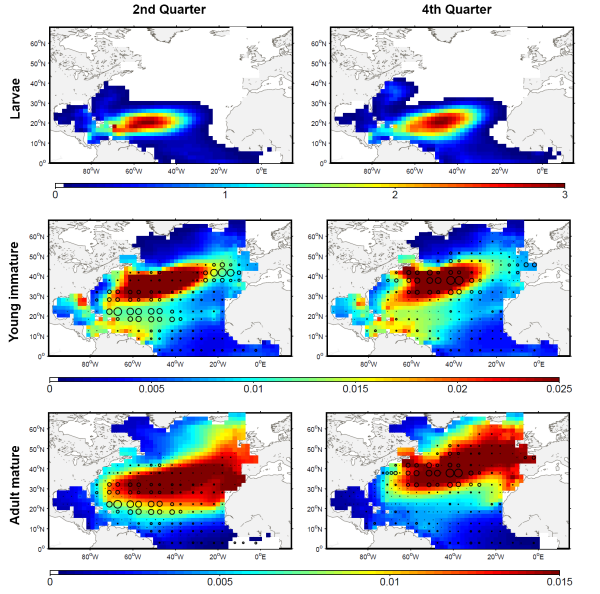
The development of the ecosystem approach and models for the management of ocean marine resources requires easy access to standard validated datasets of historical catch data for the main exploited species. They are used to measure the impact of biomass removal by fisheries and to evaluate the models skills, while the use of standard dataset facilitates models inter-comparison. North Atlantic albacore tuna is exploited all year round by longline and in summer and autumn by surface fisheries and fishery statistics compiled by the International Commission for the Conservation of Atlantic Tunas (ICCAT). Catch and effort with geographical coordinates at monthly spatial resolution of 1° or 5° squares were extracted for this species with a careful definition of fisheries and data screening. In total, thirteen fisheries were defined for the period 1956-2010, with fishing gears longline, troll, mid-water trawl and bait fishing. However, the spatialized catch effort data available in ICCAT database represent a fraction of the entire total catch. Length frequencies of catch were also extracted according to the definition of fisheries above for the period 1956-2010 with a quarterly temporal resolution and spatial resolutions varying from 1°x 1° to 10°x 20°. The resolution used to measure the fish also varies with size-bins of 1, 2 or 5 cm (Fork Length). The screening of data allowed detecting inconsistencies with a relatively large number of samples larger than 150 cm while all studies on the growth of albacore suggest that fish rarely grow up over 130 cm. Therefore, a threshold value of 130 cm has been arbitrarily fixed and all length frequency data above this value removed from the original data set.
-

List of fish stocks referenced for the year 2018. The repository includes 477 stocks. Each stock is identified by a unique key in accordance with the ICES codification in use. Each record contains a stock identifier, a species or group of species identifier according to the ASFIS/FAO classification, the English stock name, the Latin name of the species, the assessment area according to the FAO codification of fishing sectors. When the stock assessment area groups a series of sectors, the first and last sectors in the series are separated by a dash.
-

Global fisheries landings data from a range of public sources was harmonised and mapped to 30-min spatial cells based on the distribution of the reported taxa and the fishing fleets involved. This data was extended to include the associated fishing gear used, as well as estimates of illegal, unregulated and unreported catch (IUU) and discards at sea. Expressed as catch rates, these results also separated small-scale fisheries from other fishing operations. The dataset covers 1950 to 2014 inclusive. Mapped catch allows study of the impacts of fisheries on habitats and fauna, on overlap with the diets of marine birds and mammals, and on the related use of fuels and release of greenhouse gases. The fine-scale spatial data can be aggregated to the exclusive economic zone claims of countries and will allow study of the value of landed marine products to their economies and food security, and to those of their trading partners.
-
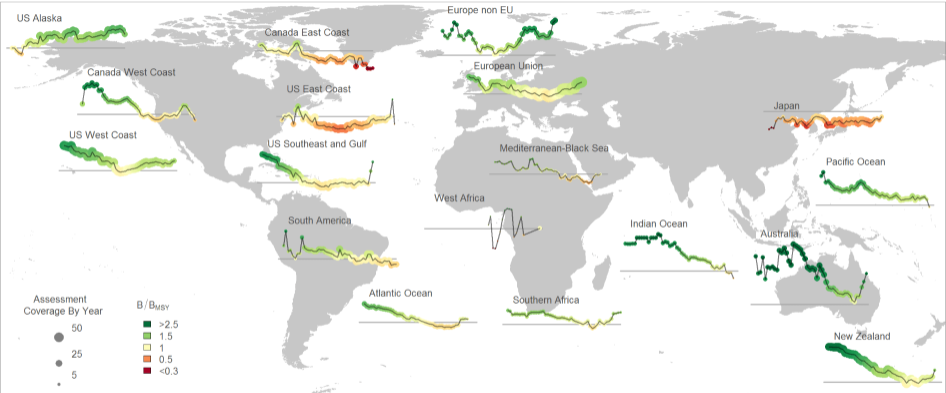
The RAM Legacy Stock Assessment Database is a compilation of stock assessment results for commercially exploited marine populations from around the world. The RAM Legacy Stock Assessment Database is grateful to the many stock assessment scientists whose work this database is based upon and the many collaborators who recorded the assessment model results for inclusion in the RAM Legacy Stock Assessment Database. Since 2011 the RAM Legacy Data base has been hosted and managed at the University of Washington with financial assistance from a consortium of Seattle-based seafood companies and organizations, and from the Walton Family Foundation. Initial development of the database from 2006-2010 was supported by the Census of Marine Life, Canadian Foundation for Innovation, NCEAS, NSERC, the Smith Conservation Research Fellowship, New Jersey Sea Grant, and the National Science Foundation.
-

The Commission for the Conservation Southern Bluefin Tuna collects a variety of data types from its Members and Cooperating Non-Members, including total catch, catch and effort data, and catch at size data. Catch, size and trade information is also collected through the Commission's Catch Documentation Scheme, Japanese import statistics, and other monitoring programs. Annual catches provided on this page are reported on a calendar year basis. CCSBT Members use quota years (not calendar years) for managing catching limits, but quota years differ between Members, so calendar years are used to provide catches on a common timescale. Relevant subsets and summaries of these data are provided below. All figures are subject to change as improved data or estimates become available. In particular, reviews of SBT data in 2006 indicated that southern bluefin tuna catches may have been substantially under-reported over the previous 10-20 years and the data presented here do not include estimates for this unreported catch. Also, data for the last reported year of catch (2020) are preliminary and are subject to revision. Any latitudes and longitudes presented in these summaries represent the north western corner of the relevant grid, which is a 5*5 grid unless otherwise specified. Other information on Members and Cooperating Non-Members fishing activities appears in the reports of the Extended Scientific Committee, Compliance Committee and Extended Commission.
-

The abundance of ichthyoplankton in samples from dedicated plankton surveys by Cefas with positional and sample data. Surveys took place off the Western Coast of the UK and Ireland between 1986 and 2004. Series of cruises undertaken to contribute to the estimation of the spawning stock biomass of the western mackerel and horse mackerel stocks by plankton survey. The triennial mackerel egg surveys were begun in 1977 to estimate the SSB of the western mackerel stock. Since 1986 the surveys have also been used to estimate the SSB of horse mackerel. Plankton sampling is undertaken to estimate the egg production and trawling is carried out to estimate the mean fecundity of the mature female fish. Various designs of Gulf VII type samplers have been used with various apertures of nosecones and 270 micron nets. Samplers are now standardised to the 53cm version, fitted with 20cm aperture nosecones. Analysis at Cefas involved separating all fish eggs and larvae from samples. Where possible all eggs were identified. Eggs lacking identifiable features were measured. Where >100 eggs were found, sub-sampling was undertaken. Eggs that were unmeasured were apportioned across the size distribution of measured eggs. All mackerel and horse mackerel eggs were staged.
-

The International Commission for the Conservation of Atlantic Tunas is an inter-governmental fishery organization responsible for the conservation of tunas and tuna-like species in the Atlantic Ocean and its adjacent seas. ICCAT compiles fishery statistics from its members and from all entities fishing for these species in the Atlantic Ocean, coordinates research, including stock assessment, on behalf of its members, develops scientific-based management advice, provides a mechanism for Contracting Parties to agree on management measures, and produces relevant publications. Science underpins the management decisions made by ICCAT. Much of the information available on this site relates to scientific data, reports of scientific meetings and to scientific articles.
-

GAM-NICHE is a new tool developed by AZTI (Valle et al. 2023) to build Species Distribution Models (SDMs) under the ecological niche theory (Citores et al. 2020). It provides a GitHub tutorial in R language with an application to marine fish. Species Distribution Models (SDMs) are numerical tools that combine observations of species occurrence or abundance at known locations with information on the environmental and/or spatial characteristics of those locations (Elith and Leathwick 2009). SDMs are widely used as a tool for understanding species spatial ecology and are also known as ecological niche models (ENM) or habitat suitability models. According to ecological niche theory, species response curves are unimodal with respect to environmental gradients (Hutchinson 1957). While a variety of statistical methods have been developed for species distribution modelling, a general problem with most of these habitat modelling approaches is that the estimated response curves can display biologically implausible shapes which do not respect ecological niche theory. This is because species response curves are fit statistically with any assumption or restriction, which sometimes do not respect the ecological niche theory. To better understand species response to environmental changes, SDMs should consider theoretical background such as the ecological niche theory and pursue the unimodality of the response curves with respect to environmental gradients. This book provides a tutorial on how to use Shape-Constrained Generalized Additive Models (SC-GAMs) to build SDMs under the ecological niche theory framework (Citores et al. 2020). SC-GAMs impose monotonicity and concavity constraints in the linear predictor of the GAMs and avoid overfitting. SC-GAM is an effective alternative to fitting nonsymmetric parametric response curves, while retaining the unimodality constraint, required by ecological niche theory, for direct variables and limiting factors. The book is organised following the key steps in good modelling practice of SDMs (Elith and Leathwick 2009). First, presence data of a selected species are downloaded from GBIF/OBIS global public datasets and pseudo-absence data are created. Then, environmental data are downloaded from public repositories and extracted at each of the presence/pseudo-absence data points. Based on this dataset, an exploratory analysis is conducted to help deciding on the best modelling approach. The model is fitted to the dataset and the quality of the fit and the realism of the fitted response function are evaluated. After selecting a threshold to transform the continuous probability predictions into binary responses, the model is validated using a k-fold approach. Finally, the predicted maps are generated for visualization. The code is available in AZTI’s github repository and the book is readily available. This work is licensed under a Creative Commons Attribution-NonCommercial-ShareAlike 4.0 International License (CC BY-NC-SA 4.0) To cite the book, please use: Valle, M., Citores, L., Ibaibarriaga, L., Chust, C. (2023) GAM-NICHE: Shape-Constrained GAMs to build Species Distribution Models under the ecological niche theory. AZTI. https://doi.org/10.57762/fzpy-6w51 References Citores, L, L Ibaibarriaga, DJ Lee, MJ Brewer, M Santos, and G Chust. 2020. “Modelling Species Presence–Absence in the Ecological Niche Theory Framework Using Shape-Constrained Generalized Additive Models.” Ecological Modelling 418: 108926. https://doi.org/10.1016/j.ecolmodel.2019.108926.