 Catalogue PIGMA
CLS
Type of resources
Available actions
Topics
Keywords
Contact for the resource
Provided by
Years
Formats
Representation types
Update frequencies
status
Scale
Resolution
-
Specifications of the desirable and recommended product attributes for generating spatial layers of sea level trend for the last 10 years for the Mediterranean basin and for each NUTS3 region along the coast.
-
Specification of the desirable and recommended product attributes for generating time series of sea level trend for the last 10 years for the Mediterranean basin for each NUTS3 region along the coast.
-
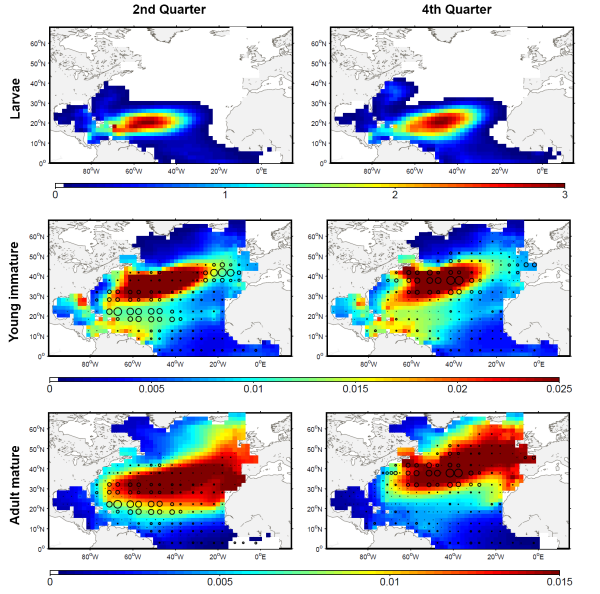
The development of the ecosystem approach and models for the management of ocean marine resources requires easy access to standard validated datasets of historical catch data for the main exploited species. They are used to measure the impact of biomass removal by fisheries and to evaluate the models skills, while the use of standard dataset facilitates models inter-comparison. North Atlantic albacore tuna is exploited all year round by longline and in summer and autumn by surface fisheries and fishery statistics compiled by the International Commission for the Conservation of Atlantic Tunas (ICCAT). Catch and effort with geographical coordinates at monthly spatial resolution of 1° or 5° squares were extracted for this species with a careful definition of fisheries and data screening. In total, thirteen fisheries were defined for the period 1956-2010, with fishing gears longline, troll, mid-water trawl and bait fishing. However, the spatialized catch effort data available in ICCAT database represent a fraction of the entire total catch. Length frequencies of catch were also extracted according to the definition of fisheries above for the period 1956-2010 with a quarterly temporal resolution and spatial resolutions varying from 1°x 1° to 10°x 20°. The resolution used to measure the fish also varies with size-bins of 1, 2 or 5 cm (Fork Length). The screening of data allowed detecting inconsistencies with a relatively large number of samples larger than 150 cm while all studies on the growth of albacore suggest that fish rarely grow up over 130 cm. Therefore, a threshold value of 130 cm has been arbitrarily fixed and all length frequency data above this value removed from the original data set.
-
Description of attributes for time series of sea level trend for the last 10 yrs for the Mediterranean basin and for each NUTS3 region along the coast.
-
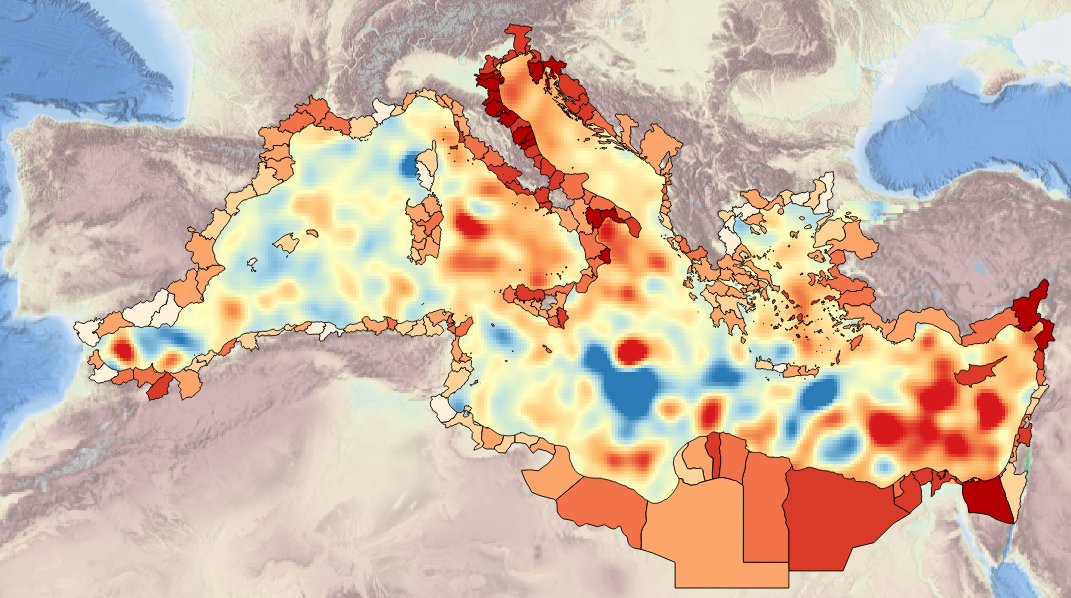
Description ot the spatial layers attributes of sea level trend for the last 10 years for the Mediterranean basin and for each NUTS3 region along the coast.
-
4-Dimensional Daily Temperature and Marine Heatwaves Categories from ESA/CAREHeat project, version 2

The 4D Marine Heatwaves (MHW) atlas contains 4D (x, y, z, t) **daily temperature and marine heatwaves categories** for global region [82.875°S-89.875°N, 0.125°E-359.875°E], from 0 to 300m depth and a spatial resolution of 1/8°. It covers the period 1993-2022. The MHW atlas has been computed from the temperature 4D fields of the ARMOR3D global product delivered in the Copernicus Marine Service (MULTIOBS_GLO_PHY_TSUV_3D_MYNRT_015_012 - https://doi.org/10.48670/moi-00052 ). The MHW categories are derived from the Hobday’s method [Hobday et al.,2018]. Each MHW event is classified among four categories (moderate to extreme), identified in terms of multiples of the local difference between the 90th percentile and climatological values, and defined as moderate (1-2×, Category I), strong (2-3×, Category II), severe (3-4×, Category III), and extreme (>4×, Category IV). When the category is zero, this means that there is no MHW. The period 1993-2021 is used as a baseline for defining the climatology to be as close as possible to the 30-year period suggested by Hobday. This choice is motivated by the need of altimetry data to constrain the vertical temperature reconstruction, which is required for most ocean reanalyses as well. Additionally, ancillary data are provided together with the data. It consists of 4D daily **temperature climatology** and **90 percentiles of the temperature**. These fields have been used to compute the MHW categories. They are delivered over the same domain as the MHW atlas. ARMOR3D **temperature uncertainties** are also supplied as they can help users to select only the most reliable events in the database. This dataset was generated by CLS (Collecte Localisation satellite) and is distributed by Ifremer /CERSAT in the frame of the CAREHeat project (CAREHeat Website) funded by the European Space Agency (ESA).
-
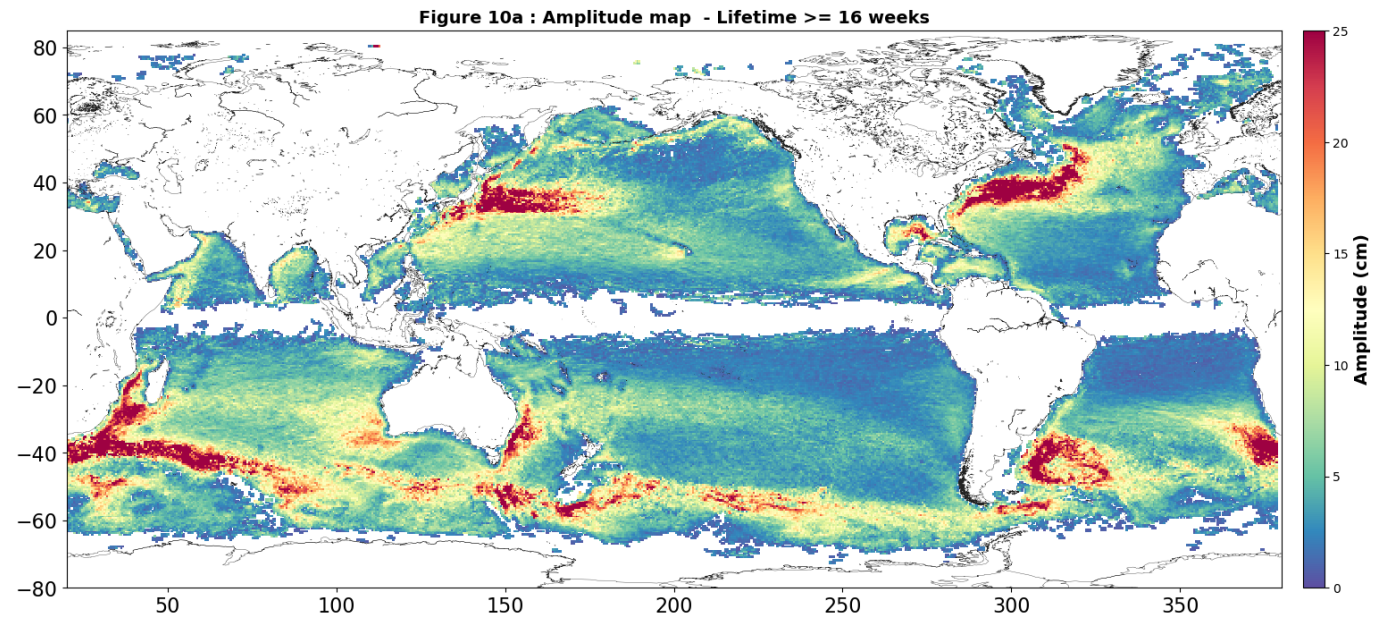
Tourbillons détectés en temps différé (Delayed-Time - DT) pour toute la période [1993 - aujourd'hui]. Les variables fournies incluent pour chaque fichier journalier, et pour un type de rotation (Cyclonique/Anticyclonique) : - Position du centre (Longitude et latitude du centre du cercle le mieux ajusté avec le contour de la vitesse géostrophique moyenne circonférentielle maximale) ; - Amplitude (|SSH(local_extremum) - SSH(outermost_contour)|) ; - Rayon de vitesse (Rayon du cercle de meilleur ajustement avec le contour de la vitesse géostrophique moyenne circonférentielle maximale) ; - Vitesse moyenne (Vitesse géostrophique moyenne du contour définissant le rayon de vitesse) ; - Profil de vitesse (profil des valeurs moyennes de vitesse du contour effectif vers l'intérieur jusqu'au plus petit contour intérieur) ; - Contour effectif (Plus grand contour du tourbillon détecté) ; - Contour de vitesse (Contour de la vitesse géostrophique moyenne circonférentielle maximale pour le tourbillon détecté).
-
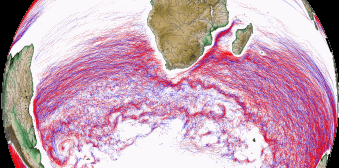
Tourbillons détectés en temps différé (Delayed-Time - DT) pour toute la période [1993 - aujourd'hui]. Les variables fournies incluent pour chaque fichier journalier, et pour un type de rotation (Cyclonique/Anticyclonique) : - Position du centre (Longitude et latitude du centre du cercle le mieux ajusté avec le contour de la vitesse géostrophique moyenne circonférentielle maximale) ; - Amplitude (|SSH(local_extremum) - SSH(outermost_contour)|) ; - Rayon de vitesse (Rayon du cercle de meilleur ajustement avec le contour de la vitesse géostrophique moyenne circonférentielle maximale) ; - Vitesse moyenne (Vitesse géostrophique moyenne du contour définissant le rayon de vitesse) ; - Profil de vitesse (profil des valeurs moyennes de vitesse du contour effectif vers l'intérieur jusqu'au plus petit contour intérieur) ; - Contour effectif (Plus grand contour du tourbillon détecté) ; - Contour de vitesse (Contour de la vitesse géostrophique moyenne circonférentielle maximale pour le tourbillon détecté).
-
-
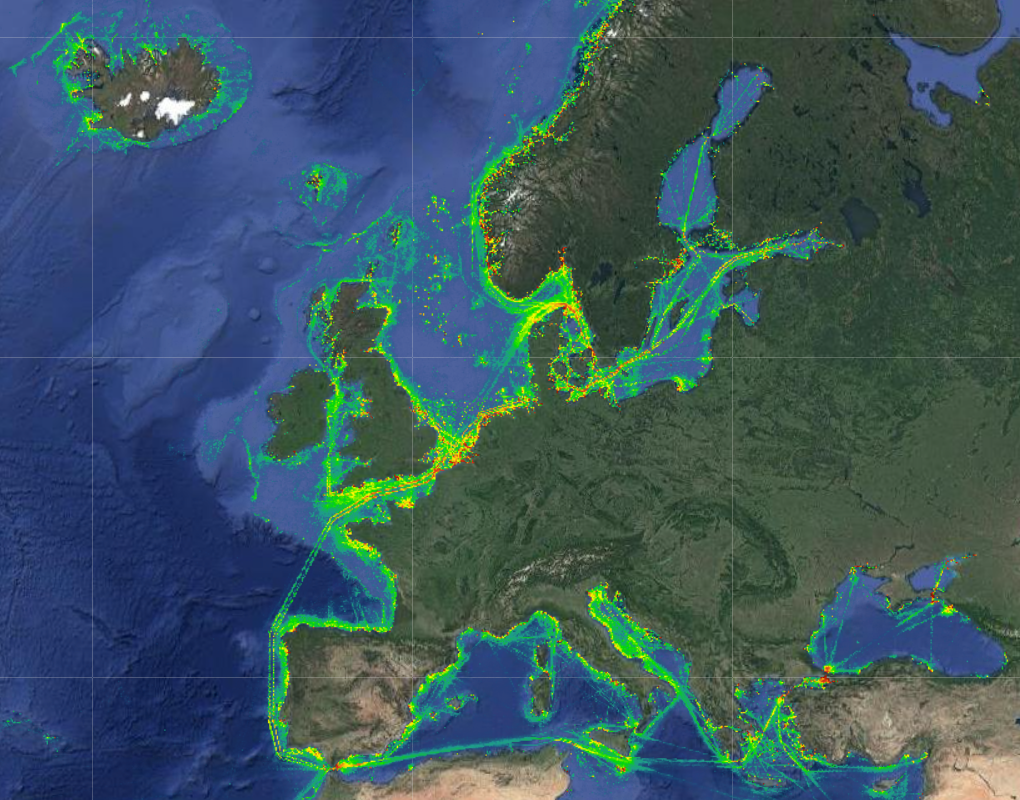
The Vessel Density maps in the EU were created in 2019 by Cogea for the European Marine Observation and Data Network (EMODnet). The dataset is updated every year and is available for viewing and download on EMODnet Human Activities web portal (www.emodnet-humanactivities.eu). The maps are based on AIS data yearly purchased from Collecte Localisation Satellites (CLS) and ORBCOMM. The maps, GeoTIFF format, show shipping density in 1x1km cells of a grid covering all EU waters and some neighbouring areas. Density is expressed as hours per square kilometre per month. The following ship types are available:0 Other, 1 Fishing, 2 Service, 3 Dredging or underwater ops, 4 Sailing, 5 Pleasure Craft, 6 High speed craft, 7 Tug and towing, 8 Passenger, 9 Cargo, 10 Tanker, 11 Military and Law Enforcement, 12 Unknown and All ship types. Data are available by month of year. Yearly averages are also available.