 Catalogue PIGMA
Sea surface height
Type of resources
Available actions
Topics
Keywords
Contact for the resource
Provided by
Years
Formats
Representation types
Update frequencies
status
Resolution
-
This product integrates sea level observations aggregated and validated from the Regional EuroGOOS consortium (Arctic-ROOS, BOOS, NOOS, IBI-ROOS, MONGOOS) and Black Sea GOOS as well as from the Global telecommunication system (GTS) used by the Met Offices. The latest version of Copernicus delayed-mode Sea level product is also distributed from Copernicus Marine catalogue.
-
The CORE-II simulations provide a framework to evaluate ocean model performance, to study mechanisms of ocean phenomena and their variability from seasonal to decadal timescales, to identify forced variability changes, and to develop mechanistic descriptions of observed climate variability and change.
-
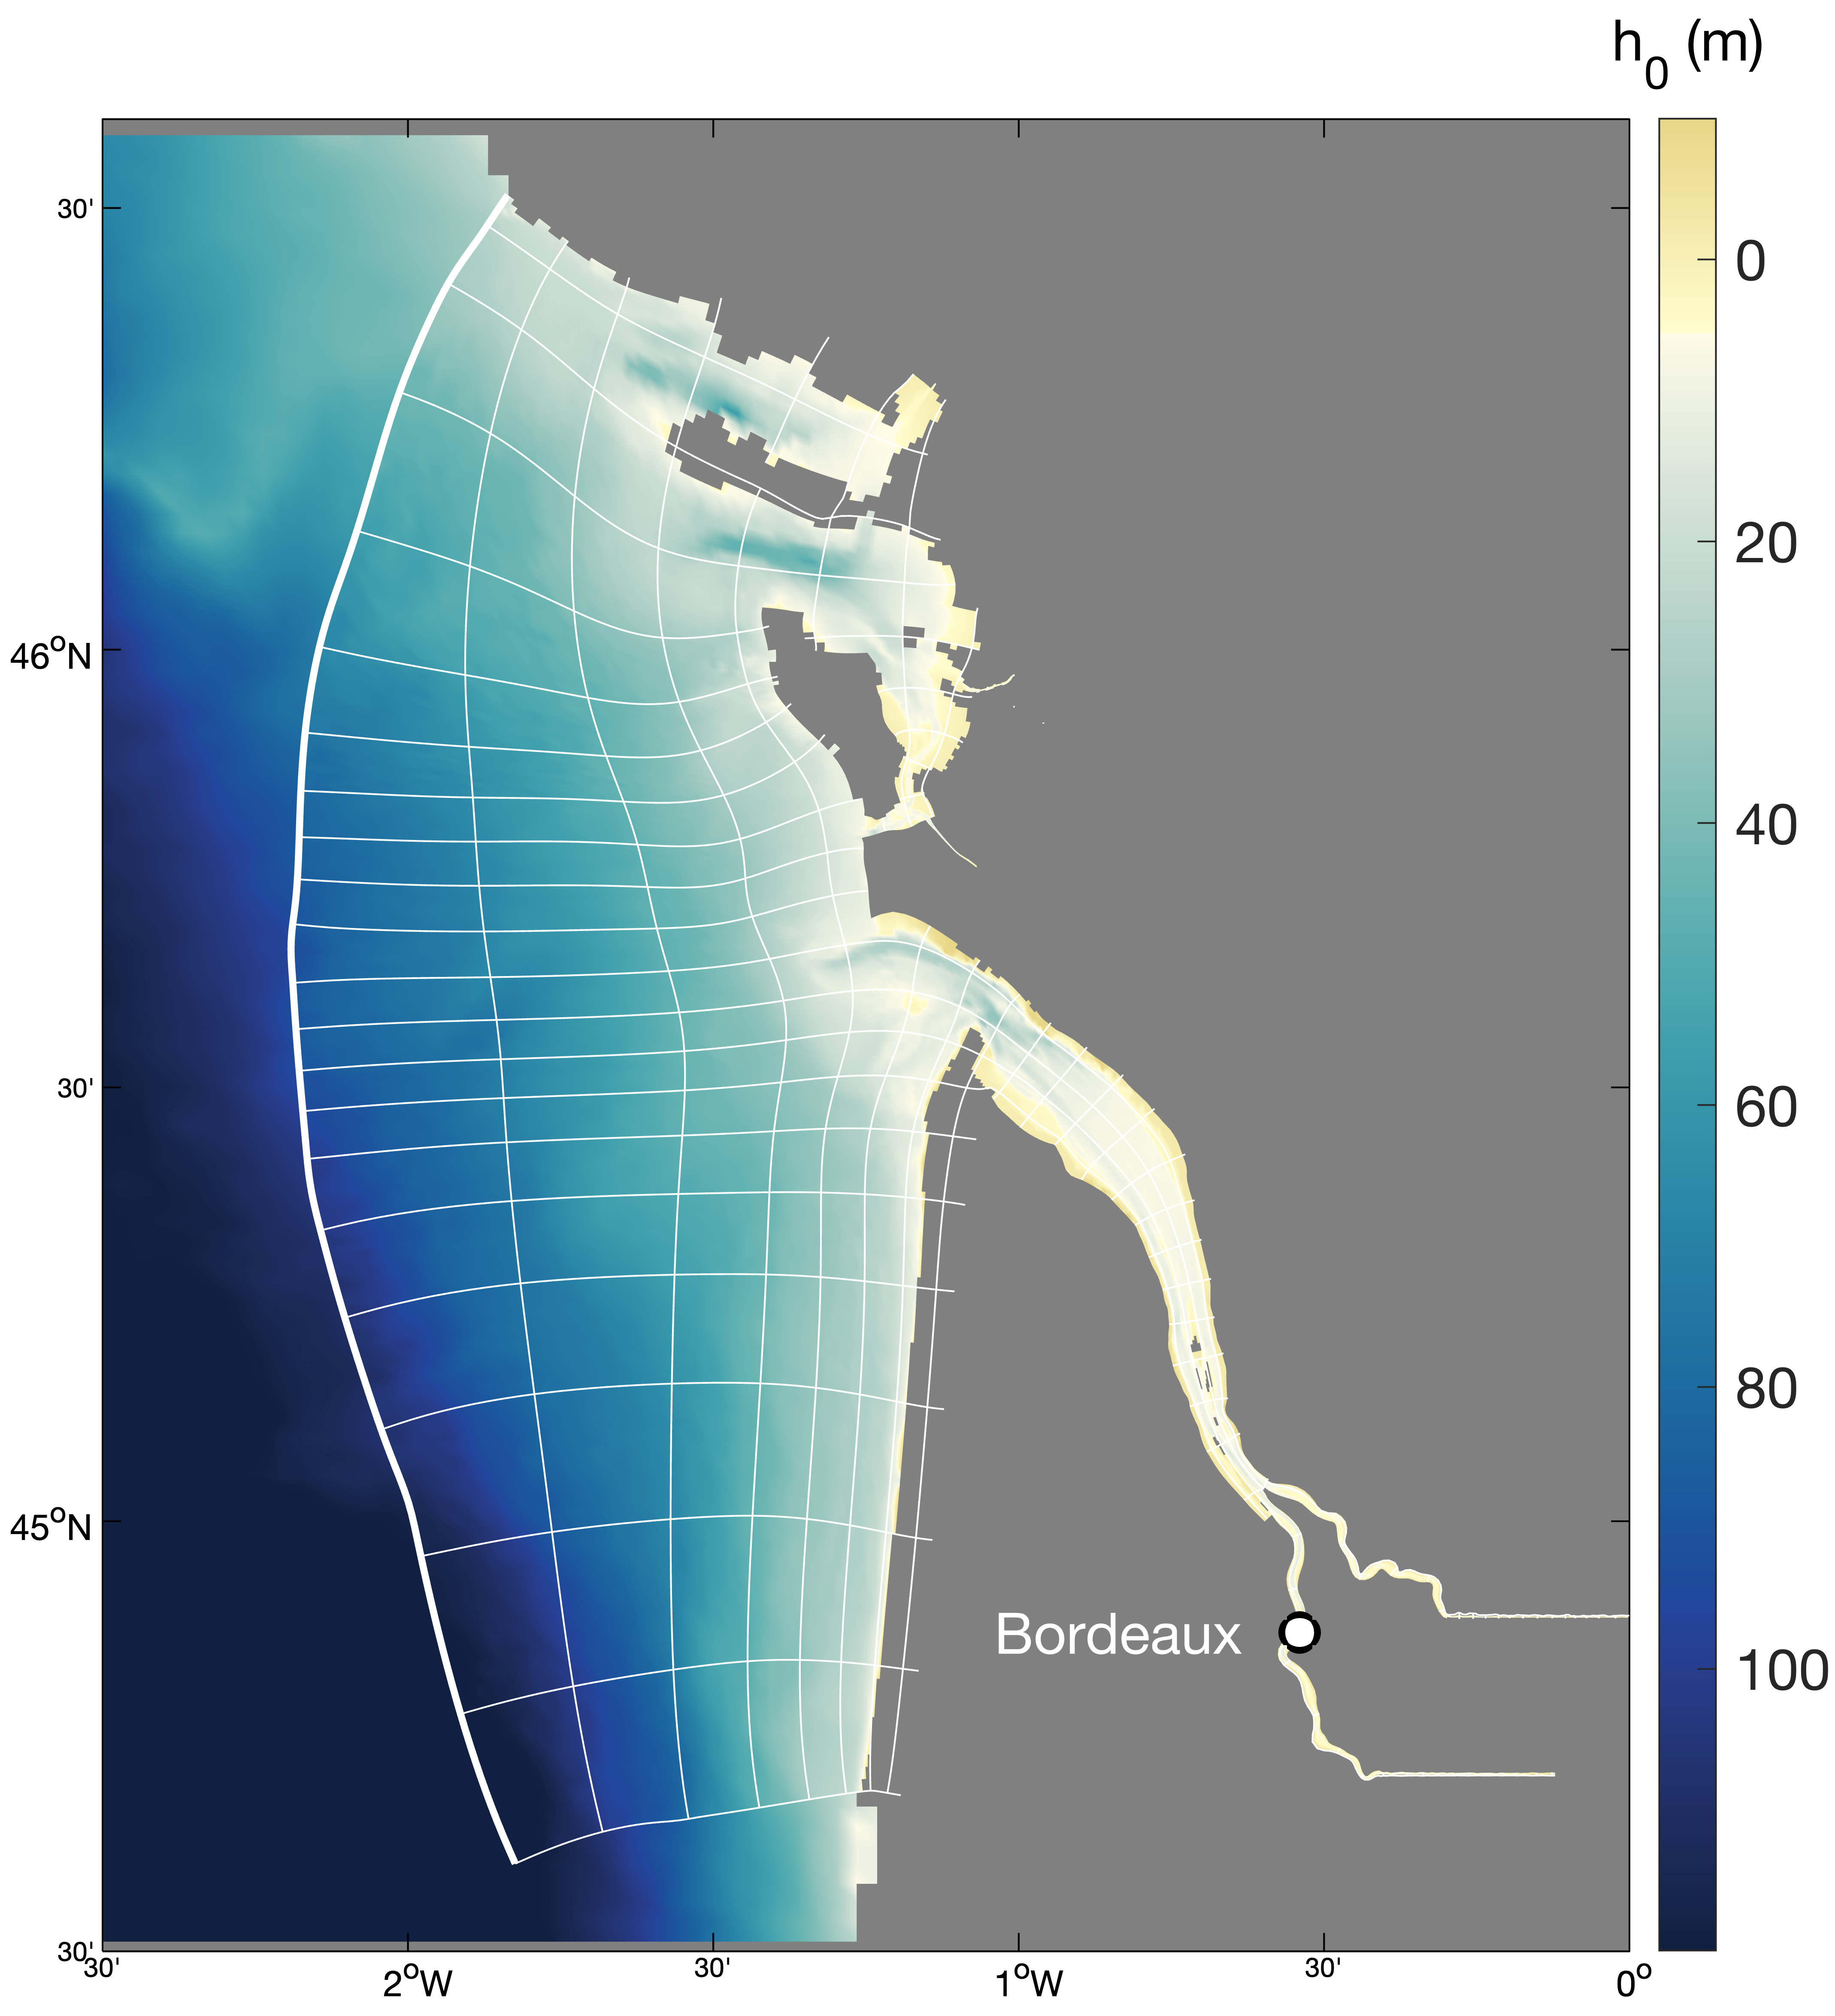
Hydrodynamics and sediment dynamics hindcast in the Gironde Estuary (France), produced by coupling the hydrodynamics model MARS3D (with sediment dynamics module MUSTANG) and wave spectral model WAVEWATCH III®.
-
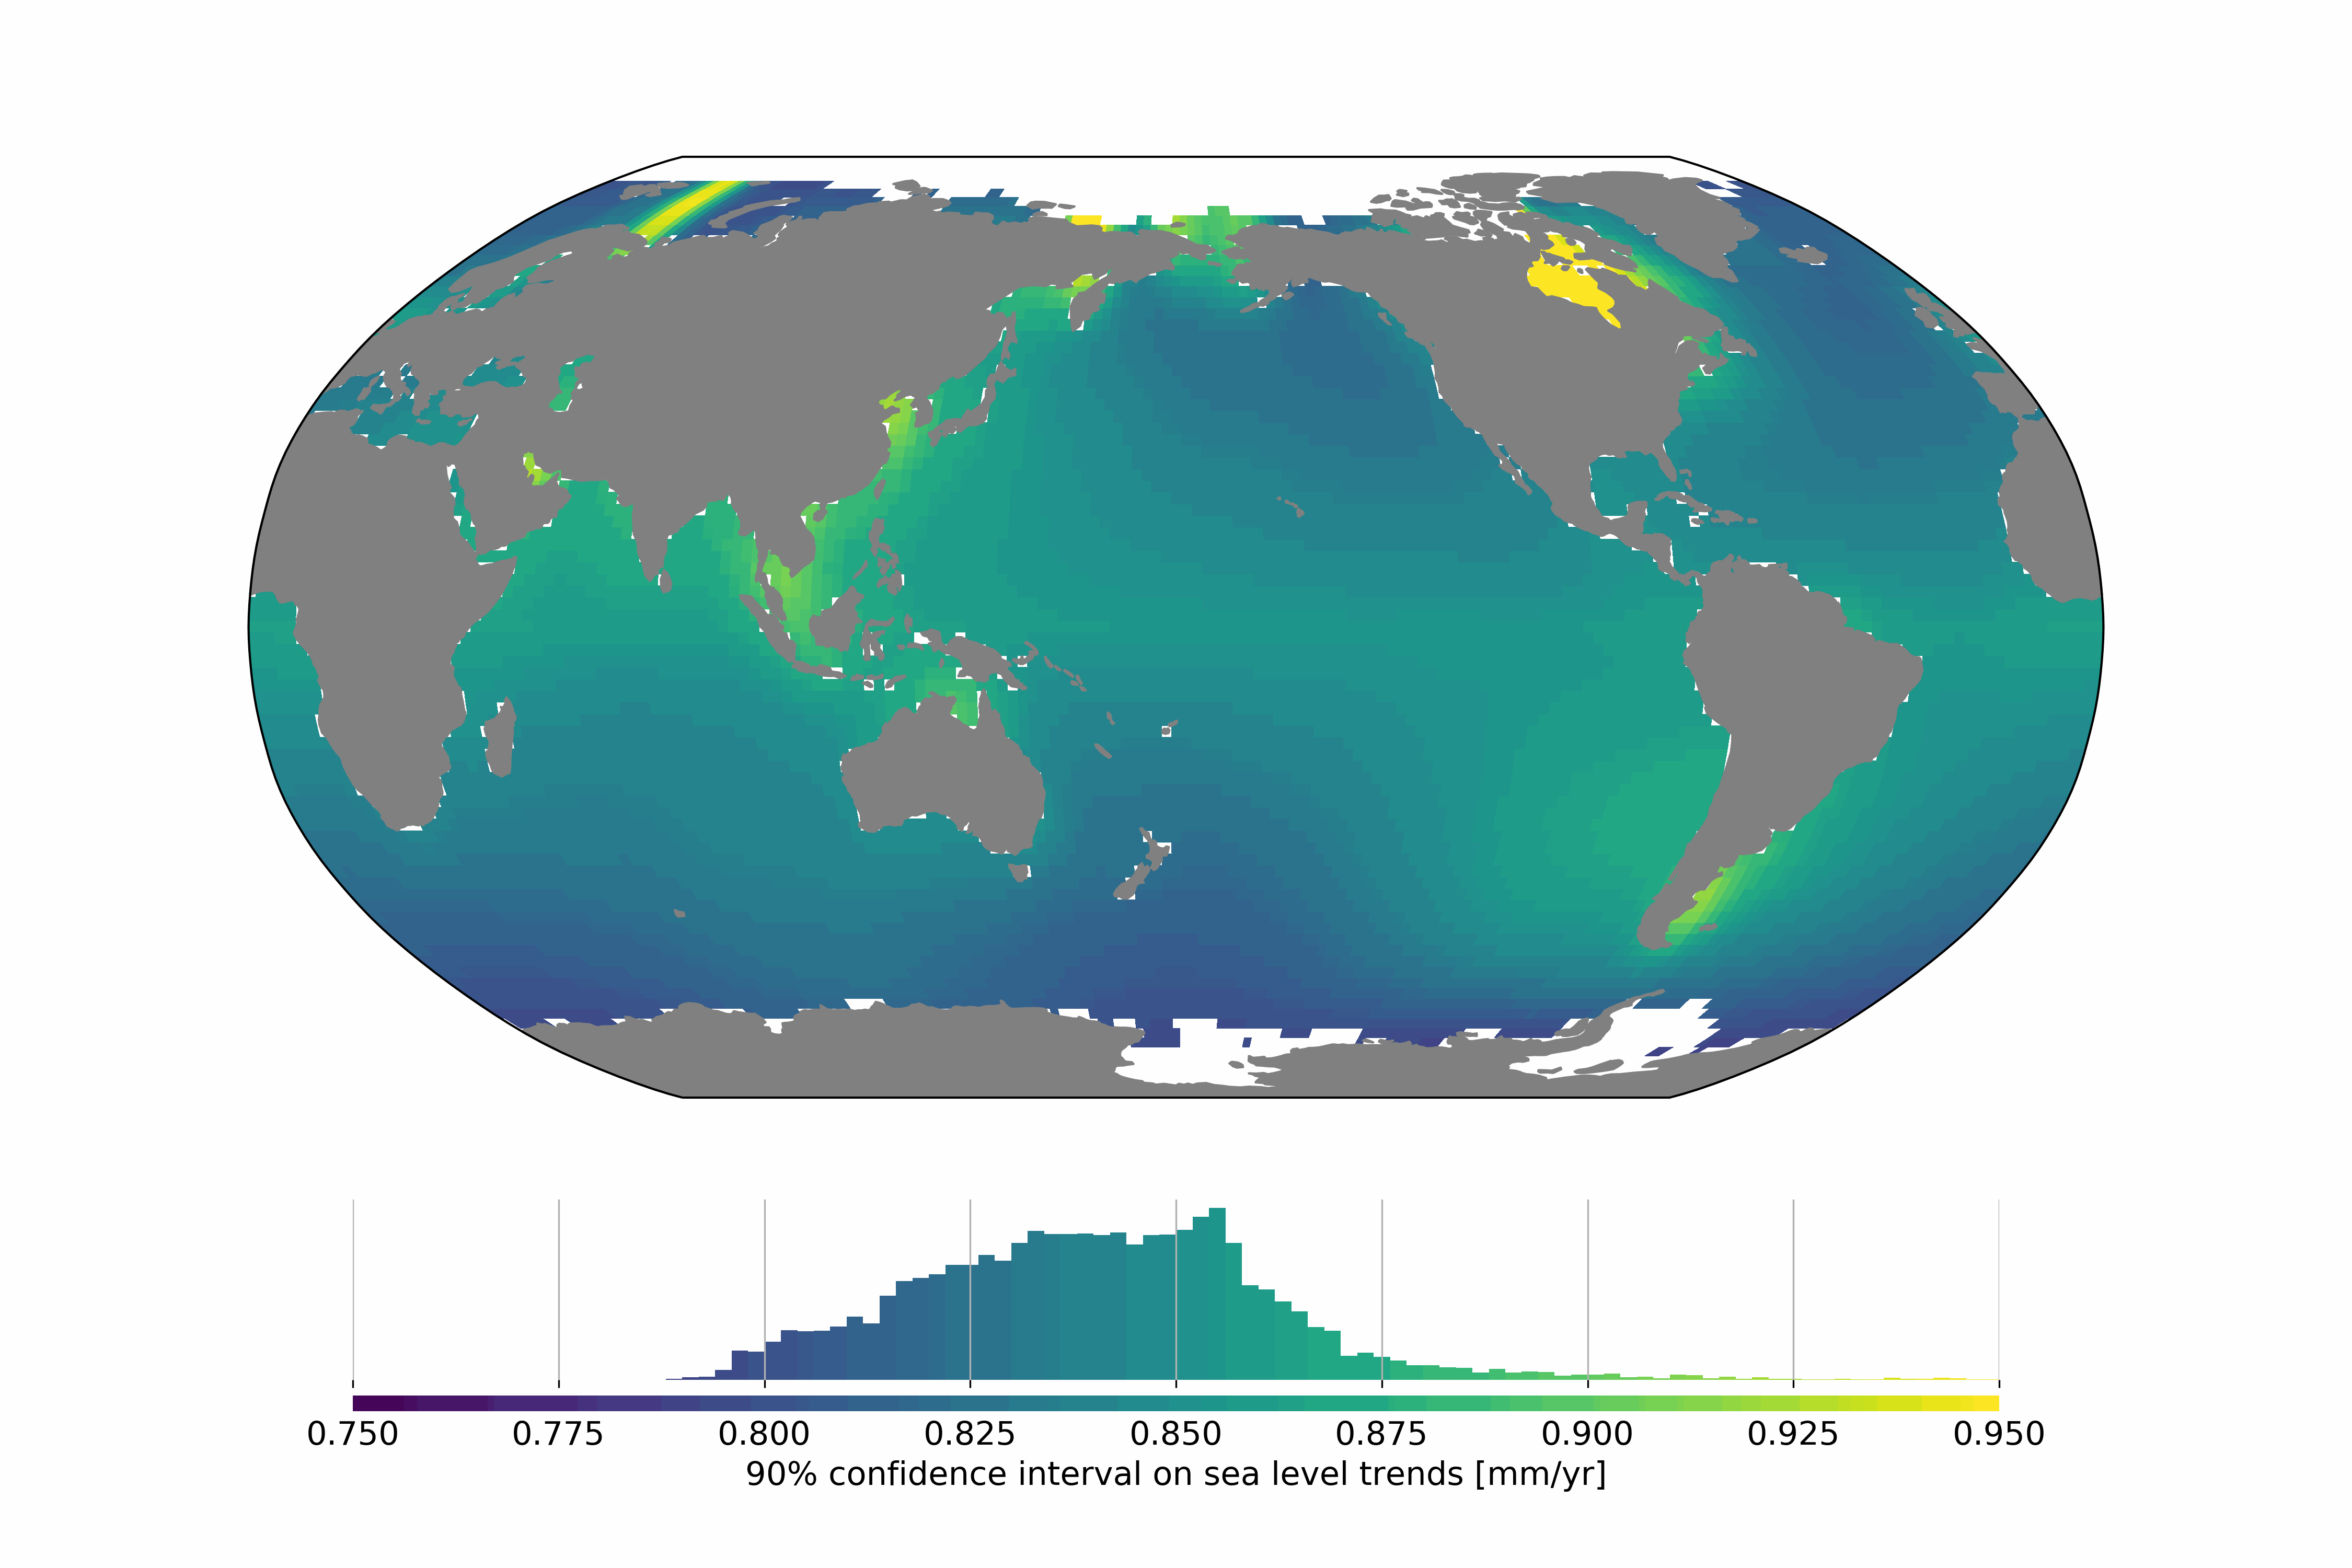
Satellite altimetry missions provide a quasi-global synoptic view of sea level over more than 25 years. The satellite altimetry constellation is used to build sea level maps and regional sea level indicators such as trends and accelerations. Estimating realistic uncertainties on these quantities is crucial to address some current climate science questions such as climate change detection and attribution or regional sea level budget closure for example. Previous studies have estimated the uncertainty for the global mean sea level (GMSL), but no uncertainty information is available at regional scales. In this study we estimate a regional satellite altimetry error budget and use it to derive maps of confidence intervals for local sea rise rates and accelerations. We analyze 27 years of satellite altimetry maps and derive the satellite altimetry error variance-covariance matrix at each grid point, prior to the estimation of confidence intervals on local trends and accelerations at the 90% confidence level using extended least squares estimators. Over 1993–2019, we find that the average local sea level trend uncertainty is 0.83 mm.yr-1 with local values ranging from 0.78 to 1.22 mm.yr-1. For accelerations, uncertainties range from 0.057 to 0.12 mm.yr-2, with a mean value of 0.063 mm.yr-2. Change history: - 2020/07/08: initial dataset submission over 1993-2018 - 2020/10/21: 1993-2019 update and addition of error levels
-

The CDR-derived Wet Tropospheric Correction (WTC) Product V2 is generated from the Level-2+ along-track altimetry products version 2024 (L2P 2024) distributed by AVISO+ (www.aviso.altimetry.fr). It provides a long-term, homogenized estimation of the wet tropospheric correction based on Climate Data Records (CDRs) of atmospheric water vapour combined with high frequencies MWR data. Two independent CDRs datasets are used: - REMSS V7R2 (coverage until 2022) https://www.remss.com/measurements/atmospheric-water-vapor/tpw-1-deg-product/ - HOAPS V5 precursor CDR from EUMETSAT CM SAF (coverage until 2020) HOAPS V4/V5 data available via https://wui.cmsaf.eu Note: the HOAPS V5 precursor is not yet an official CM SAF product; full validation and public release are pending. The MWR/CDR WTC V2 estimates is derived using spatially varying but temporally constant polynomial coefficients (ai). 1. WTC V2 – Along-track L2P Product Data format: The WTC V2 product is delivered in Level-2+ (L2P) format, along the satellite ground track. Each mission is distributed as a compressed archive (.tar.gz) containing one NetCDF4 CF-1.8 file per mission cycle. Archive naming convention: <mission>_WTC_from_WV_CDR_<version>.tar.gz mission: TP (TOPEX/Poseidon), J1, J2, J3 version: product version (currently V2) File naming convention inside archives: <mission>_C<cycle>.nc cycle: 4-digit cycle index (e.g., C0001) Each NetCDF file contains: 1/ Along-track WTC estimate; 2/ Ancillary information; 3/ Space–time coordinates 2. WTC CDR Uncertainties – Gridded Product: A complementary product is provided, delivering regional trend estimates and associated uncertainties from the WTC Climate Data Record. The uncertainty product is distributed as a single NetCDF4 file: wtc_trend_uncertainties.nc . This file contains global gridded fields of WTC CDR trend and uncertainty parameters. Product content: This is the first dedicated version providing both: WTC CDR (HOAPS) linear trends, and Uncertainty estimates on these trends. Uncertainties are expressed as 1-sigma confidence intervals, and propagated using the methodology described in Section 2.3 of the Product User Manual. The product includes: - Total uncertainty on the WTC trend, propagated from all identified uncertainty sources in the WTC–TCWV regression. - Individual contributions of uncertainty sources (Uncertainties on regression coefficients: a0, a1 and their standard deviations; Uncertainties inherited from the HOAPS TCWV CDR) These fields enable users to assess the relative importance of each uncertainty component and recompute uncertainty propagation with alternative methods. Included regression input variables: To ensure transparency and reproducibility, the product provides: 1/ regression coefficients a0, a1; 2/ their associated uncertainties (std of a0, std of a1); 3/additional diagnostic fields required to recompute uncertainties if needed.
-

Rapid changes in ocean circulation and climate have been observed in marine-sediment and ice cores over the last glacial period and deglaciation, highlighting the non-linear character of the climate system and underlining the possibility of rapid climate shifts in response to anthropogenic greenhouse gas forcing. To date, these rapid changes in climate and ocean circulation are still not fully explained. One obstacle hindering progress in our understanding of the interactions between past ocean circulation and climate changes is the difficulty of accurately dating marine cores. Here, we present a set of 92 marine sediment cores from the Atlantic Ocean for which we have established age-depth models that are consistent with the Greenland GICC05 ice core chronology, and computed the associated dating uncertainties, using a new deposition modeling technique. This is the first set of consistently dated marine sediment cores enabling paleoclimate scientists to evaluate leads/lags between circulation and climate changes over vast regions of the Atlantic Ocean. Moreover, this data set is of direct use in paleoclimate modeling studies.
-
Satellite altimeters routinely supply sea surface height (SSH) measurements which are key observations to monitor ocean dynamics. However, below a wavelength of about 70 km, along-track altimeter measurements are often characterized by a dramatic drop in the signal-to-noise ratio, making it very challenging to fully exploit available altimeter observations to precisely analyze small mesoscale variations in SSH. Although various approaches have been proposed and applied to identify and filter noise from measurements, no distinctive methodology emerged to be systematically applied in operational products. To best cope with this unresolved issue, the Copernicus Marine Environment Monitoring Service (CMEMS) actually provides simple band-pass filtered data to mitigate noise contamination in the along-track SSH signals and more innovative and adapted noise filtering methods are thus left to users seeking to unveil small-scale altimeter signals. Here demonstrated, a fully data-driven approach is developed and applied to provide robust estimates of noise-free Sea Level Anomaly (SLA) signals. The method combines Empirical Mode Decomposition (EMD), to help analyze non-stationary and non-linear processes, and an adaptive noise filtering technique inspired by Discrete Wavelet Transform (DWT) decompositions. It is now found to best resolve the distribution of the sea surface height variability in the mesoscale 30-120 km wavelength band. A practical uncertainty variable is attached to the denoised SLA estimates that accounts for errors related to the local signal to noise ratio, but also for uncertainties in the denoising process, which assumes that SLA variability results in part from a stochastic process. Here, measurements from the Jason-3, Sentinel-3 A and SARAL/AltiKa altimeters are processed and analyzed, and their energy spectral and seasonal distributions characterized in the small mesoscale domain. Anticipating data from the upcoming Surface Water and Ocean Topography (SWOT) mission, these denoised SLA measurements for three reference altimeter missions already yield valuable opportunities to assess global small mesoscale kinetic energy distributions. This dataset was developed within the Ocean Surface Topography Science Team (OSTST) activities. A grant was awarded to the SASSA (Satellite Altimeter Short-scale Signals Analysis) project by the TOSCA board in the framework of the CNES/EUMETSAT call CNES-DSP/OT 12-2118. Altimeter data were provided by the Copernicus Marine Environment Monitoring Service (CMEMS) and by the Sea State Climate Change Initiative (CCI) project.
-

These gridded products are produced from the following upstream data: - for satellites SARAL/AltiKa, Cryosat-2, HaiYang-2B, Jason-3, Copernicus Sentinel-3A/B, Sentinel-6 MF, SWOT Nadir => NRT (Near-Real-Time) Nadir along-track (or Level-3) SEA LEVEL products (DOI: https://doi.org/10.48670/moi-00147) delivered by the Copernicus Marine Service (http://marine.copernicus.eu/ ). The gridded product is based on near-real-time (NRT) Level-3 Nadir datasets for the period from July 7, 2025, to December 31, 2025. => MY (Multi-Year) Nadir along-track (or Level-3) SEA LEVEL products (DOI: https://doi.org/10.48670/moi-00146 ) delivered by the Copernicus Marine Service (CMEMS, http://marine.copernicus.eu/ ). The gridded product is based on MY Level-3 Nadir datasets for the period from March 28, 2023, to July 6, 2025. - for SWOT KaRIn : the L3_LR_SSH Expert v3.0 product distributed by AVISO (DOI: https://doi.org/10.24400/527896/A01-2023.018) from March 28, 2023 to December 31, 2025. One mapping algorithm is proposed: the MIOST approach which provides which provides global Sea Surface Height (SSH) solutions. The MIOST method is capable of accounting for various modes of ocean surface topography variability (e.g., geostrophic, barotropic, equatorial wave dynamics) by constructing multiple independent components within a predefined covariance model.
-

This dataset contains the dynamical outputs of a global ocean simulation coupling dynamics and biogeochemistry at ¼° over the year 2019. The simulation has been performed using the coupled circulation/ecosystem model NEMO/PISCES (https://www.nemo-ocean.eu/), which is here enhanced to perform an ensemble simulation with explicit simulation of modeling uncertainties in the physics and in the biogeochemistry. This dataset is one of the 40 members of the ensemble simulation. This study was part of the Horizon Europe project SEAMLESS (https://seamlessproject.org/Home.html), with the general objective of improving the analysis and forecast of ecosystem indicators. See Popov et al. (https://os.copernicus.org/articles/20/155/2024/) for more details on the study.
-
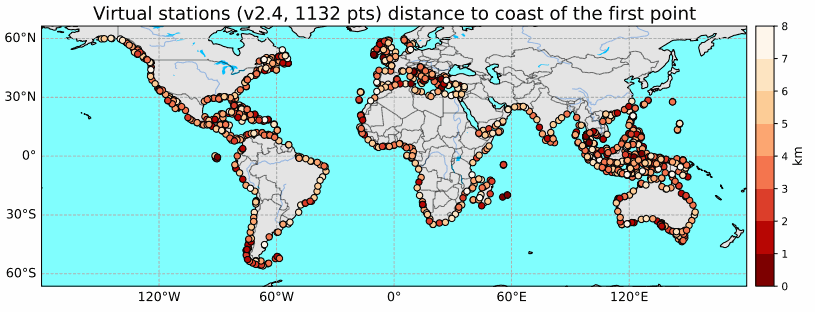
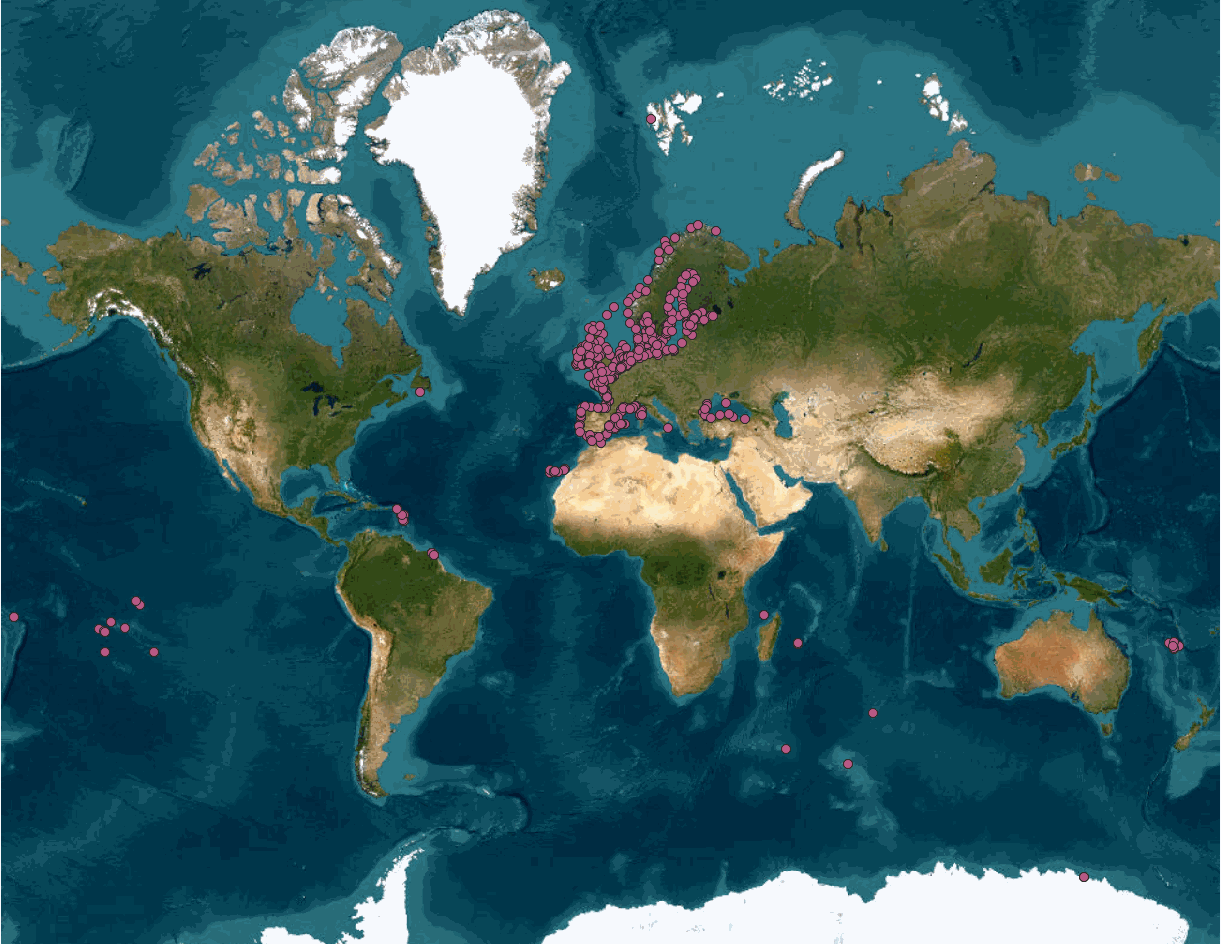
Until recently, classical radar altimetry could not provide reliable sea level data within 10 km to the coast. However dedicated reprocessing of radar waveform together with geophysical corrections adapted for the coastal regions now allows to fill this gap at a large number of coastal sites. In the context of the Climate Change Initiative Sea Level project of the European Space Agency, we have recently performed a complete reprocessing of high resolution (20 Hz, i.e., 350m) along-track altimetry data of the Jason-1, Jason-2 and Jason-3 missions over January 2002 to June 2021 along the coastal zones of Northeast Atlantic, Mediterranean Sea, whole African continent, North Indian Ocean, Southeast Asia, Australia and North and South America. This reprocessing has provided valid sea level data in the 0-20 km band from the coast. More than 1000 altimetry-based virtual coastal stations have been selected and sea level anomalies time series together with associated coastal sea level trends have been computed over the study time span. In the coastal regions devoid from tide gauges (e.g., African coastlines), these virtual stations offer a unique tool for estimating sea level change close to the coast (typically up to 3 km to the coast but in many instances up to 1 km or even closer). Results show that at most of the virtual stations, the rate of sea level rise at the coast is similar to the rate offshore (15 km away from the coast). However, at some stations, the sea level rate in the last 3-4 km to the coast is either faster or slower than offshore.