 Catalogue PIGMA
Temperature
Type of resources
Available actions
Topics
Keywords
Contact for the resource
Provided by
Years
Formats
Representation types
Update frequencies
status
Scale
-
.jpg)
The Sir Alister Hardy Foundation for Ocean Science (SAHFOS) is an international charity that operates the Continuous Plankton Recorder (CPR) Survey. The dataset covers the North Atlantic and the North Sea on since 1958.
-
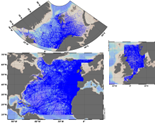
The SeaDataNet aggregated datasets over the Atlantic Ocean are regional ODV historical collections of all temperature and salinity measurements contained within SeaDataNet database and covering 3 European sea basins: North Arctic Ocean, North Sea, North Atlantic Ocean. Two versions have been published during SeaDataNet 2 and they represent a snapshot of the SeaDataNet database content at two different times: • V1.1 January 2014 • V2 March 2015 Each of them is the result of the Quality Check Strategy (QCS) implemented during SeaDataNet 2 that contributed to highly improve the quality of temperature and salinity data. The QCS is made by four main phases: 1. data harvesting from the central CDI 2. file and parameter aggregation 3. quality check analysis at regional level 4. analysis and correction of data anomalies. The aggregated datasets have been prepared and quality checked using ODV software.
-
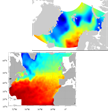
SeaDataNet gridded climatologies are based on the SeaDataNet Temperature and Salinity historical data collection v1.1. For the Atlantic Ocean there are covering 2 European sea basins: North Arctic Ocean, and North Atlantic Ocean The preparation of the products has also improved the quality, the consistency and the overall coherence of the data made available by SeaDataNet. They have been computed using DIVA software.
-
GLODAP is an internally consistent data product for interior ocean “carbon relevant” variables, but in practice this means “everything that is measured from water samples” taken on hydrographic cruises that takes measurements of biogeochemistry, including inorganic carbon measurements. GLODAP was first published in 2004, and a new massively increased version, GLODAPv2, was published in 2016. A new version – GLODAPv2.2018 – will be published in early 2019. GLODAP have three main products: 1) A collection of individual cruise file in a consistent format and 1st level QC, 2) A product that has been bias corrected through 2nd level QC procedures, and 3) an interpolated product on a regular grid.
-
Data from FerryBoxes on ships of opportunity going on permanent routes are stored inside this database (ferrydata.hzg.de). Parameters are temperature, salinity, chlorophyll-a fluorescence, oxygen and different others. The data model is transect oriented. A data portal to access and visualise the data is also provided.
-
The EuroMapApp task of the AtlantOS project aims to integrate Europe’s existing and future bathymetric data sets from the Atlantic Ocean into a seamless whole and put these results into a widely accessible format allowing immediate visualization of the seafloor for the specialist and non-specialist user alike. The partner institutions are GEOMAR, Ifremer, NIOZ, and NERC-BODC.
-
VOS/SOOP tracks are usually repeated several times a year and inform about the marine sinks and sources of atmospheric carbon dioxide on a global bases and their variability. Data from this network has been made available to the scientific community and interested public via the Carbon Dioxide Information Analysis Centre (CDIAC) Oceans at the Department of Energy, USA, since the early 1990’s where PIs submitted and shared their data. In 2017, CDIAC Ocean will be named Ocean Carbon Data System (OCADS) and join NOAA’s National Centers for Environmental Information (NCEI). In 2007, the marine biogeochemistry community coordinated by the International Ocean Carbon Coordination Project (IOCCP), launched the Surface Ocean Carbon Dioxide ATlas (SOCAT) in order to uniformly quality control and format the data with detailed documentation. Underway carbon dioxide data from the VOS network are integrated in SOCAT.
-
In order to assess the connectivity oceanographic data will be used. A shape map will be created combining data on MPAs adequacy and distribution of MPAs and temperature, currents seasonal GIS layers (The temperature and currents are INGV climatological products made available to CH2.
-
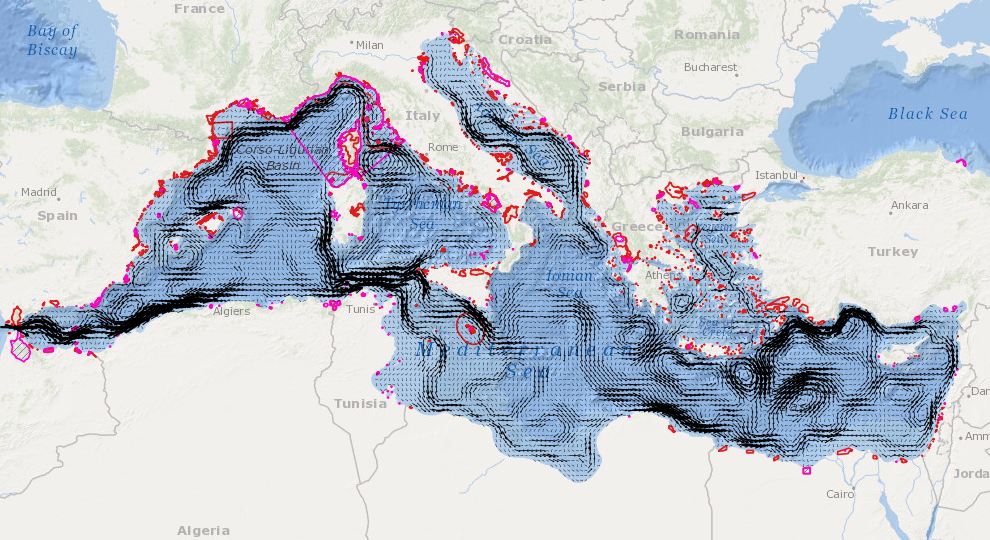
The Surface Ocean CO₂ Atlas (SOCAT) is a synthesis activity for quality-controlled, surface ocean fCO₂ (fugacity of carbon dioxide) observations by the international marine carbon research community (>100 contributors). SOCAT data is publicly available, discoverable and citable. SOCAT enables quantification of the ocean carbon sink and ocean acidification and evaluation of ocean biogeochemical models. SOCAT represents a milestone in biogeochemical and climate research and in informing policy. SOCAT data are released in versions. Each succeeding version contains new data sets as well as updates of older ones. The first version of SOCAT was released in 2011, the second and third version followed biennially. Automation allowed annual public releases since version 4. The latest SOCAT version (version 5) has 21.5 million observations from 1957 to 2017 for the global oceans and coastal seas. SOCAT contains data from the VOS, OceanSites network and mooring, buoy data in general as well as calibrated sensor data.
-
The SAPERCHAIS program (Suivi des Apports marins et terrigènes dans la mer des PERtuis CHarentAIS) was developed to monitor environmental fluctuations in the Pertuis Charentais Sea by an hydrological watchfulness. Seven stations, representatives of terrigenous or marine inputs, have been followed from 2011 to 2014. From north to south, the main four rivers of the Pertuis, Le Lay, La Sèvre, Charente and Seudre, and the three maritime inputs of each strait, Breton, Antioche and Maumusson. At each station, temperature and salinity were recorded in situ, just below the surface, with a high frequency resolution (10 minutes) . This work was supported by grants from Région Poitou-Charentes and European Regional Development Fund to the Ifremer "Developpement Durable de la Pêche et de la Conchyliculture" project.