 Catalogue PIGMA
2016
Type of resources
Available actions
Topics
Keywords
Contact for the resource
Provided by
Years
Formats
Representation types
Update frequencies
status
Scale
Resolution
-

Data from FerryBoxes on ships of opportunity going on permanent routes are stored inside this database (ferrydata.hzg.de). Parameters are temperature, salinity, chlorophyll-a fluorescence, oxygen and different others. The data model is transect oriented. A data portal to access and visualise the data is also provided.
-
Description of spatial layers attributes of sea-level trend (units: mm/year) from tide gauges over periods of 50 years (1963-2012) and 100 years (1913-2012), to characterize and assess average annual sea-level rise at the coast.
-

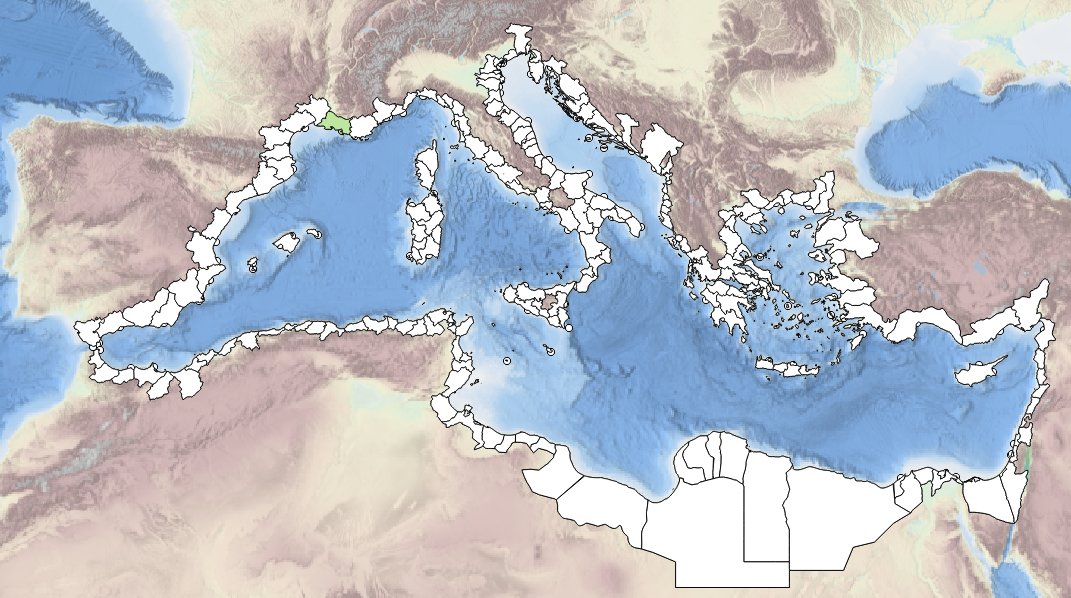
The objective of this tender is to examine the current data collection, observation and data assembly programmes in the Meditterranean Sea, identify gaps and to evaluate how they can be optimised.
-
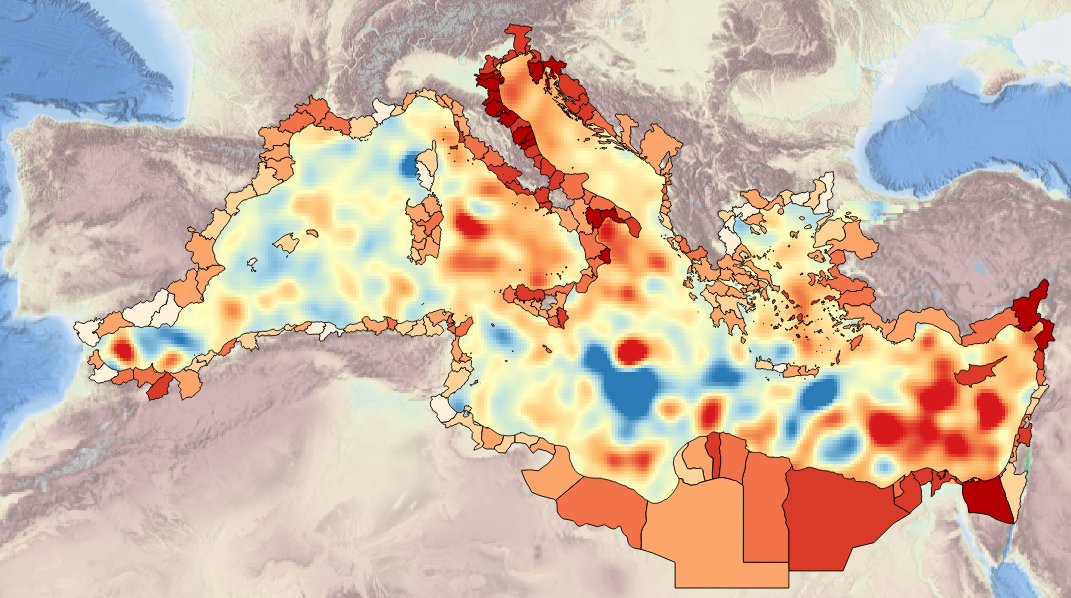
Description ot the spatial layers attributes of sea level trend for the last 10 years for the Mediterranean basin and for each NUTS3 region along the coast.
-

GO-SHIP, the Global Ocean Ship-Based Hydrographic Investigations Program, is conducting repeat hydrography with high accuracy high precision reference measurements of a variety of EOVs through the whole water column. A selection of continent-to-continent full depth sections are repeated at roughly decadal intervals. The data archive for CTD data and bottle data is currently at CCHDO, although the CTD data from European cruises are available at Seadatanet as well.
-
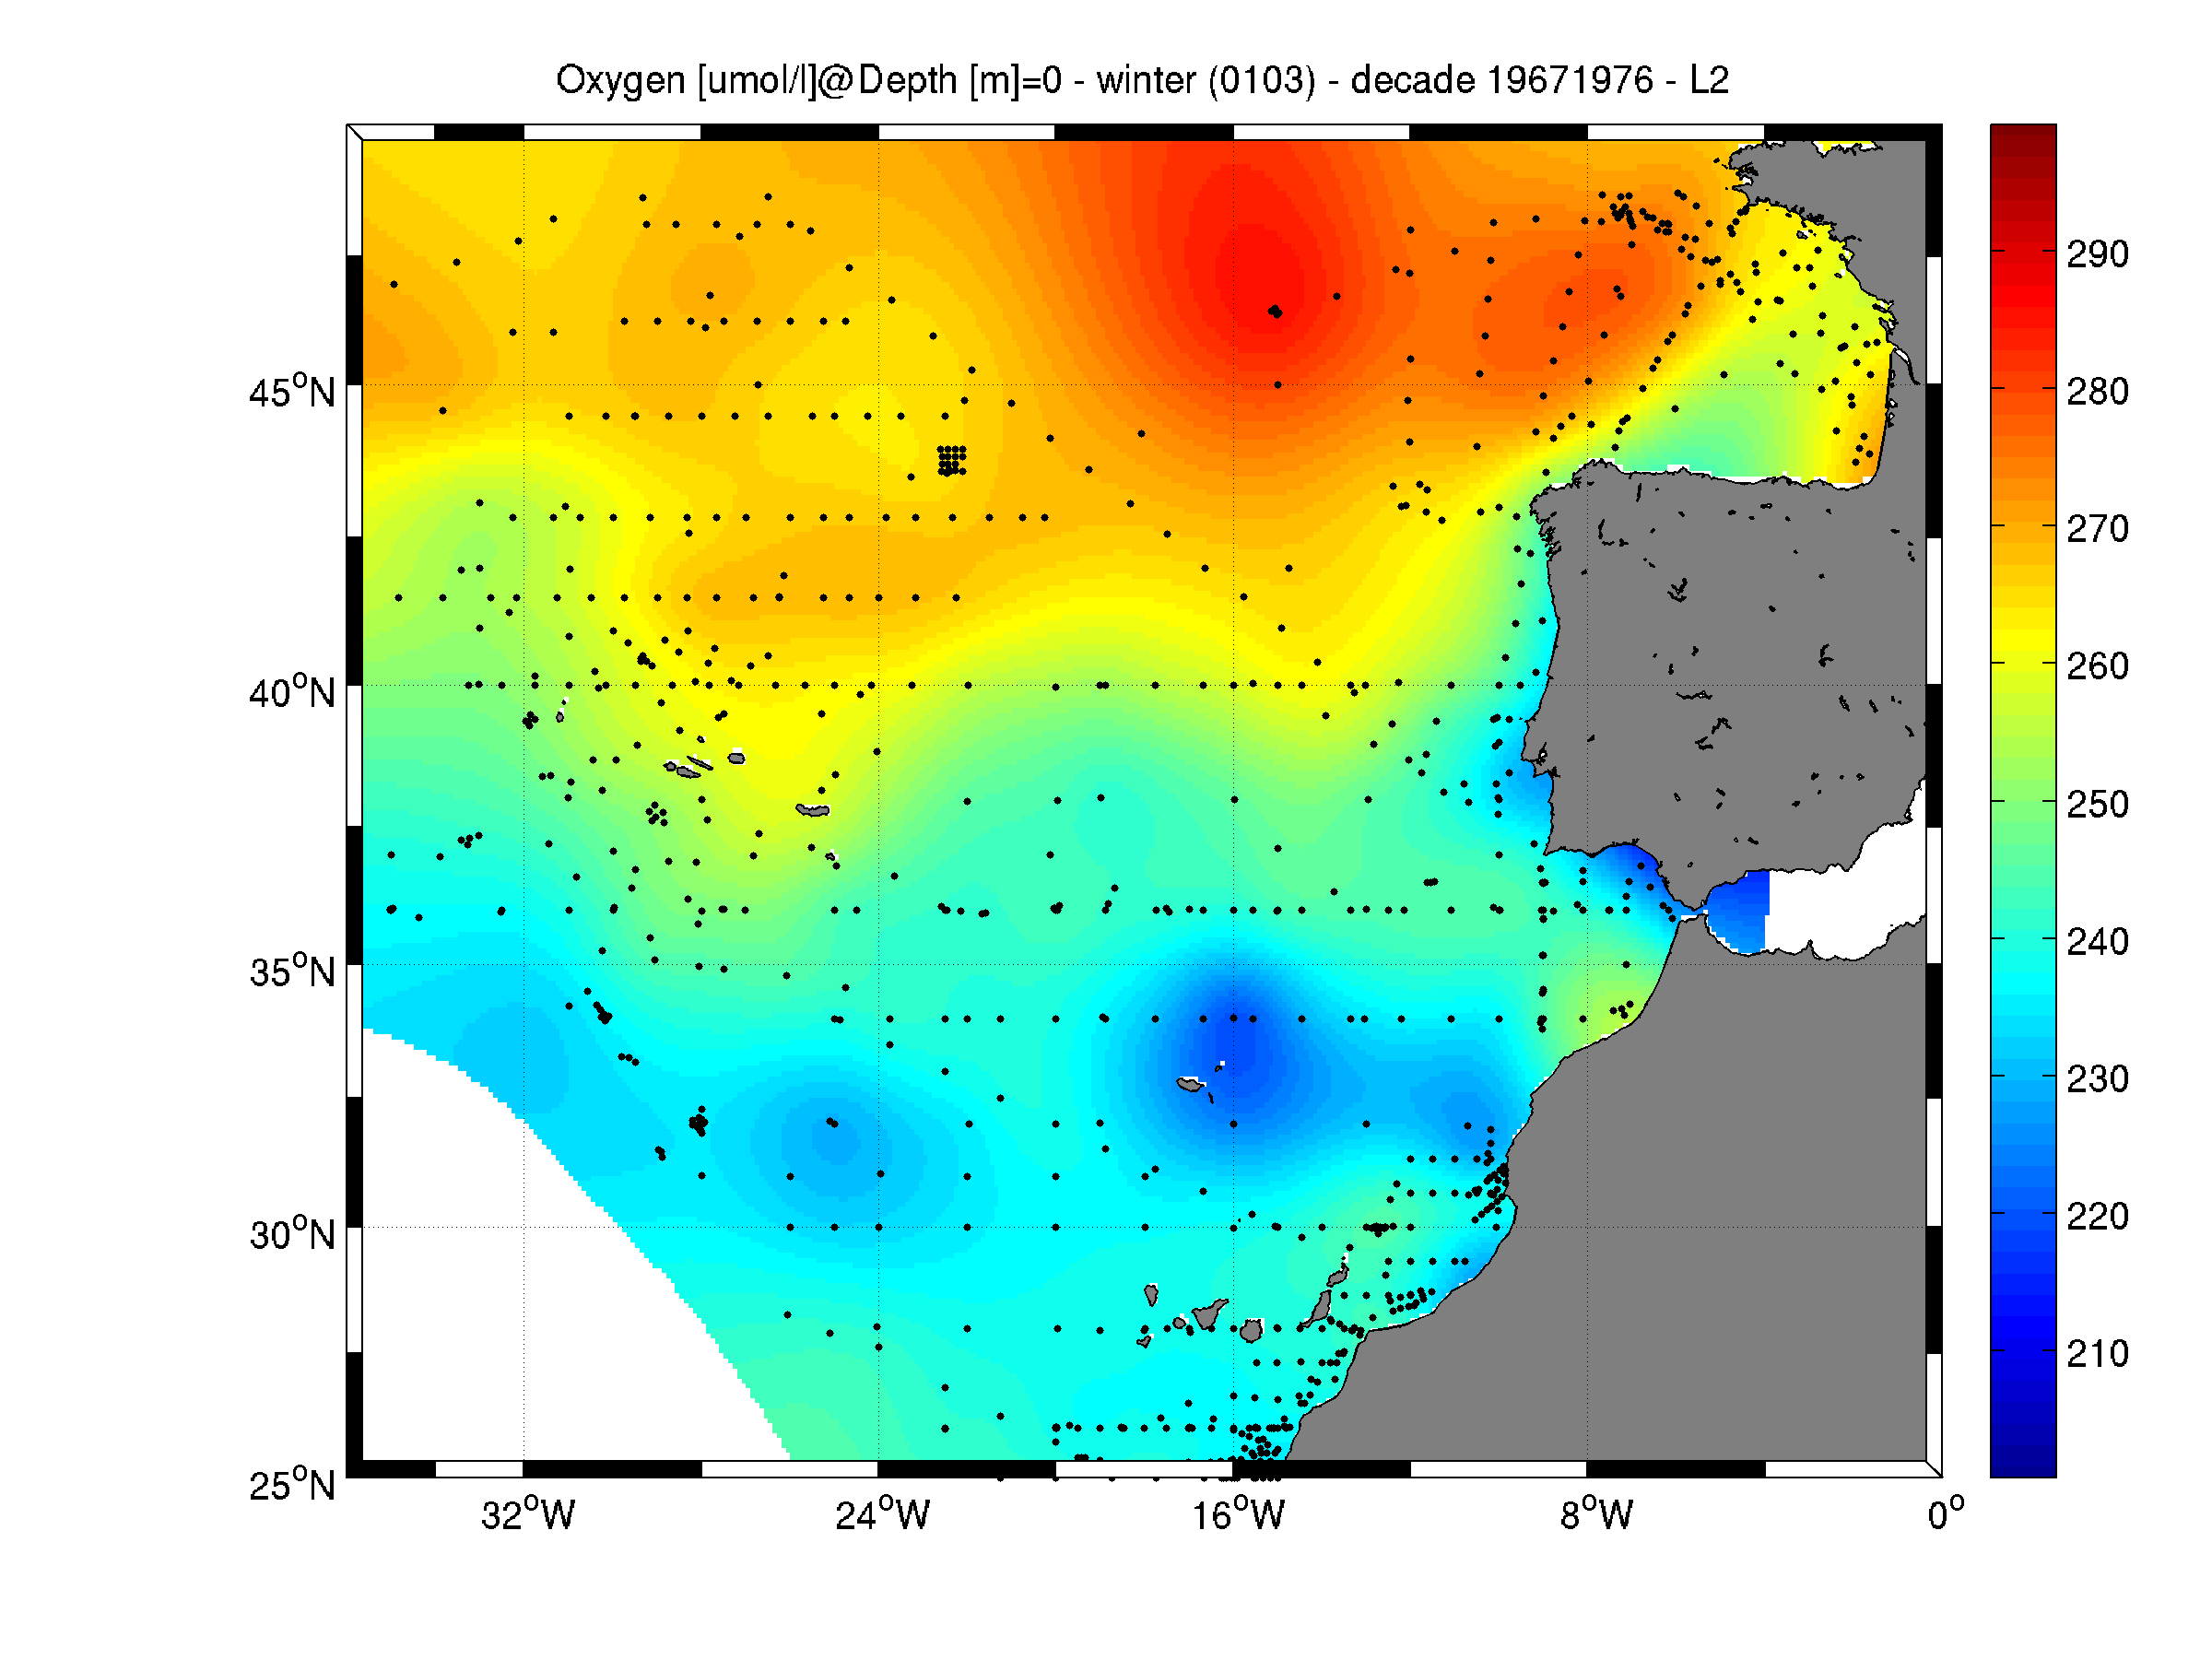
Moving 10-years analysis of Oxygen at Northeast Atlantic Ocean for each season: - winter: January-March, - spring: April-June, - summer: July-September, - autumn: October-December. Every year of the time dimension corresponds to the 10-year centred average of each season. Decades span from 1963-1972 until 2005-2014. Observational data span from 1963 to 2014. Depth range (IODE standard depths): -3000.0, -2500.0, -2000.0, -1750, -1500.0, -1400.0, -1300.0, -1200.0, -1100.0, -1000.0, -900.0, -800.0, -700.0, -600.0, -500.0, -400.0, -300.0, -250.0, -200.0, -150.0, -125.0, -100.0, -75.0, -50.0,-40.0, -30.0, -20.0, -10.0, -5.0, -0.0 Data Sources: observational data from SeaDataNet/EMODNet Chemistry Data Network. Description of DIVA analysis: Geostatistical data analysis by DIVA (Data-Interpolating Variational Analysis) tool. GEBCO 1min topography is used for the contouring preparation. Analyzed filed masked using relative error threshold 0.3 and 0.5 DIVA settings. Signal to noise ratio and correlation length were optimized and filtered vertically and a seasonally-averaged profile was used. Background field: the data mean value is subtracted from the data. Detrending of data: no, Advection consraint applied: no. Units: umol/l
-
Specification of the desirable and recommended product attributes for generating time series of average annual sea temperature at mid-water and sea bottom for the last 10 yrs.
-
Specification of the desirable and recommended product attributes for generating time series of average annual sea-level rise for the last 50 and 100 yrs.
-
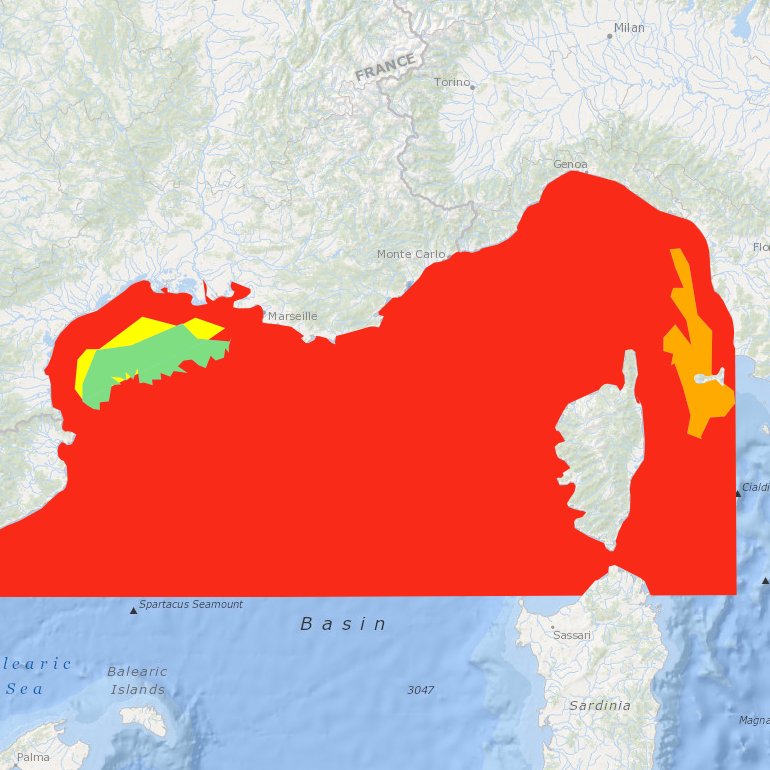
Suitability index of a wind farm in the NWMed concerning the environmental resources, the natural barriers, human activities, MPA and fisheries.
-
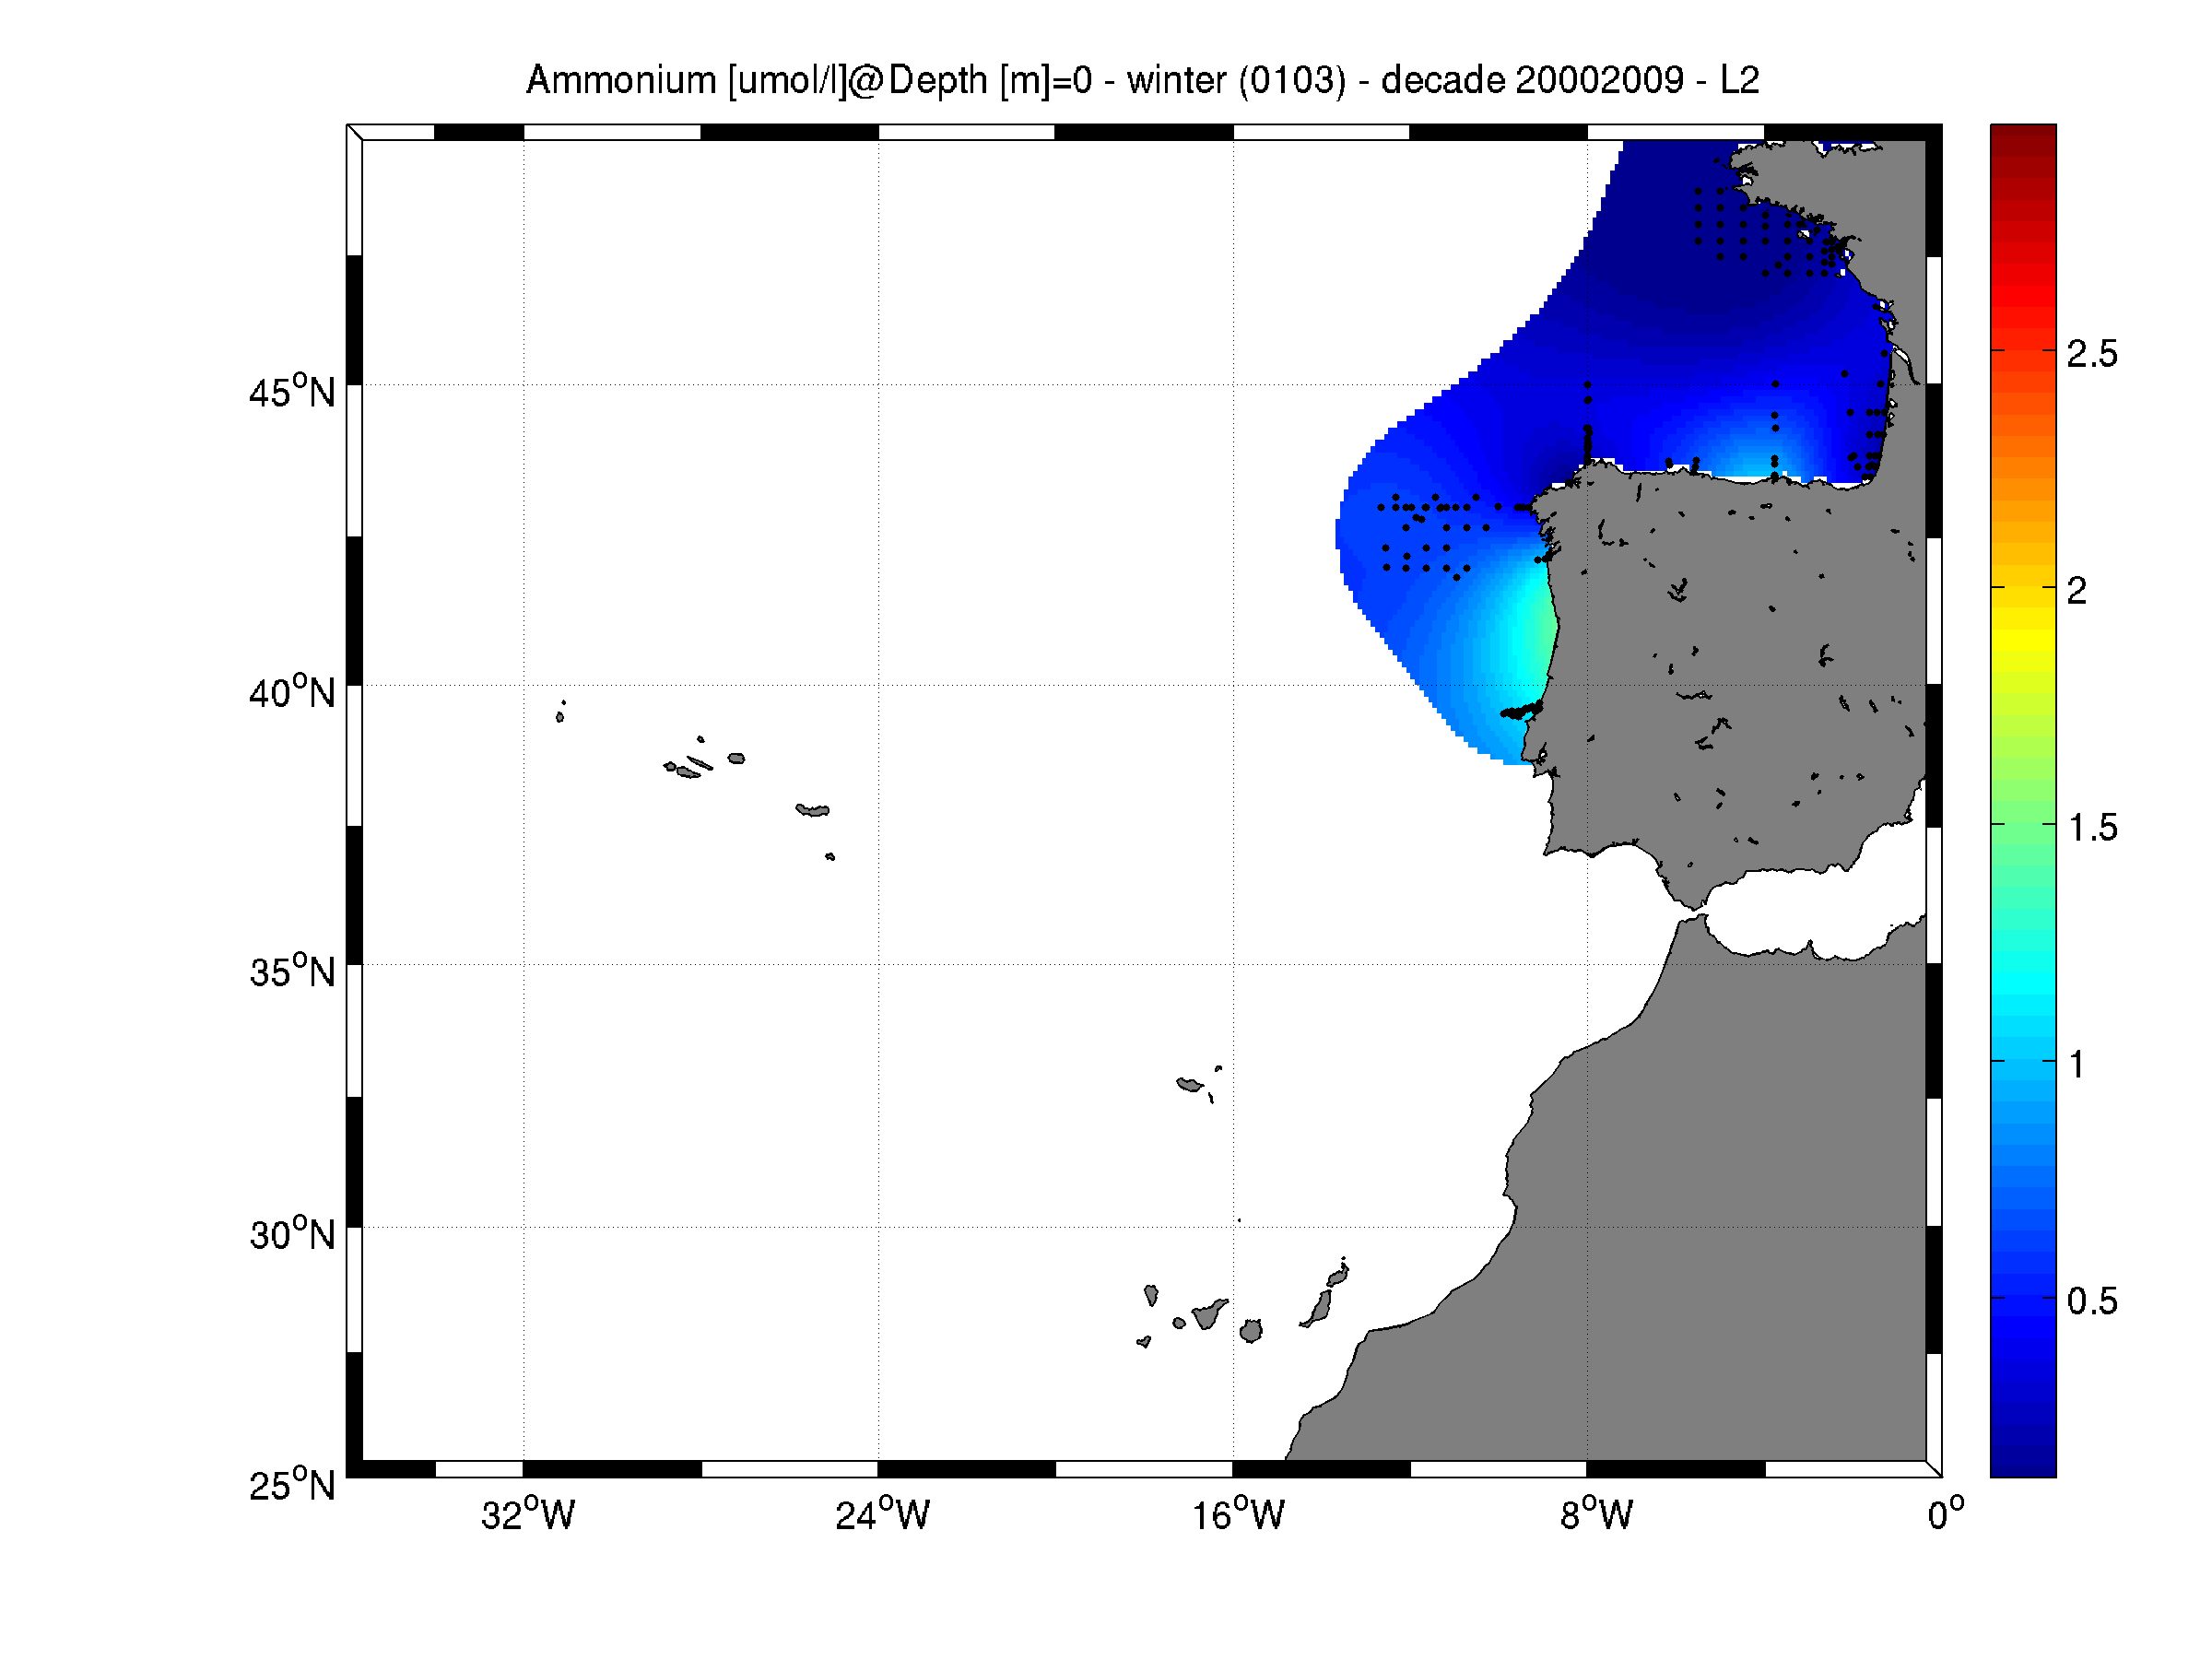
Moving 10-years analysis of Ammonium at Northeast Atlantic Ocean for each season: - winter: January-March, - spring: April-June, - summer: July-September, - autumn: October-December. Every year of the time dimension corresponds to the 10-year centred average of each season. Decades span : - from 1984-1993 until 2005-2014 (winter) - from 1980-1989 until 2005-2014 (spring) - from 1980-1989 until 2005-2014 (summer) - from 1980-1989 until 2005-2014 (autumn) Observational data span from 1962 to 2014. Depth range (IODE standard depths): -3000.0, -2500.0, -2000.0, -1750, -1500.0, -1400.0, -1300.0, -1200.0, -1100.0, -1000.0, -900.0, -800.0, -700.0, -600.0, -500.0, -400.0, -300.0, -250.0, -200.0, -150.0, -125.0, -100.0, -75.0, -50.0,-40.0, -30.0, -20.0, -10.0, -5.0, -0.0 Data Sources: observational data from SeaDataNet/EMODNet Chemistry Data Network. Description of DIVA analysis: Geostatistical data analysis by DIVA (Data-Interpolating Variational Analysis) tool. GEBCO 1min topography is used for the contouring preparation. Analyzed filed masked using relative error threshold 0.3 and 0.5 DIVA settings. Signal to noise ratio and correlation length were optimized and filtered vertically and a seasonally-averaged profile was used. Logarithmic transformation applied to the data prior to the analysis. Background field: the data mean value is subtracted from the data. Detrending of data: no, Advection constraint applied: no. Units: umol/l