 Catalogue PIGMA
Aggregate data
Type of resources
Available actions
Topics
Keywords
Contact for the resource
Provided by
Years
Formats
Representation types
Update frequencies
status
Scale
Resolution
-
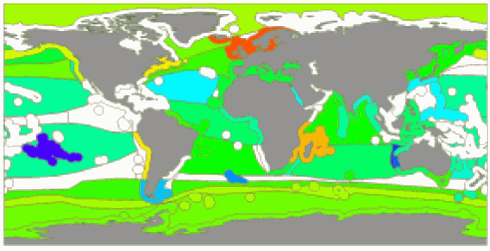
1) Demographic traits These data are published data of age-specific mortality rates, age-specific lengths or weights, length and age at maturity, fecundity-length relationships, and egg size for 84 populations from 49 species of primarily commercial teleost fishes. The populations included are those for which all the life history traits under study have been estimated over a period shorter than 10 years. Traits were estimated from within the ten year window or averaged across it when data were available. Only studies in which reference population, sample size, techniques used for ageing fish and counting eggs, and models used for estimating mortality were reported are included. When only a size or age range was available, the midpoint between the extreme values was used. Raw data were converted into seven demographic traits: - Time-to-5%-survival (T.05): the time elapsed from sexual maturity until 95% of a cohort is dead. T.05 fwas estimated from an exponential mortality model, based on total mortality coefficients estimated by Virtual Population Analysis (age-structured model) in most cases or cohort analysis or catch curves. - Length-at-5%-survival (L.05). In fishes, adult size is difficult to measure because of their indeterminate growth. Adult size reported here is length at time-to-5%-survival. - Age at sexual maturity (Tm): median age at maturity was estimated directly from the data or by fitting a logistic curve to age-specific proportion mature data. When only an age range was available, the midpoint between minimum and maximum is reported. - Length at sexual maturity (Lm): median length at maturity was estimated as age at maturity. - Slope of the fecundity-length relationship (Fb): fish fecundity, defined as the number of eggs present in the ovaries immediately before spawning, is known to increase intraspecifically with the size of females. This increase is usually described by a power-law F = aLb. The exponent of this relationship, b (slope of the log-log fecundity-length regression), accounts for the increase in fecundity with size. - Fecundity at maturity (Fm): fecundity in the year of maturity was estimated from length at maturity, the fecundity-length relationship and the number of spawning bouts per year for batch spawners. - Egg volume (Egg): When information on egg size was unavailable in specific papers, values were borrowed from other studies, using the following criteria in the descending order: from the same period, the same population, the same species. In five species of Perciformes no estimate was available for any population, thus egg volume was estimated from other species of the same family. 2) Fishing pressure Three types of environments with low, moderate and high fishing pressure were defined. - To scale the pressure exerted by fishing to the natural population turn-over, it was expressed as the ratio of fishing mortality to natural mortality rates (F/M). Data were gathered from the literature together with demographic traits. Authors use the following methods to estimate natural mortality rates: intercept of a regression of total mortality on fishing effort, linear relationship known between estimates of natural mortality, growth parameters and the temperature, or multispecies models. Fishing mortality rates were estimated from Virtual Population Analysis or cohort analysis, or as the difference between total and natural mortality. Three levels of fishing pressure were defined: low fishing pressure (fishing mortality lower than natural mortality, F/M < 1), intermediate (1 <= F/M < 2) and high (F/M >= 2).
-
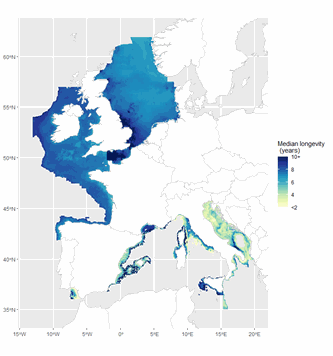
The ICES Working Group on Fisheries Benthic Impact and Trade-offs (WGFBIT) has developed an assessment framework based on the life history trait longevity, to evaluate the benthic impact of fisheries at the regional scale. In order to apply this framework to the Mediterranean sea, several Mediterranean longevity databases were merged together with existing North-East Atlantic ones to develop a common database. Longevity was fuzzy coded into four longevity classes: <1, 1-3, 3-10 and >10 years. Both benthic mega and macrofauna organisms are included in this dataset. Further details about both the purpose and the methodology may be found in ICES (2022) and Cuyvers et al. (2023). The result of the final dataset merging is one dataset containing the fuzzy coded average longevity (and standard deviation) for 2264 taxa and for each, the number of databases used.
-
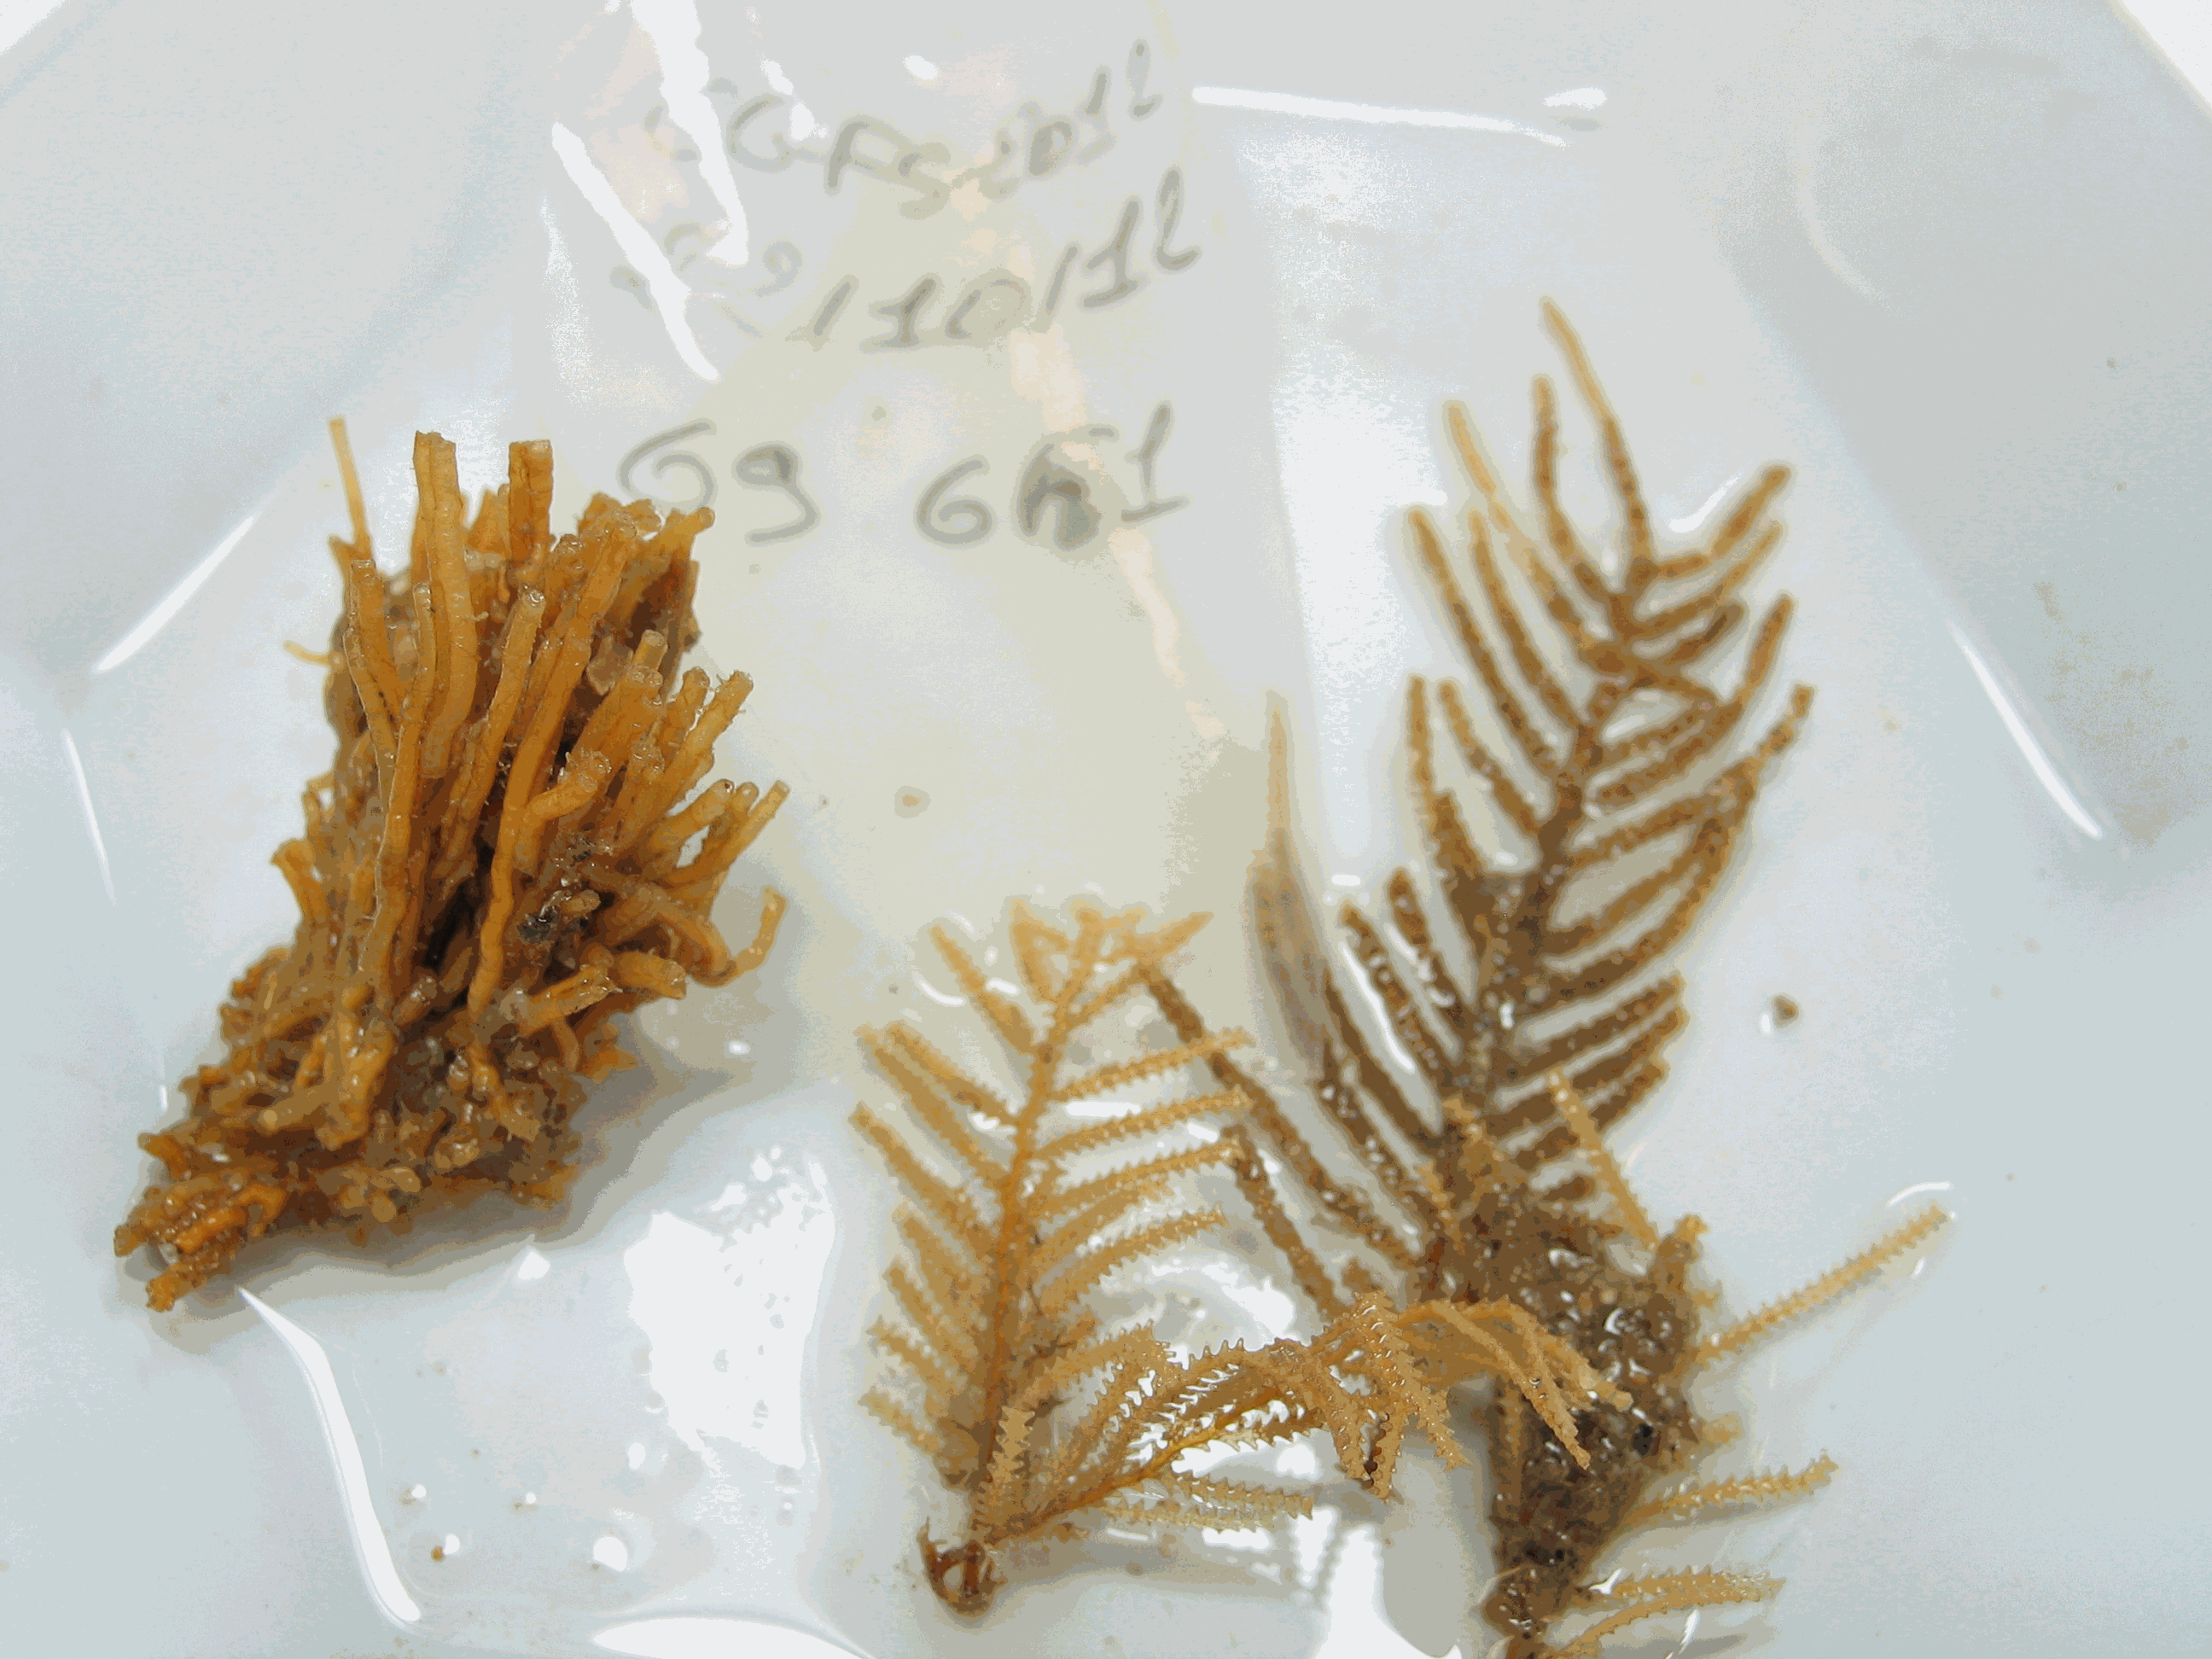
Particularly suited to the purpose of measuring the sensitivity of benthic communities to trawling, a trawl disturbance indicator (de Juan and Demestre, 2012, de Juan et al. 2009) was proposed based on benthic species life history traits to evaluate the sensibility of mega- and epifaunal community to fishing pressure known to have a physical impact on the seafloor (such as dredging and bottom trawling). The selected biological traits were chosen as they determine vulnerability to trawling: mobility, fragility, position on substrata, average size and feeding mode that can easily be related to the fragility, recoverability and vulnerability ecological concepts. Life history traits of species have been defined from the BIOTIC database (MARLIN, 2014) and from information given by Le Pape et al. (2007), Brindamour et al. (2009) and Garcia (2010). For missing life history traits, additional information from literature has been considered. The five categories retained are life history functional traits that were selected based on the knowledge of the response of benthic taxa to trawling disturbance (de Juan and Demestre, 2012). They reflect respectively the possibility to avoid direct gear impact, to benefit from trawling for feeding, to escape gear, to get caught by the net and to resist trawling/dredging action, each of these characteristics being either advantageous or sensitive to trawling. Then, to allow quantitative analysis, a score was assigned to each category: from low vulnerability (0) to high vulnerability (3). The five categories scores were then summed for each taxon (the highly vulnerable taxon could reach the maximum score is 15) and this value may be considered as a species index of sensitivity to trawling disturbance. The scores of 773 taxa commonly found in bottom trawl by-catch in the southern North Sea, English Channel and north-western Mediterranean were described.
-
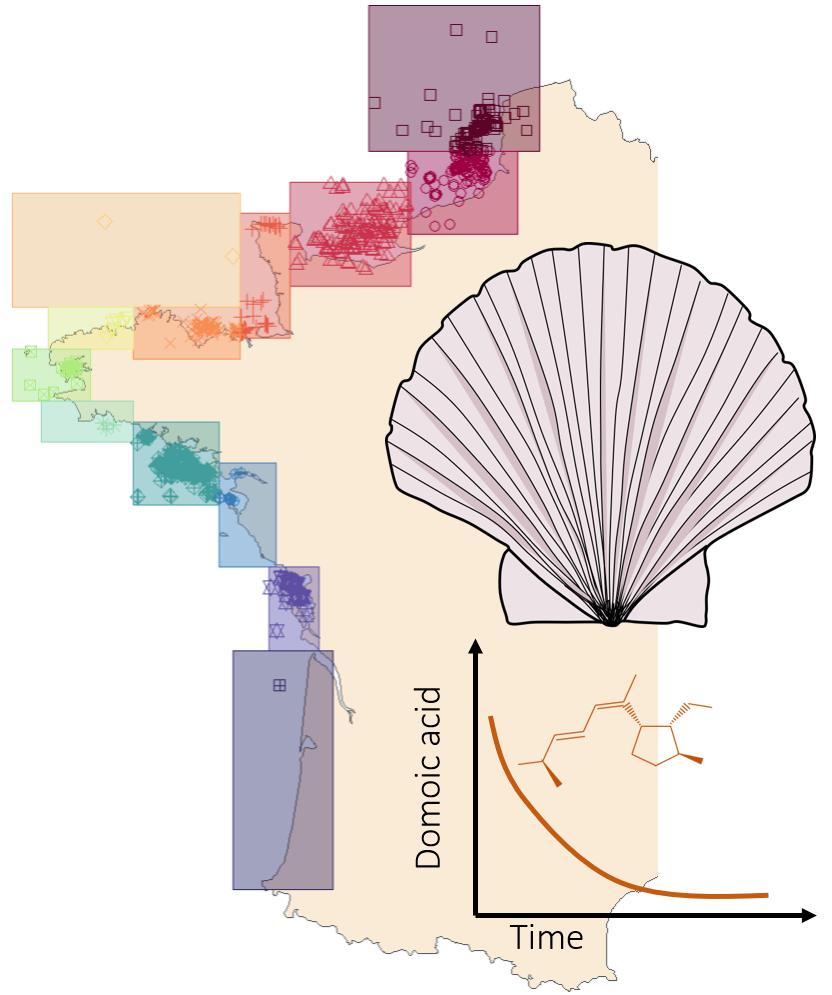
In the context of contamination of shellfish species by domoic acid produced by microalgal species of the genus Pseudo-nitzschia, we studied the particular case of depuration kinetics of king scallops, Pecten maximus. The study was based on the REPHYTOX dataset (https://doi.org/10.17882/47251) which includes, among others, long-term time series of domoic acid in shellfish species. We selected only the locations along the English Channel and the Atlantic coastline. Contamination events were defined for each locations, depuration rates were estimated fitting an exponential decay model using a non-linear least squares regression. Spatio-temporal variability was assessed as well as correlations to environmental conditions, using REPHY dataset (https://doi.org/10.17882/47248). Finally, scenarios for predictions of either the dynamics of depuration or the domoic acid contamination at a precise date were performed. Four files are available as data used for the study and results : (i) subset of REPHYTOX dataset, (ii) subset of REPHY dataset, used in this study and (iii) contamination event information (i.e., initial and end date of the event, initial domoic acid concentration) and depuration rate estimations, and (iv) predictions of depuration dynamics with different scenarios. Information on each file is detailed in the end user manual and methodology and results are linked to an article in preparation.
-

List of fish stocks referenced for the year 2018. The repository includes 477 stocks. Each stock is identified by a unique key in accordance with the ICES codification in use. Each record contains a stock identifier, a species or group of species identifier according to the ASFIS/FAO classification, the English stock name, the Latin name of the species, the assessment area according to the FAO codification of fishing sectors. When the stock assessment area groups a series of sectors, the first and last sectors in the series are separated by a dash.
-

The Mediterranean Sea is a natural laboratory to address questions about the formation and evolution of continental margins and the relationship between surface and deep processes. Different regional to local events have influenced the Neogene stratigraphic evolution of the Valencia and Menorca basins. The evaporites deposited during the Messinian Salinity Crisis (MSC) strongly impact its sedimentary and geomorphological evolution. Here we present a compilation of the main regional seismic stratigraphic markers from the continental platform to the deep sea. We provide in xyz format (z in second twt) the original picking files, (not interpolated) and interpolated grid of: i) the top of the Mesozoic formation, the base of the Neogene formations including the early Miocene volcanic features, ii) the top Burdigalian, Langhian, and Serravallian seismic horizons, iii) the seismic horizons related to the Messinian Salinity Crisis, iv) the Pliocene and Pleistocene seismic horizons v) the depth of the Seafloor. The available reflection seismic dataset results from the compilation and processing of vintage seismic profiles of previous works and from the Instituto Geologico y Minero de Espana (IGME). This compilation is currently the first available in literature and provides a useful contribution to the scientific community working on sedimentary, tectonics and geodynamics within the Western Mediterranean basins.
-
This In Situ delayed mode product integrates the best available version of in situ oxygen, chlorophyll / fluorescence and nutrients data. The latest version of Copernicus delayed-mode BGC (bio-geo-chemical) product is also distributed from Copernicus Marine catalogue.
-
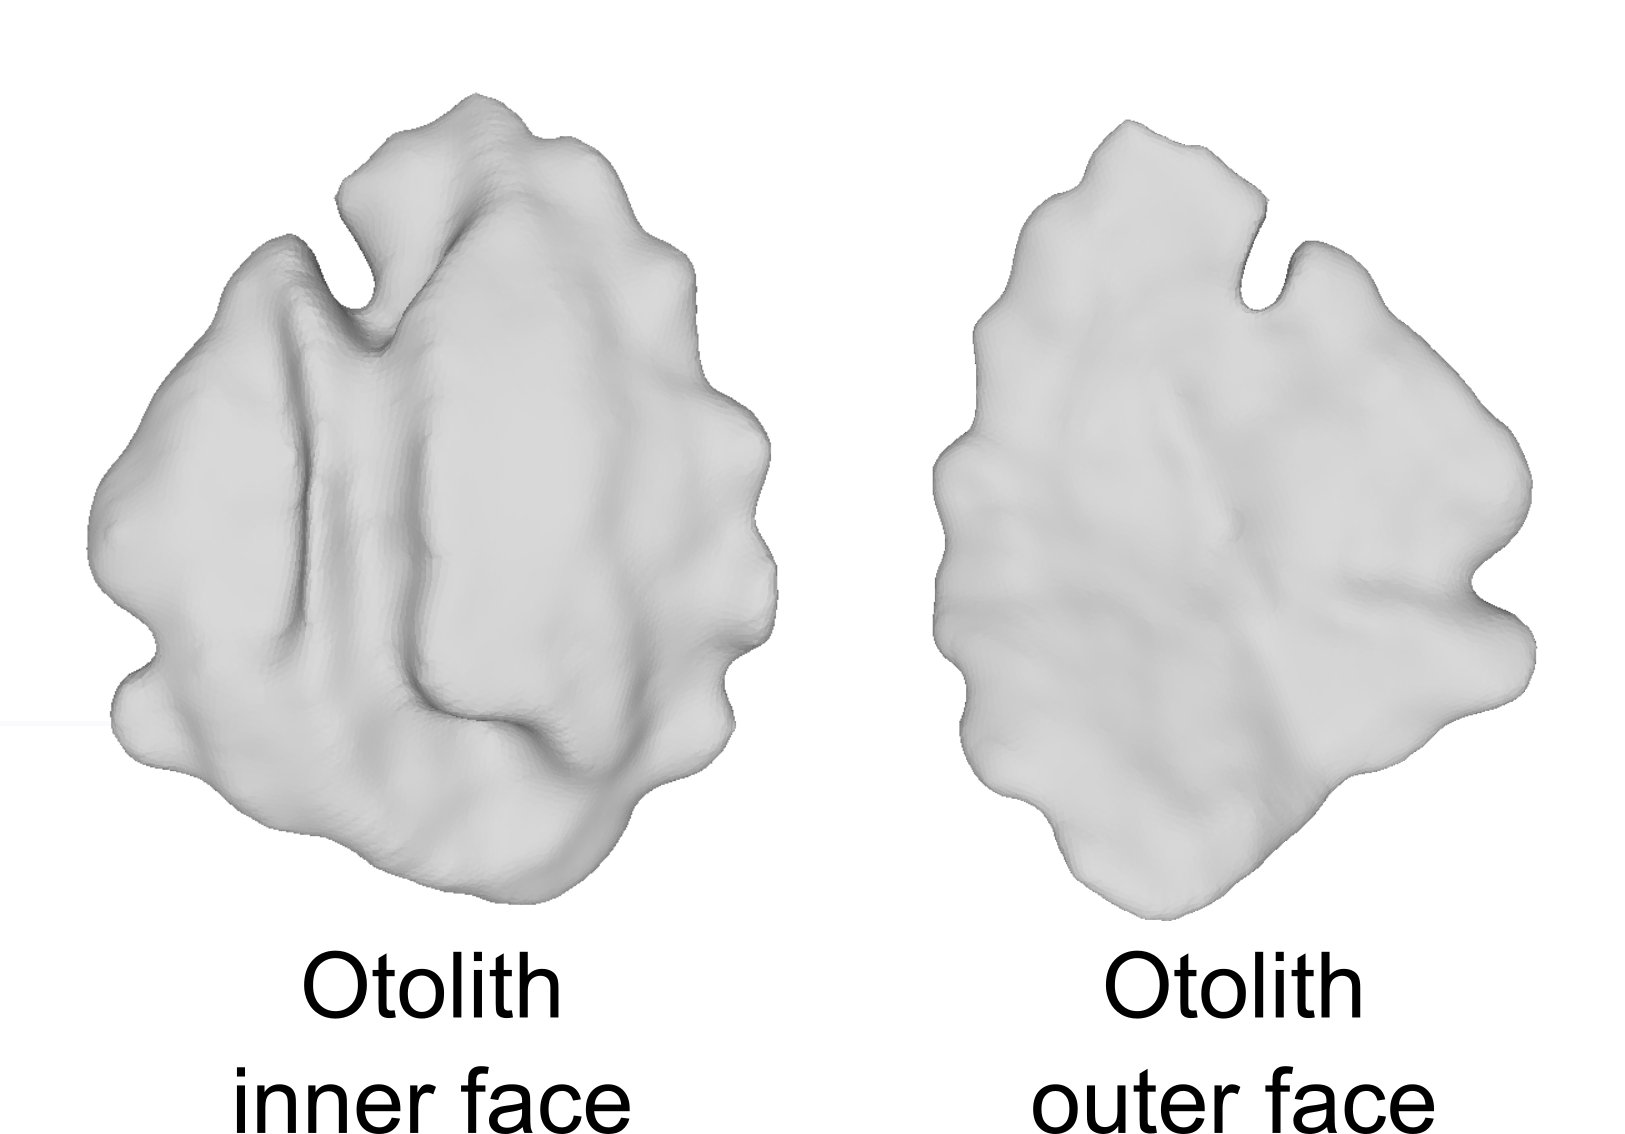
This dataset includes 3D sagittal left otolith meshes obtained from 344 individual red mullet (Mullus barbatus) specimens. These samples were collected from 19 distinct geographical locations spanning the whole Mediterranean Sea. Recorded biological parameters include fish total length (TL, ranging from 125 to 238 mm), total weight (W, ranging from 14.9 to 168.0 g), sex, and sexual maturity staging. The 3D otolith dataset consists of high-resolution meshes obtained through microtomography (29.2 m voxel size). The dataset provides valuable insights into the morphological variability and population structure of red mullet populations in the Mediterranean Sea.
-
This dataset was built to feed a basin-wide spatial conservation planning exercise, targeting the deep sea of the North Atlantic, in the framework of the ATLAS H2020 project. This approach aimed to inform Marine Spatial Planning and conservation initiatives for the deep sea of the North Atlantic, by identifying conservation priority areas for the Vulnerable Marine Ecosystems (VMEs) and deep fish species and discussing the efficiency of the current spatial management context relatively to conservation stakes. This publication provides (1) the links to spatial datasets used as an input, (2) the R scripts used to run the final conservation scenarios together with associated table of targets and connectivity matrix, that can be run on the input data, and (3) the outputs of the final scenarios constructed and computed for ATLAS. Produced by IFREMER.
-
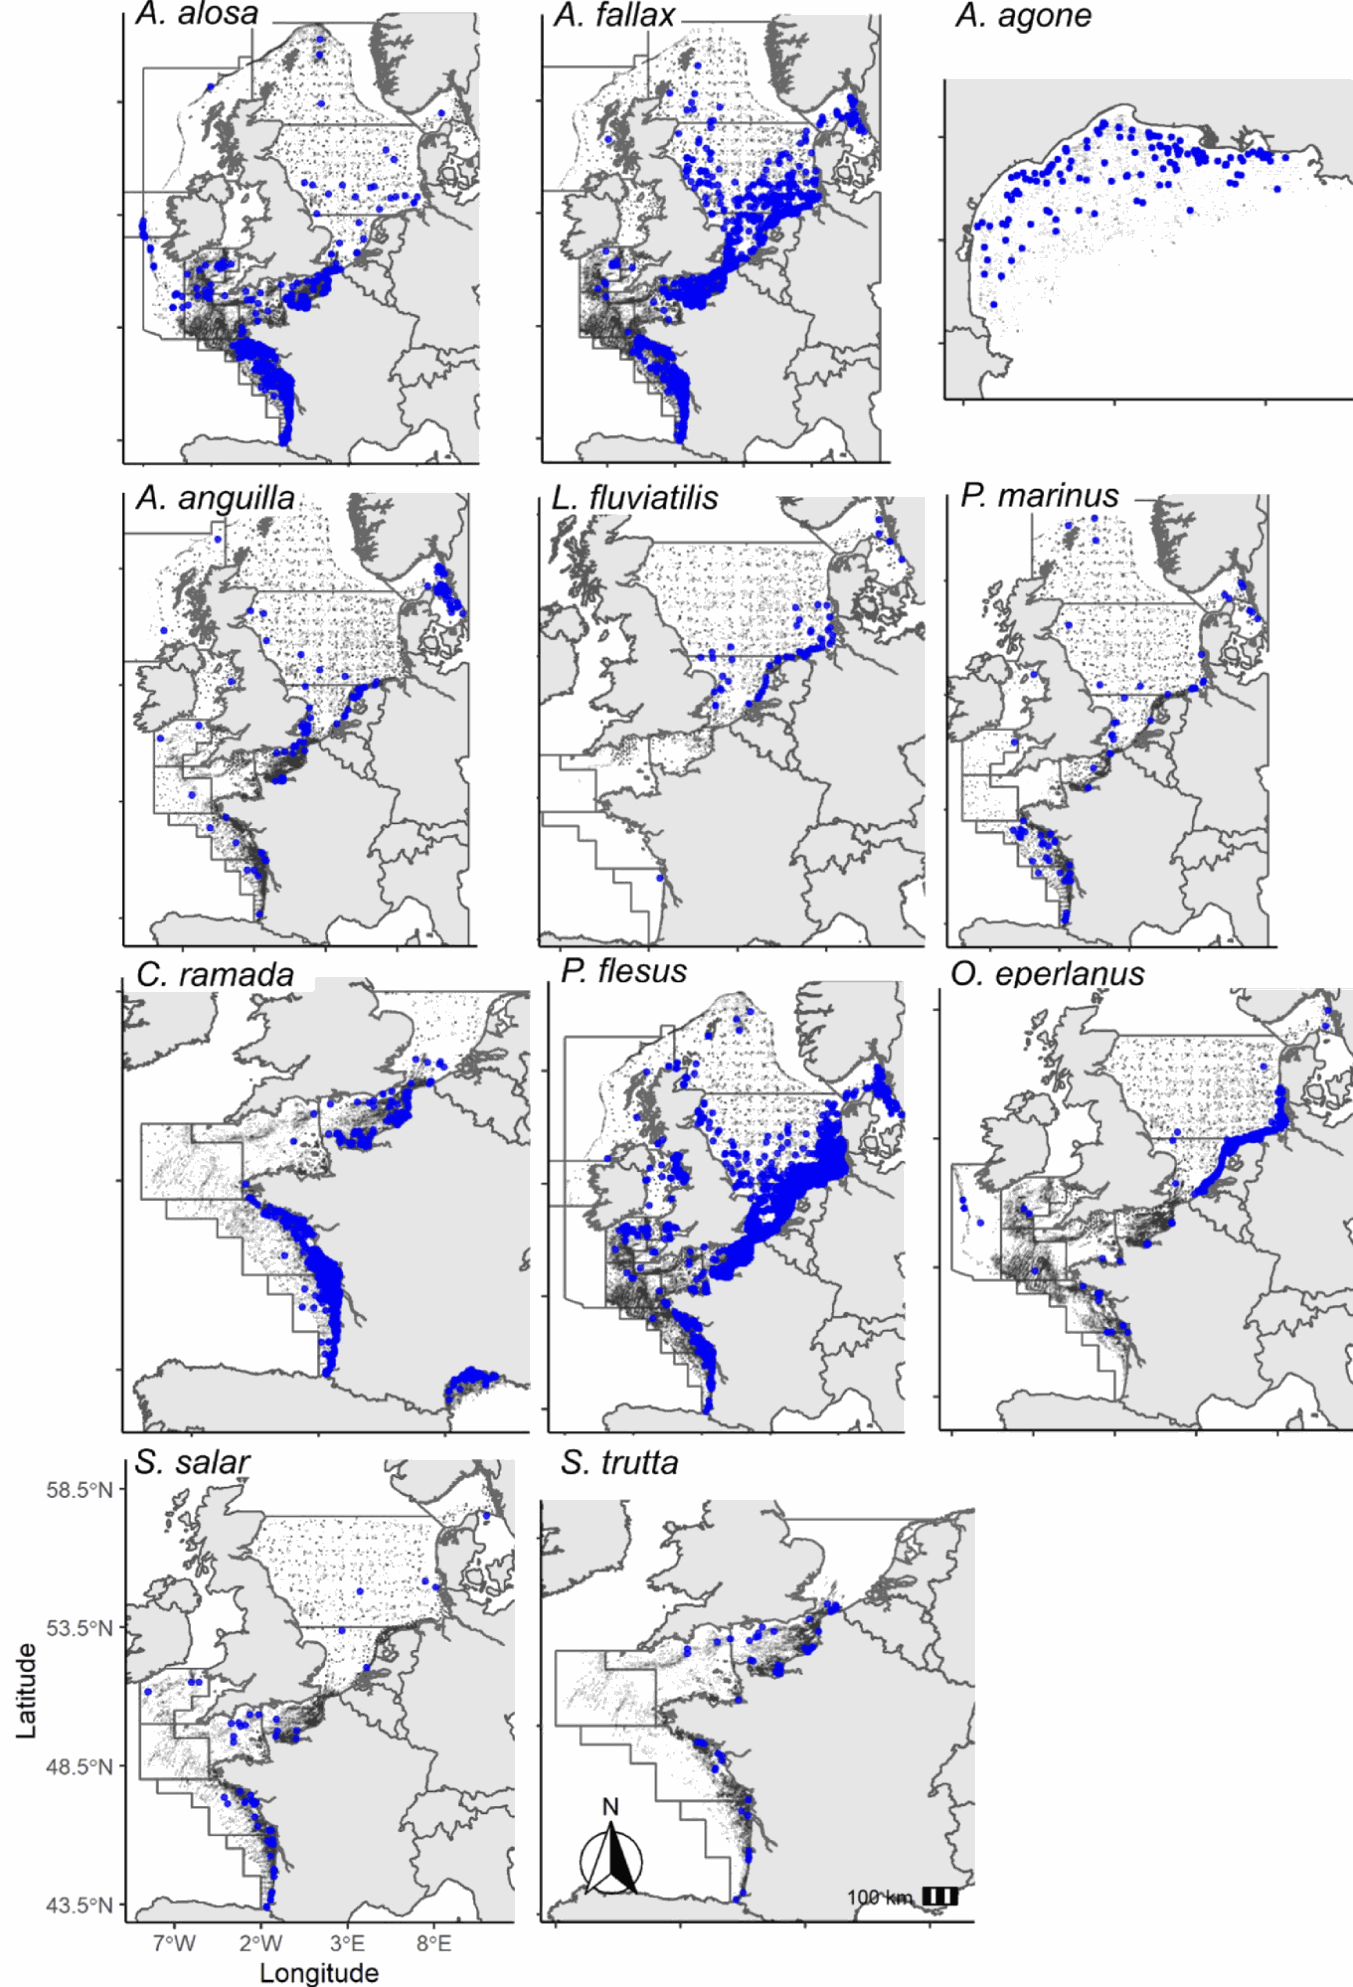
This database contains hauls collated from 1965 to 2019, from fisheries dependent and independent data, from across eastern Atlantic waters and French Mediterranean waters. From this data diadromous fish spatio-temporal data was cleaned and standardised.