 Catalogue PIGMA
CO2 Carbonate system
Type of resources
Available actions
Topics
Keywords
Contact for the resource
Provided by
Years
Formats
Representation types
Update frequencies
Resolution
-
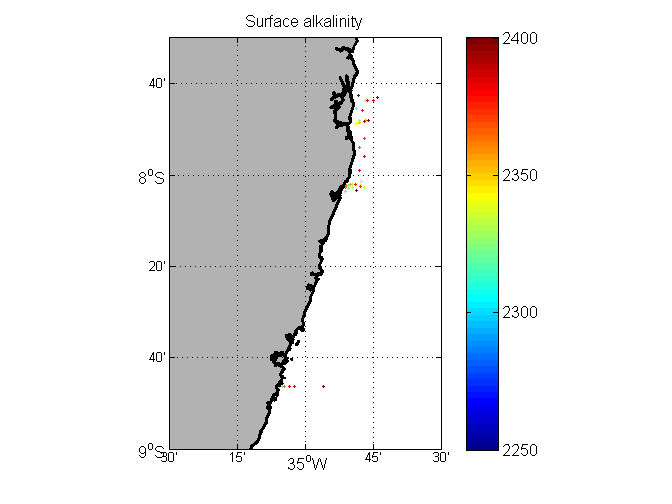
Inorganic carbon and alkalinity measurements (in micromoles/kg) along the coast of Brazil, 2013-2015.
-
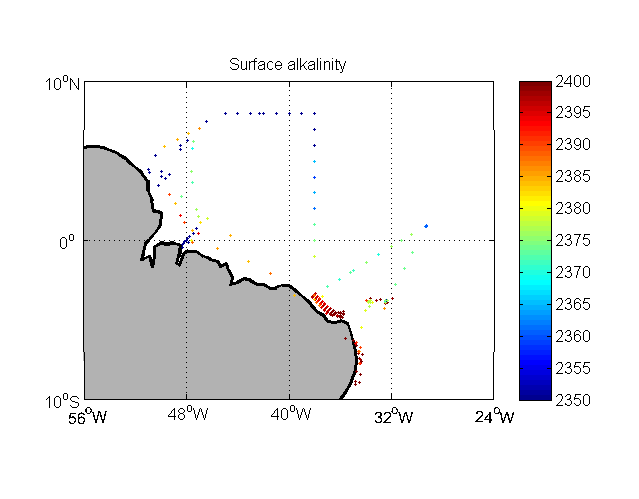
Inorganic carbon and alkalinity measurements (in micromoles/kg) from Brazilian cruises in the Western Tropical Atlantic.
-
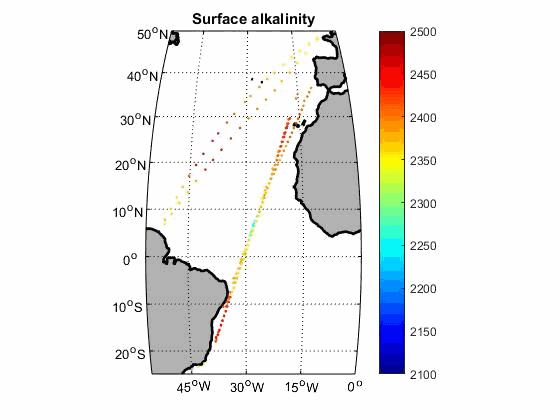
Carbon parameters along the track of merchant ships
-

In recent years, large datasets of in situ marine carbonate system parameters (partial pressure of CO2 (pCO2), total alkalinity, dissolved inorganic carbon and pH) have been collated. These carbonate system datasets have highly variable data density in both space and time, especially in the case of pCO2, which is routinely measured at high frequency using underway measuring systems. This variation in data density can create biases when the data are used, for example for algorithm assessment, favouring datasets or regions with high data density. A common way to overcome data density issues is to bin the data into cells of equal latitude and longitude extent. This leads to bins with spatial areas that are latitude and projection dependent (eg become smaller and more elongated as the poles are approached). Additionally, as bin boundaries are defined without reference to the spatial distribution of the data or to geographical features, data clusters may be divided sub-optimally (eg a bin covering a region with a strong gradient). To overcome these problems and to provide a tool for matching in situ data with satellite, model and climatological data, which often have very different spatiotemporal scales both from the in situ data and from each other, a methodology has been created to group in situ data into ‘regions of interest’, spatiotemporal cylinders consisting of circles on the Earth’s surface extending over a period of time. These regions of interest are optimally adjusted to contain as many in situ measurements as possible. All in situ measurements of the same parameter contained in a region of interest are collated, including estimated uncertainties and regional summary statistics. The same grouping is done for each of the other datasets, producing a dataset of matchups. About 35 million in situ datapoints were then matched with data from five satellite sources and five model and re-analysis datasets to produce a global matchup dataset of carbonate system data, consisting of 287,000 regions of interest spanning 54 years from 1957 to 2023. Each region of interest is 50 km in diameter and 5 days in duration, improving the spatial and temporal resolution of the previous version (v3.4). The list of sources added in this dataset includes: - sea surface temperature and sea ice concentration from Copernicus Climate Service Multi-satellite L4 (http://dx.doi.org/10.5285/62c0f97b1eac4e0197a674870afe1ee6) - sea surface salinity from the Copernicus Marine service Multi Observation Global Ocean Sea Surface Salinity and Sea Surface Density (https://doi.org/10.48670/moi-00051) - Surface ocean sea-air CO2 fluxes and total alkalinity from ETH Zurich OceanSODA-ETHZ-v2 gridded dataset (https://doi.org/10.5281/zenodo.11206366) - salinity and mixed layer depth from SODA v3.4.2 reanalysis (https://doi.org/10.1175/JCLI-D-18-0149.1) - chlorophyll-A from ESA Ocean Colour CCI v6 (doi:10.3390/s19194285) - wind at 10 m and mean sea level pressure from ERA5 reanalysis - nitrate, silicate, phosphate, oxygen, temperature and salinity from World Ocean Atlas 2018 - sea level anomaly from Global Ocean Gridded L4 Sea Surface Heights And Derived Variables Multi-Year dataset by Copernicus Marine Service Information (https://doi.org/10.48670/moi-00148) - sea surface salinity from ESA Salinity CCI L4 v3.2.1 (https://dx.doi.org/10.5285/5920a2c77e3c45339477acd31ce62c3c) - sea surface salinity from JPL SMAP Level 3 CAP Sea Surface Salinity (https://doi.org/10.5067/SMP40-3SPCS) - temperature and salinity from Coriolis Observation Re-Analysis CORA5.2 by Copernicus Marine Service (https://doi.org/10.17882/46219) - subskin sea surface temperature from NOAA OISST SST (http://doi.org/10.5067/GHAAO-4BC01) - sea surface salinity from the Arctic salinity dataset (https://doi.org/10.20350/digitalCSIC/9065) the Barcelona Expert Center (http://bec.icm.csic.es/) - pH and spCO2 from Copernicus Marine Service Surface Ocean Carbon Dataset (https://doi.org/10.48670/moi-00047) An example application, the reparameterisation of a global total alkalinity algorithm, is shown. This matchup dataset can be updated as and when in situ and other datasets are updated, and similar datasets at finer spatiotemporal scale can be constructed, for example to enable regional studies. This dataset was funded by ESA OceanHealth / Ocean Acidification project which aims at developing the use of satellite Earth Observation for studying and monitoring marine carbonate chemistry.
-
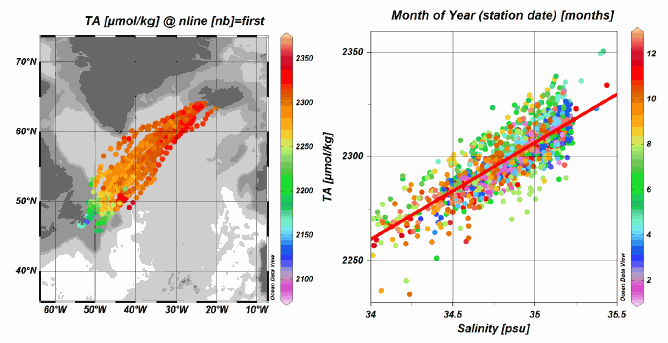
The SURATLANT dataset (SURveillance ATLANTique) consists of individual data of temperature, salinity, dissolved inorganic carbon (DIC) and its isotopic composition d13CDIC, total alkalinity (At), inorganic nutrients and water stable isotopes (δ18O and δD) collected mostly from ships of opportunity since 1993 along transects between Iceland and Newfoundland (shipping company EIMSKIP), as well as, since 2014, between west Greenland and Danemark (shipping company RAL). The data have been validated, qualified, and their accuracy and the overall characteristics of the data set are presented in a paper (Reverdin et al., 2018). The csv file provides a listing of the data with one line for each collection date. This includes collection date, position, temperature, salinity, and the measured, validated and in some cases adjusted variables, as well as a quality code following WOCE/GLODAP format. For water isotopes and isotopic composition of inroganic carbon, a code is also provided indicating the method of measurement used. An additional text-file provides a normalized average seasonal cycle of the 10 variables measured in 5 boxes between the vicinity of Newfoundland to the south-west of Iceland (corresponding to the figure 3 of the paper Reverdin et al in the References). Format and information is provided in the top 25 lines and the gridded seasonal cyle data start at line 26.
-
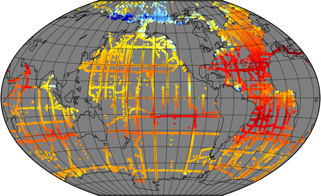
In recent years, large datasets of in situ marine carbonate system parameters (partial pressure of CO2 (pCO2), total alkalinity, dissolved inorganic carbon and pH) have been collated. These carbonate system datasets have highly variable data density in both space and time, especially in the case of pCO2, which is routinely measured at high frequency using underway measuring systems. This variation in data density can create biases when the data are used, for example for algorithm assessment, favouring datasets or regions with high data density. A common way to overcome data density issues is to bin the data into cells of equal latitude and longitude extent. This leads to bins with spatial areas that are latitude and projection dependent (eg become smaller and more elongated as the poles are approached). Additionally, as bin boundaries are defined without reference to the spatial distribution of the data or to geographical features, data clusters may be divided sub-optimally (eg a bin covering a region with a strong gradient). To overcome these problems and to provide a tool for matching in situ data with satellite, model and climatological data, which often have very different spatiotemporal scales both from the in situ data and from each other, a methodology has been created to group in situ data into ‘regions of interest’, spatiotemporal cylinders consisting of circles on the Earth’s surface extending over a period of time. These regions of interest are optimally adjusted to contain as many in situ measurements as possible. All in situ measurements of the same parameter contained in a region of interest are collated, including estimated uncertainties and regional summary statistics. The same grouping is done for each of the other datasets, producing a dataset of matchups. About 35 million in situ datapoints were then matched with data from five satellite sources and five model and re-analysis datasets to produce a global matchup dataset of carbonate system data, consisting of 287,000 regions of interest spanning 54 years from 1957 to 2020. Each region of interest is 100 km in diameter and 10 days in duration. An example application, the reparameterisation of a global total alkalinity algorithm, is shown. This matchup dataset can be updated as and when in situ and other datasets are updated, and similar datasets at finer spatiotemporal scale can be constructed, for example to enable regional studies. This dataset was funded by ESA Satellite Oceanographic Datasets for Acidification (OceanSODA) project which aims at developing the use of satellite Earth Observation for studying and monitoring marine carbonate chemistry. **This version is now superseded by the version 4 with higher spatial and temporal resolution**
-

This set of data documents the radiocarbon dates (n=19) obtained thanks to the accelerator mass spectrometry method (AMS) at the LMC14/ARTEMIS French national facility on the cores (Multicorer, Kullenberg) retrieved from the West-Gironde mud patch (WGMP) during the JERICObent-7 cruise (10-15 July 2019; NR Côtes de la Manche, https://doi.org/10.17600/18001022). The WGMP registers very high sedimentation rates since the last 600 years (≥ 0.3 cm/yr) and is thus of great interest for palaeoceanographic investigations. At present, this depocenter marks the mid-shelf of the temperate Bay of Biscay off major French rivers from the Aquitaine basin. The fine mud deposits of the WGMP are of 3 to 4 meters thick and lie on palimpsest levels rich in gravels and shells. They cover a V-shaped structure, oriented SW-NE, which is attributed to the incision(s) of a paleovalley in the Cenozoic substrate, mainly linked to the paleo-Gironde routing changes during past glacials/interglacials, and its potential past convergences with the paleo-rivers of the Antioche perthuis (Seudre, Charente paleovalleys?) at that times. Detailed information on each sample is presented with the 14C results obtained by the Artemis AMS facility at LMC14 laboratory (Dumoulin et al. 2017- https://doi.org/10.1017/RDC.2016.116, Beck et al. 2024- https://doi.org/10.1017/RDC.2023.23). Raw ages are indicated together with calibration calculations using the last two versions of the Calib software (http://calib.org/, Calib 7 and 8) to show the dispersion of ages linked to the updating of calibration curves (Marine13, Intcal13, Marine20, Intcal 20). The calibrated ages finally retained for publications (used in the related Seanoe document - https://doi.org/10.17882/104237 - and published in Eynaud et al., 2025 for the ST3c core, https://doi.org/10.1016/j.gloplacha.2025.105039) are those obtained with the last Calib 8.1 version. Raw 14C ages were calibrated and converted to calendar ages using the IntCal20 calibration curve with a reservoir age correction of 400 years deduced from Radionuclide analyses (137Cs and 210Pb) at the top of the studied cores (see Schmidt, 2025, https://www.seanoe.org/data/00968/107979/).
-
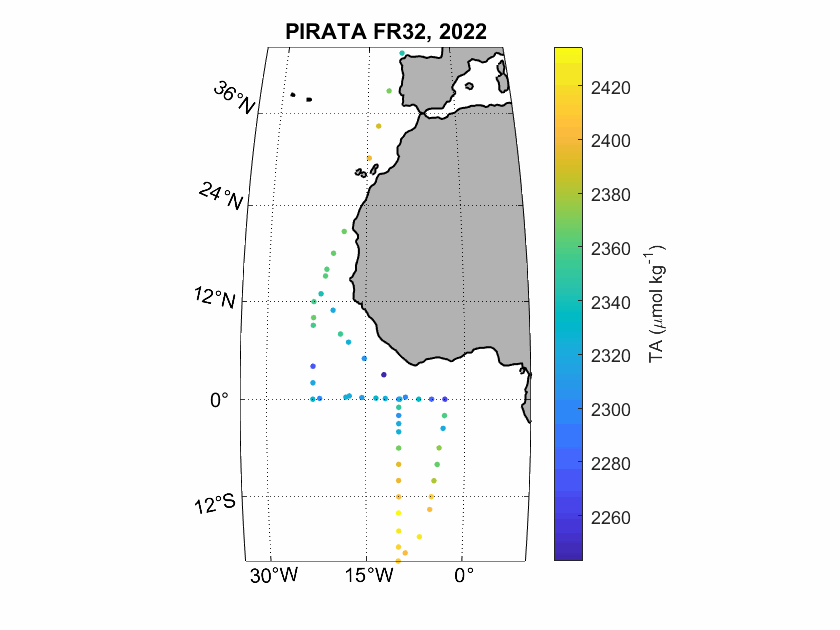
Seawater samples (500 mL) were taken during the PIRATA FR-32 cruise to measure surface inorganic carbon and alkalinity. The analyses were realised by potentiometric titration using a closed-cell at the SNAPO-CO2, LOCEAN in Paris.
-
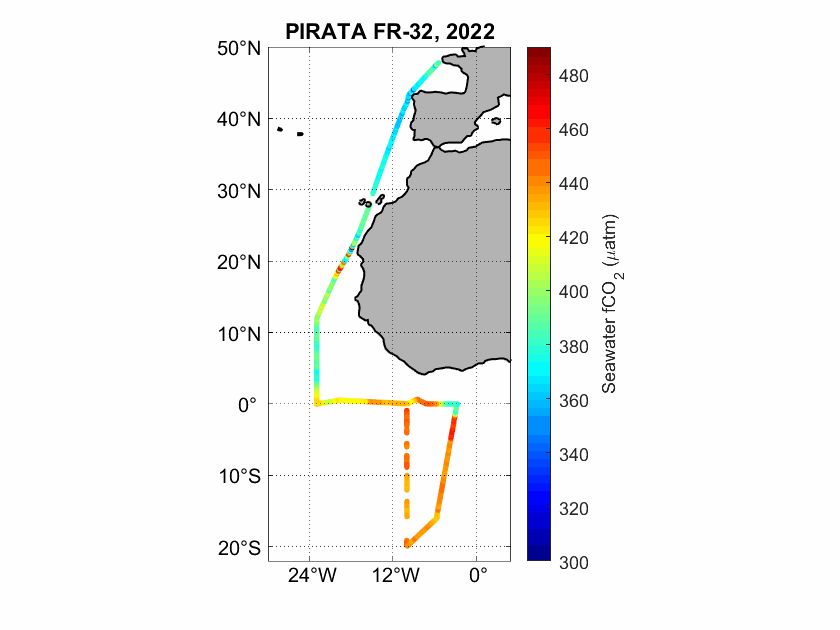
The fugacity of CO2 (fCO2) was measured underway during the PIRATA FR-32 cruise in the Eastern Tropical Atlantic using an infrared detection technique.
-
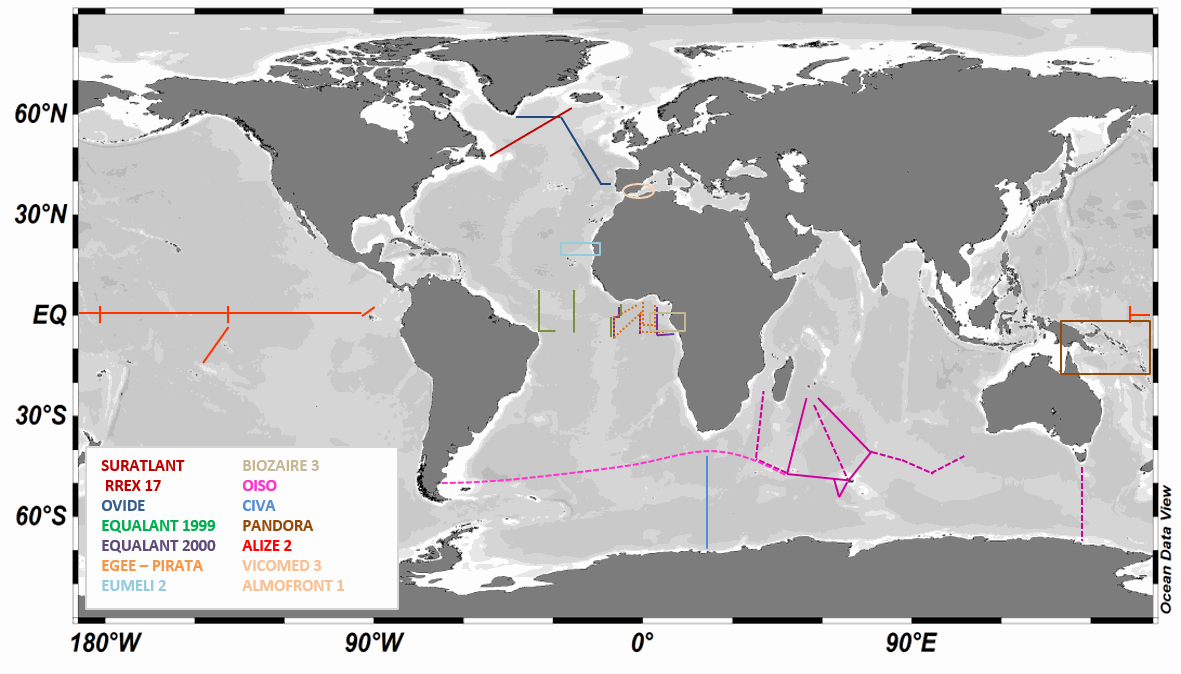
LOCEAN has been in charge of analyzing the isotopic composition of the dissolved inorganic carbon (DIC) in sea water collected during a series of cruises or ships of opportunity mostly in the southern Indian Ocean , the North Atlantic, and the equatorial Atlantic, but also in the Mediterranean Sea and in the equatorial Pacific. The LOCEAN sea-water samples for δ13CDIC were collected in 125/25 ml glass bottles until 2022/since then and poisoned with HgCl2 (1 ml of saturated solution) before storage in a dark room à 4°C until their measurement. The DIC was extracted from the seawater by acidification with phosphoric acid (H3PO4 85%) and CO2 gas that was produced was collected in a vacuum system following the procedure described by Kroopnick (1974). The isotopic composition of CO2 was determined using a dual inlet-isotopic ratio mass spectrometer (SIRA9-VG) by comparing the 13C/12C ratio of the sample to the 13C/12C ratio of a reference material, the Vienna-Pee Dee Belemnite (V-PDB). The isotopic composition is expressed in the δ-unit defined by Craig (1957)(method type 2). Experience showed that samples older than 3-4 years are likely to have experienced conservation issues and have been dismissed. The mass spectrometer has worked very well until 2014-2015. Afterwards, its aging as well as the aging of the preparation line resulted in more data loss, and often less accurate results. The preparation line was renovated in 2019, and analyses in 2020 were run manually, often repeating the measurement a second time for each sample. Up to 2007-2008, δ13CDIC values have a precision of±0.01 ‰ (Vangriesheim et al.,2009) and a reproducibility of±0.02 ‰. After an interlaboratory comparison exercise led by Claire Normandeau (Dalhousie University), results suggest that recent LOCEAN samples have a slightly poorer reproducibility (±0.04 ‰ ) as well as an offset of -0.13‰ (details available in Reverdin et al., ESSD 2018) that is confirmed by Becker et al. 2016 work by comparison with other cruises after removing the anthropogenic signal. Recent comparisons in early May 2021 with Orsay GEOPS facility samples suggest that the current offset is much smaller and might be +0.03‰. LOCEAN has installed in 2021 a new measurement device by coupling a Picarro G2131-I cavity ring down spectrometer (CRDS) with a CO2 extractor (Apollo SciTech) that will measure at the same time DIC (method type 3) (Leseurre, 2022). Since then, all water samples have been analyzed on this device. Part of the data set, as well as a scientific context and publications are also presented on the WEB site https://www.locean-ipsl.upmc.fr/oceans13c. Individual files correspond to regional subsets of the whole dataset. The file names are based on two letters for the region followed by (-) the cruise or project name (see below) followed by –DICisotopes, followed by either -s (surface data) or -b (subsurface data), and a version number (-V0, …): example SI-OISO-DICisotopes-s-V0; the highest version number corresponds to the latest update of the cruise/project data set, and can be directly downloaded. Earlier versions can be obtained on request, but are not recommended. The region two letters are the followings: - SI: station and surface data in the Southern Indian Ocean that include cruises : INDIGO I (1985 – stn) (https://doi.org/10.17600/85000111) CIVA I (1993 – stn & surf) (https://doi.org/10.17600/93000870) (Archambeau et al., JMS 1998) ANTARES (1993 – stn & surf) (https://doi.org/10.17600/93000600) OISO (*) (since 1998 – stn & surf) (https://doi.org/10.18142/228) (Racapé et al., Tellus 2010, Leseurre, 2022) - EA: station and surface data in the Tropical Atlantic Ocean that include cruises : EQUALANT (1999 & 2000 – surf) (https://doi.org/10.18142/98) EGEE (2005 to 2007 – stn & surf) (https://doi.org/10.18142/95) PIRATA (since 2013 – stn & surf) (https://doi.org/10.18142/14) EUMELI 2 (1991 – stn) (https://doi.org/10.17600/91004011) (Pierre et al., JMS 1994) BIOZAIRE 3 (2003 – stn & surf ) (https://doi.org/10.17600/3010120) (Vangriesheim et al., DSRII, 2009) TARA-Microbiomes (2021 - stn & surf) - NA : station and surface data in the North Atlantic Subpolar gyre that include cruises : OVIDE (**) (since 2002 – stn & surf) (https://doi.org/10.17882/46448) (Racapé et al., 2013) RREX (2017 – stn & surf) (https://doi.org/10.17600/17001400) SURATLANT (since 2010 - surf) (https://doi.org/10.17882/54517) (Racapé et al., BG 2014 ; Reverdin et al., ESSD 2018, Leseurre, 2022) NUKATUKUMA (since 2017- surf) - MS: station data in the Mediterranean sea that include cruises : ALMOFRONT 1 (1991 – stn) (https://doi.org/10.17600/91004211) VICOMED 3 (1990 – stn) (https://doi.org/10.17600/90000711) - PO: tropical Pacific that include cruises : PANDORA (2012 – stn) (https://doi.org/10.17600/12010050) ALIZE2 (1991 – stn & surf) (https://doi.org/10.17600/91002711) (Laube-Lenfant and Pierre, Oceanologica Acta 1994) - SO: station and surface data in the Southern Ocean (except OISO) that include cruises: TARA-Microbiomes (2021-2022, stn & surf) AGULHASII-072022 (2022, stn) CONFLUENCE (1993-1994, stn) - AO: station and surface data in the Arctic Ocean and nearby seas that include cruises: GREENFEEDBACK (2024, stn&surf) TCA (2024, stn) REFUGE ARCTIC (2024, stn) (*) The values for cruises OISO19, 21 and 22 are doubtful (for some, too low) and will require further investigation to find whether adjusted values can be proposed. (**) Some of the OVIDE cruises are also referred to as or GEOVIDE (in 2014), and BOCATS (in 2016). CATARINA, BOCATS1 and BOCATS2 (PID2019-104279GB-C21/AEI/10.13039/501100011033) cruises were funded by the Spanish Research Agency The values of the OVIDE 2010 stations are doubtful (too low), but no particular error was found, and they have been left in the files. Data The files are in csv format reported as: - Cruise name, station id, (bottle number), day, month, year, hour, minute, longitude, latitude, pressure (db), depth (m), temperature (°C), temperature qc, salinity (pss-78), salinity qc, d13CDIC, d13CDIC qc, method type - Temperature is an in situ temperature - Salinity is a practical salinity - Method type (1) acid CO2 extraction from helium stripping technique coupled to mass spectrometer, (2) acid CO2 extraction in a vacuum system coupled to mass spectrometer,(3) CO2 extractor (Apollo SciTech) coupled to CRDS measurements. Temperature qc, salinity qc, d13CDIC qc are quality indices equal to: - 0 no quality check (but presumably good data) - 1 probably good data - 2 good data - 3 probably bad data - 4 certainly bad data - 9 missing data (and the missing data are reported with an unlikely missing value)