annually
Type of resources
Available actions
Topics
Keywords
Contact for the resource
Provided by
Years
Formats
Representation types
Update frequencies
status
Service types
Scale
Resolution
-

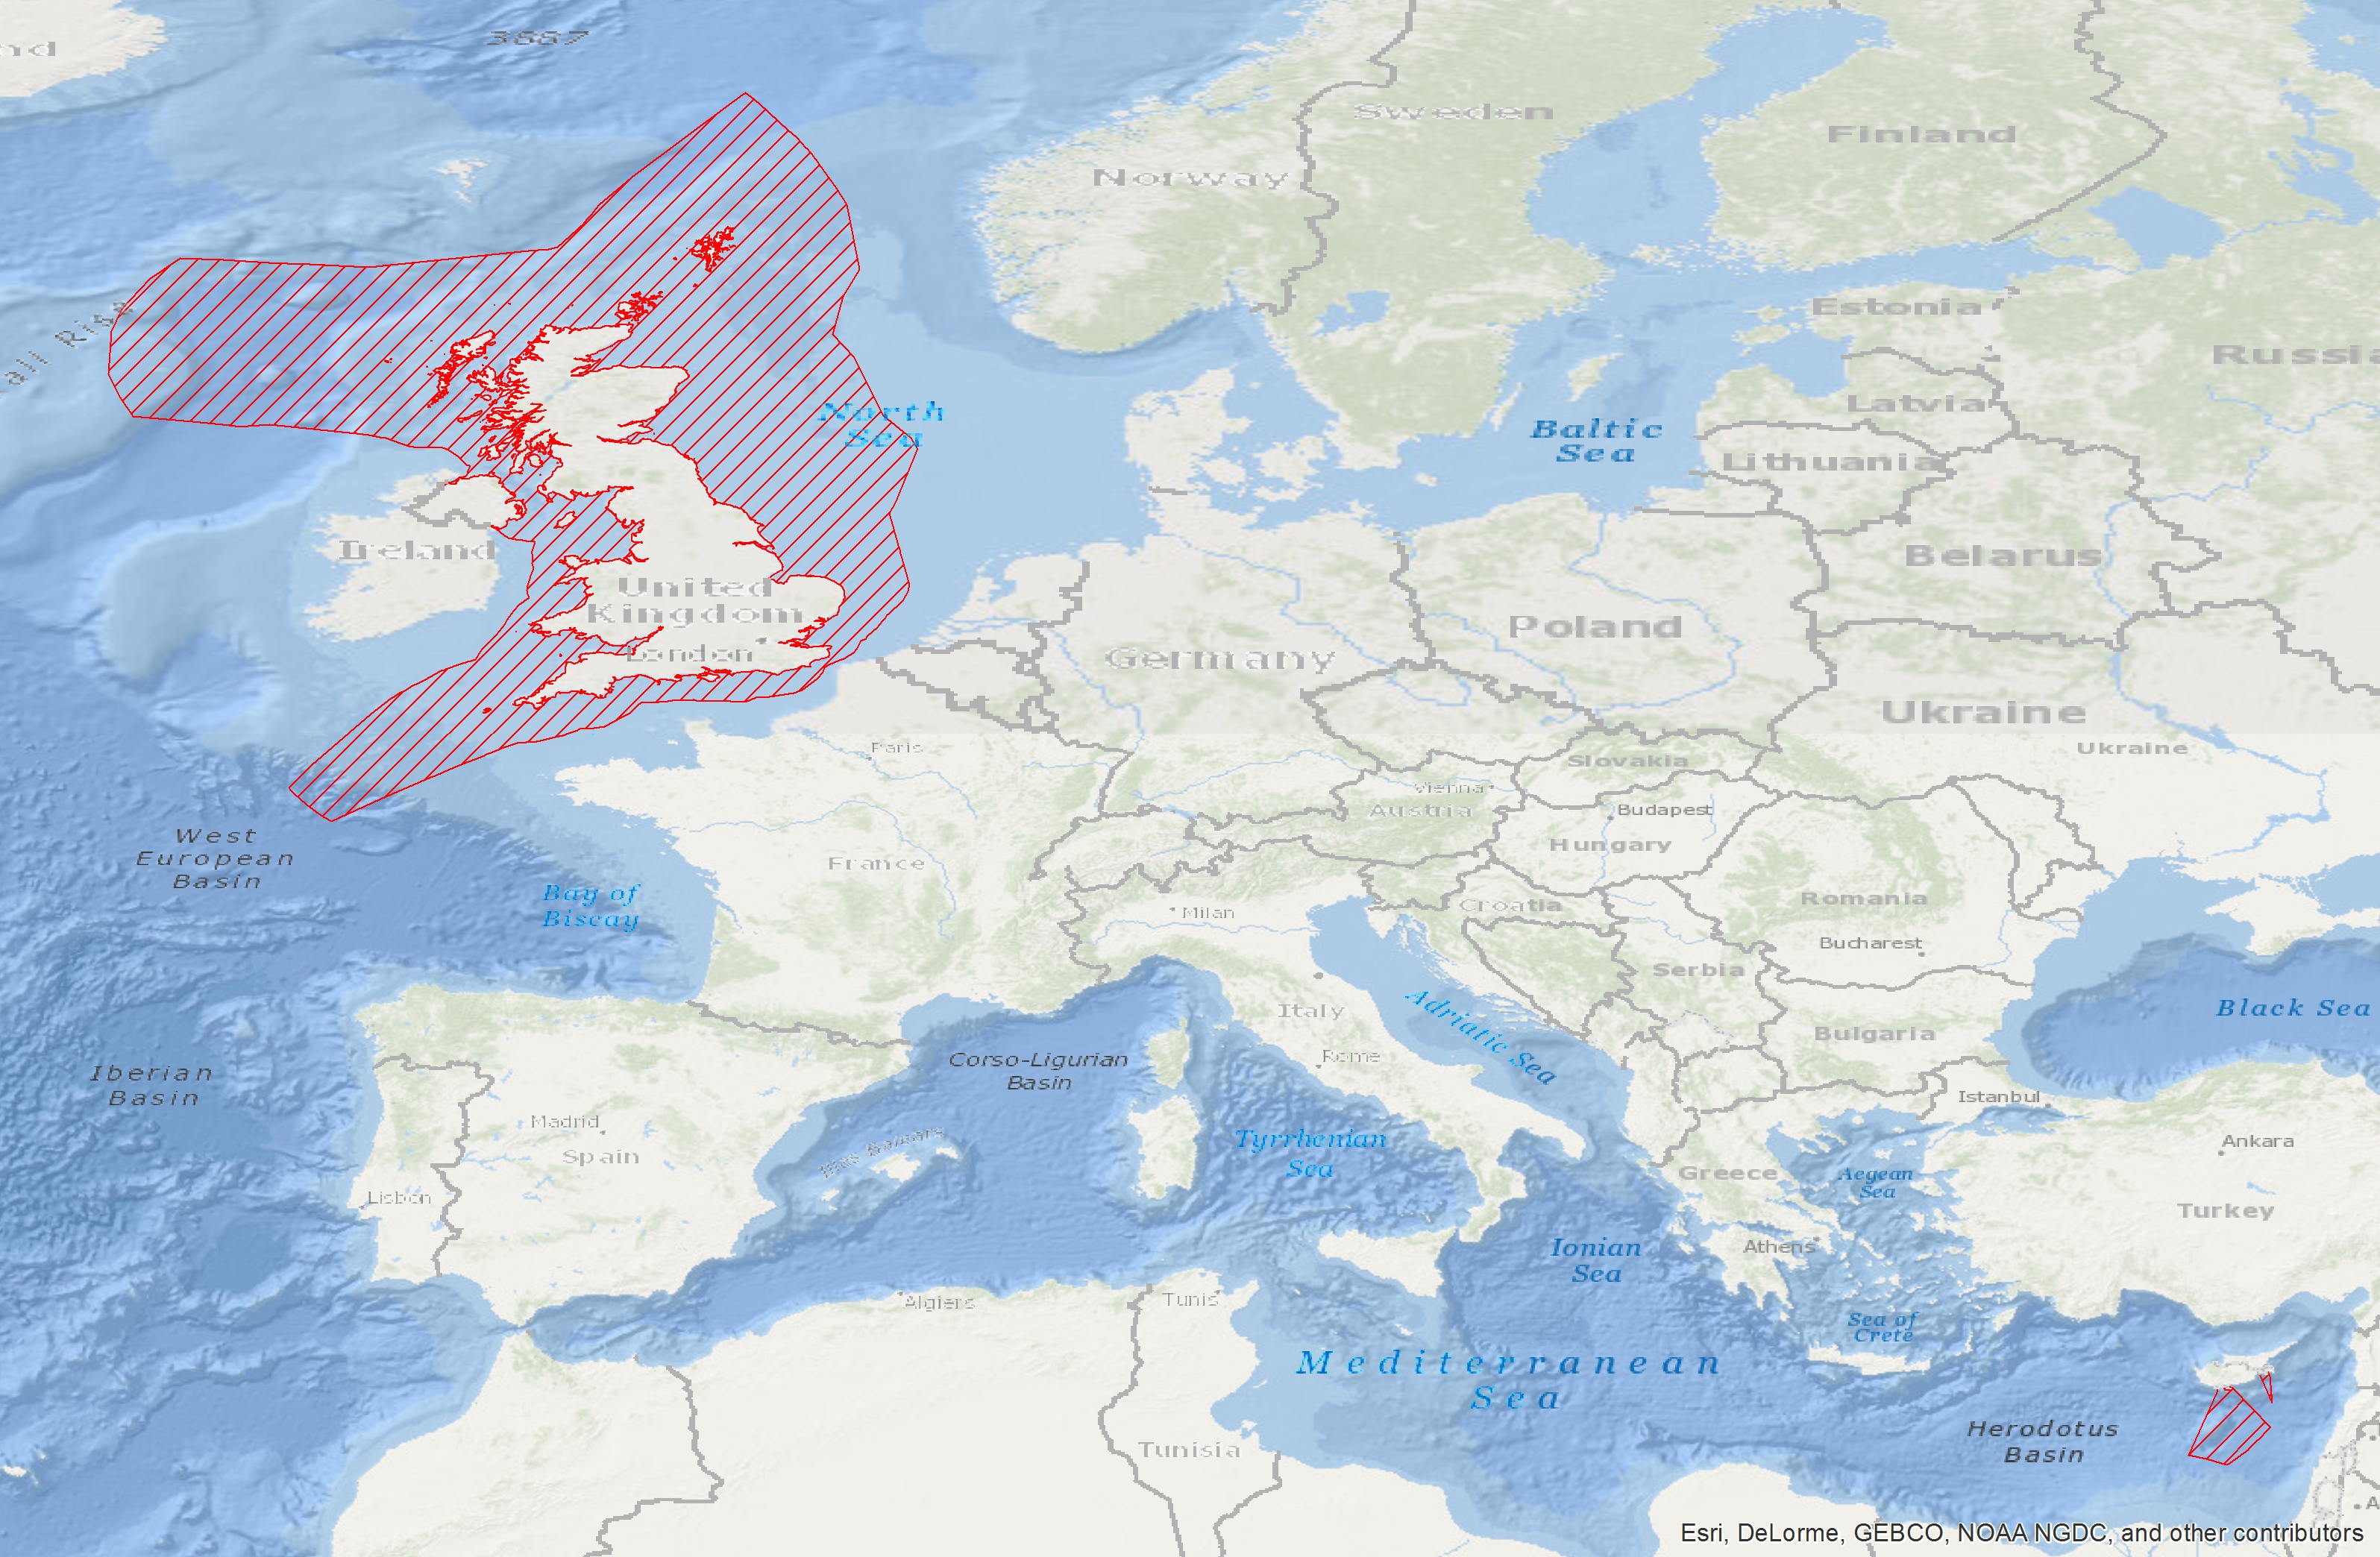
'''DEFINITION''' The OMI_EXTREME_WAVE_IBI_swh_mean_and_anomaly_obs indicator is based on the computation of the 99th and the 1st percentiles from in situ data (observations). It is computed for the variable significant wave height (swh) measured by in situ buoys. The use of percentiles instead of annual maximum and minimum values, makes this extremes study less affected by individual data measurement errors. The percentiles are temporally averaged, and the spatial evolution is displayed, jointly with the anomaly in the target year. This study of extreme variability was first applied to sea level variable (Pérez Gómez et al 2016) and then extended to other essential variables, sea surface temperature and significant wave height (Pérez Gómez et al 2018). '''CONTEXT''' Projections on Climate Change foresee a future with a greater frequency of extreme sea states (Stott, 2016; Mitchell, 2006). The damages caused by severe wave storms can be considerable not only in infrastructure and buildings but also in the natural habitat, crops and ecosystems affected by erosion and flooding aggravated by the extreme wave heights. In addition, wave storms strongly hamper the maritime activities, especially in harbours. These extreme phenomena drive complex hydrodynamic processes, whose understanding is paramount for proper infrastructure management, design and maintenance (Goda, 2010). In recent years, there have been several studies searching possible trends in wave conditions focusing on both mean and extreme values of significant wave height using a multi-source approach with model reanalysis information with high variability in the time coverage, satellite altimeter records covering the last 30 years and in situ buoy measured data since the 1980s decade but with sparse information and gaps in the time series (e.g. Dodet et al., 2020; Timmermans et al., 2020; Young & Ribal, 2019). These studies highlight a remarkable interannual, seasonal and spatial variability of wave conditions and suggest that the possible observed trends are not clearly associated with anthropogenic forcing (Hochet et al. 2021, 2023). In the North Atlantic, the mean wave height shows some weak trends not very statistically significant. Young & Ribal (2019) found a mostly positive weak trend in the European Coasts while Timmermans et al. (2020) showed a weak negative trend in high latitudes, including the North Sea and even more intense in the Norwegian Sea. For extreme values, some authors have found a clearer positive trend in high percentiles (90th-99th) (Young, 2011; Young & Ribal, 2019). '''COPERNICUS MARINE SERVICE KEY FINDINGS''' The mean 99th percentiles showed in the area present a wide range from 2-3.5m in the Canary Island with 0.1-0.3 m of standard deviation (std), 3.5m in the Gulf of Cadiz with 0.5m of std, 3-6m in the English Channel and the Irish Sea with 0.5-0.6m of std, 4-7m in the Bay of Biscay with 0.4-0.9m of std to 8-10m in the West of the British Isles with 0.7-1.4m of std. Results for this year show slight negative anomalies in the Canary Island (-0.4/0.0m) and in the Gulf of Cadiz (-0.8m) barely out of the standard deviation range in both areas, slight positive or negative anomalies in the West of the British Isles (-0.6/+0.4m) and in the English Channel and the Irish Sea (-0.6/+0.3m) but inside the range of the standard deviation and a general positive anomaly in the Bay of Biscay reaching +1.0m but close to the limit of the standard deviation. '''DOI (product):''' https://doi.org/10.48670/moi-00250
-

-

'''DEFINITION''' Estimates of Ocean Heat Content (OHC) are obtained from integrated differences of the measured temperature and a climatology along a vertical profile in the ocean (von Schuckmann et al., 2018). The products used include three global reanalyses: GLORYS, C-GLORS, ORAS5 (GLOBAL_MULTIYEAR_PHY_ENS_001_031) and two in situ based reprocessed products: CORA5.2 (INSITU_GLO_PHY_TS_OA_MY_013_052) , ARMOR-3D (MULTIOBS_GLO_PHY_TSUV_3D_MYNRT_015_012). Additionally, the time series based on the method of von Schuckmann and Le Traon (2011) has been added. The regional OHC values are then averaged from 60°S-60°N aiming i) to obtain the mean OHC as expressed in Joules per meter square (J/m2) to monitor the large-scale variability and change. ii) to monitor the amount of energy in the form of heat stored in the ocean (i.e. the change of OHC in time), expressed in Watt per square meter (W/m2). Ocean heat content is one of the six Global Climate Indicators recommended by the World Meterological Organisation for Sustainable Development Goal 13 implementation (WMO, 2017). '''CONTEXT''' Knowing how much and where heat energy is stored and released in the ocean is essential for understanding the contemporary Earth system state, variability and change, as the ocean shapes our perspectives for the future (von Schuckmann et al., 2020). Variations in OHC can induce changes in ocean stratification, currents, sea ice and ice shelfs (IPCC, 2019; 2021); they set time scales and dominate Earth system adjustments to climate variability and change (Hansen et al., 2011); they are a key player in ocean-atmosphere interactions and sea level change (WCRP, 2018) and they can impact marine ecosystems and human livelihoods (IPCC, 2019). '''CMEMS KEY FINDINGS''' Since the year 2005, the upper (0-2000m) near-global (60°S-60°N) ocean warms at a rate of 0.9 ± 0.1 W/m2. Note: The key findings will be updated annually in November, in line with OMI evolutions. '''DOI (product):''' https://doi.org/10.48670/moi-00235
-

-

-

'''DEFINITION''' The OMI_EXTREME_SL_IBI_slev_mean_and_anomaly_obs indicator is based on the computation of the 99th and the 1st percentiles from in situ data (observations). It is computed for the variable sea level measured by tide gauges along the coast. The use of percentiles instead of annual maximum and minimum values, makes this extremes study less affected by individual data measurement errors. The annual percentiles referred to annual mean sea level are temporally averaged and their spatial evolution is displayed in the dataset omi_extreme_sl_ibi_slev_mean_and_anomaly_obs, jointly with the anomaly in the target year. This study of extreme variability was first applied to sea level variable (Pérez Gómez et al 2016) and then extended to other essential variables, sea surface temperature and significant wave height (Pérez Gómez et al 2018). '''CONTEXT''' Sea level (SLEV) is one of the Essential Ocean Variables most affected by climate change. Global mean sea level rise has accelerated since the 1990’s (Abram et al., 2019, Legeais et al., 2020), due to the increase of ocean temperature and mass volume caused by land ice melting (WCRP, 2018). Basin scale oceanographic and meteorological features lead to regional variations of this trend that combined with changes in the frequency and intensity of storms could also rise extreme sea levels up to one meter by the end of the century (Vousdoukas et al., 2020, Tebaldi et al., 2021). This will significantly increase coastal vulnerability to storms, with important consequences on the extent of flooding events, coastal erosion and damage to infrastructures caused by waves (Boumis et al., 2023). The increase in extreme sea levels over recent decades is, therefore, primarily due to the rise in mean sea level. Note, however, that the methodology used to compute this OMI removes the annual 50th percentile, thereby discarding the mean sea level trend to isolate changes in storminess. The Iberian Biscay Ireland region shows positive sea level trend modulated by decadal-to-multidecadal variations driven by ocean dynamics and superposed to the long-term trend (Chafik et al., 2019). '''COPERNICUS MARINE SERVICE KEY FINDINGS''' The completeness index criteria is fulfilled by 62 stations in 2023, five more than those available in 2022 (57), recently added to the multi-year product INSITU_GLO_PHY_SSH_DISCRETE_MY_013_053. The mean 99th percentiles reflect the great tide spatial variability around the UK and the north of France. Minimum values are observed in the Irish eastern coast (e.g.: 0.66 m above mean sea level in Arklow Harbour) and the Canary Islands (e.g.: 0.93 and 0.96 m above mean sea level in Gomera and Hierro, respectively). Maximum values are observed in the Bristol Channel (e.g.: 6.25 and 5.78 m above mean sea level in Newport and Hinkley, respectively), and in the English Channel (e.g.: 5.16 m above mean sea level in St. Helier). The annual 99th percentiles standard deviation reflects the south-north increase of storminess, ranging between 1-3 cm in the Canary Islands to 15 cm in Hinkley (Bristol Channel). Negative or close to zero anomalies of 2023 99th percentile prevail throughout the region this year, reaching < -20 cm in several stations of the UK western coast and the English Channel (e.g.: -22 cm in Newport; -21 cm in St.Helier). Significantly positive anomaly of 2023 99th percentile is only found in Arcklow Harbour, in the eastern Irish coast. '''DOI (product):''' https://doi.org/10.48670/moi-00253
-

-

-
-

 Catalogue PIGMA