 Catalogue PIGMA
ocean
Type of resources
Available actions
Topics
Keywords
Contact for the resource
Provided by
Years
Formats
Representation types
Update frequencies
status
Service types
Scale
Resolution
-
EMODnet (Chemical data) Map Server with ocean climatologies.
-
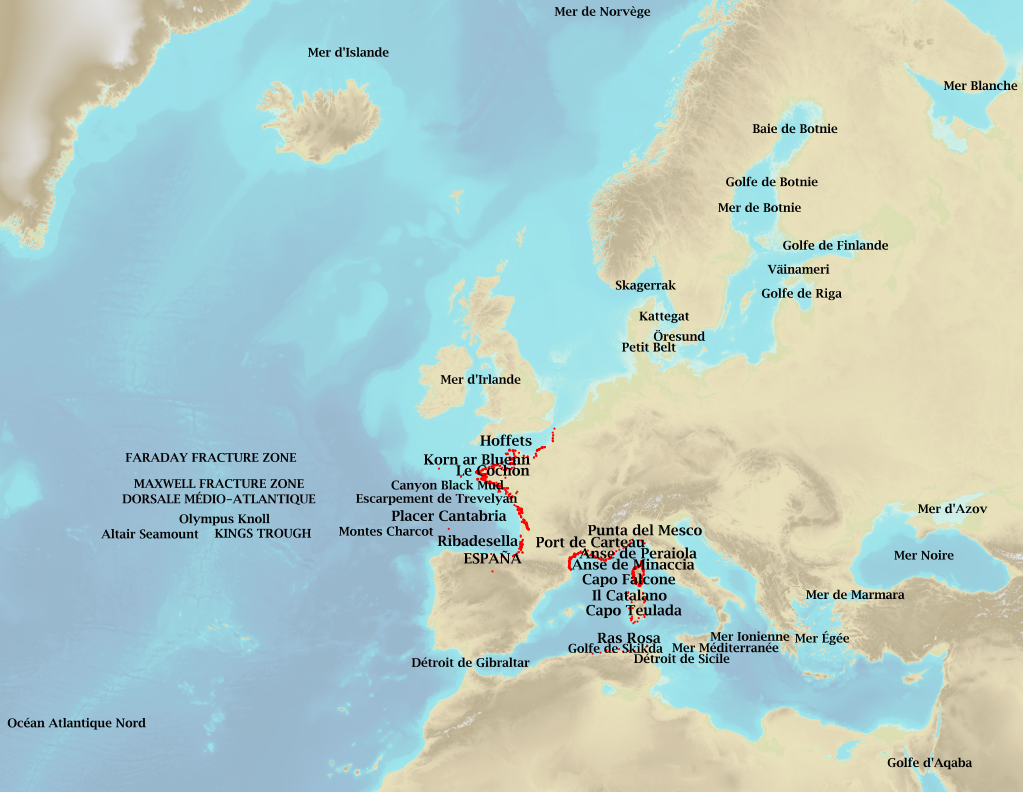
Marine toponymy data layer obtained from French ENC and created using the S23 (4th edition, June 2002). Note: The usual Sea of Japan designation does not imply taking a stand in the dispute between Korea, which names this sea "East Sea", and Japan, which names it "Sea of Japan".
-
The SARWAVE project is developing a new sea state processor from SAR images to be applied over open ocean, sea ice, and coastal areas, and exploring potential synergy with other microwave and optical EO products.
-

Global mean sea level is an integral of changes occurring in the climate system in response to unforced climate variability as well as natural and anthropogenic forcing factors. Its temporal evolution allows detecting changes (e.g., acceleration) in one or more components. Study of the sea level budget provides constraints on missing or poorly known contributions, such as the unsurveyed deep ocean or the still uncertain land water component. In the context of the World Climate Research Programme Grand Challenge entitled “Regional Sea Level and Coastal Impacts”, an international effort involving the sea level community worldwide has been recently initiated with the objective of assessing the various data sets used to estimate components of the sea level budget during the altimetry era (1993 to present). These data sets are based on the combination of a broad range of space-based and in situ observations, model estimates and algorithms. Evaluating their quality, quantifying uncertainties and identifying sources of discrepancies between component estimates is extremely useful for various applications in climate research. This effort involves several tens of scientists from about sixty research teams/institutions worldwide (www.wcrp-climate.org/grand-challenges/gc-sea-level). The results presented in this paper are a synthesis of the first assessment performed during 2017-2018. We present estimates of the altimetry-based global mean sea level (average rate of 3.1 +/- 0.3 mm/yr and acceleration of 0.1 mm/yr2 over 1993-present), as well as of the different components of the sea level budget. We further examine closure of the sea level budget, comparing the observed global mean sea level with the sum of components. Ocean thermal expansion, glaciers, Greenland and Antarctica contribute by 42%, 21%, 15% and 8% to the global mean sea level over the 1993-present. We also study the sea level budget over 2005-present, using GRACE-based ocean mass estimates instead of sum of individual mass components. Results show closure of the sea level budget within 0.3 mm/yr. Substantial uncertainty remains for the land water storage component, as shown in examining individual mass contributions to sea level.
-

The SARWAVE project is developing a new sea state processor from SAR images to be applied over open ocean, sea ice, and coastal areas, and exploring potential synergy with other microwave and optical EO products.
-
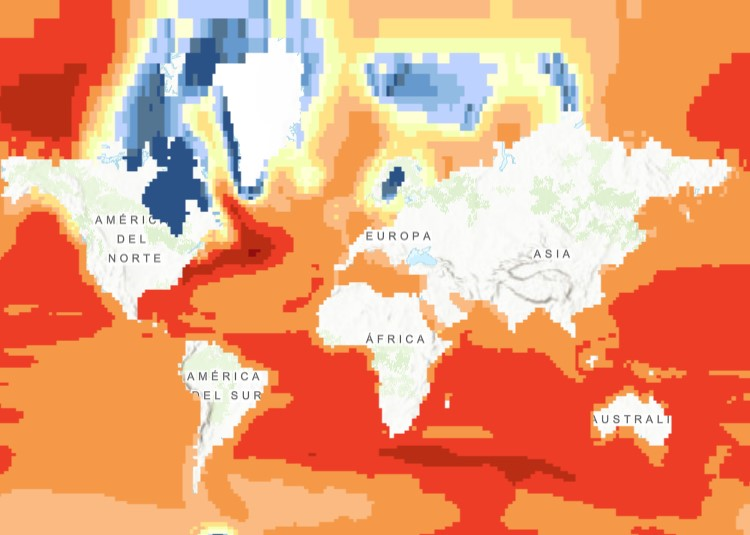
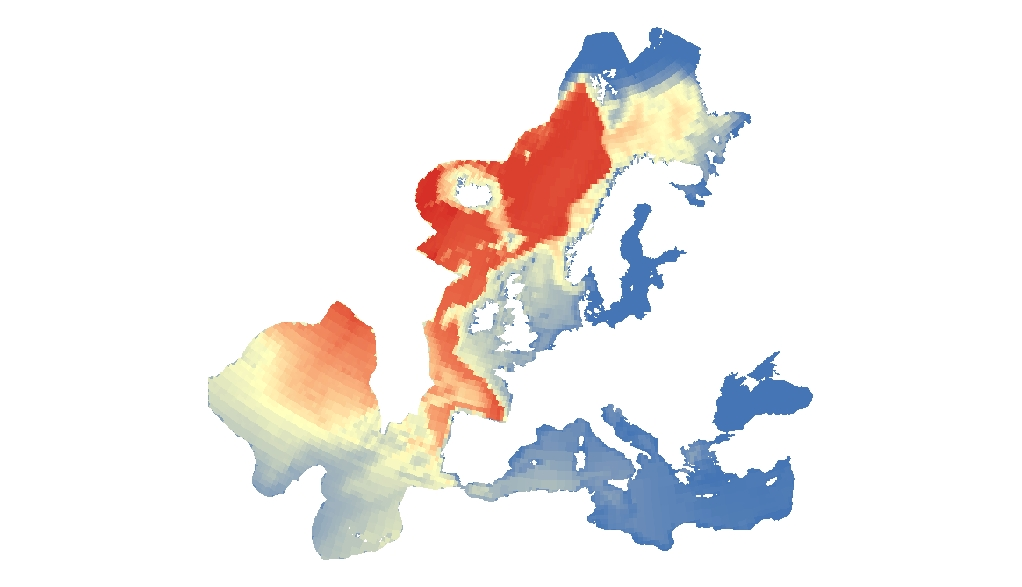
The raster dataset (1ºx1º) shows the projected change in relative sea level (in metres) in 2081-2100 compared to 1986-2005 for the medium-low emission scenario RCP4.5, based on an ensemble of Coupled Model Intercomparison Project Phase 5 (CMIP5) climate models. Projections consider land movement due to glacial isostatic adjustment but not land subsidence due to human activities. No projections are available for the Black Sea. The dataset has been used as a source for an earlier version of the EEA indicator “Global and European Sea Level”: https://www.eea.europa.eu/data-and-maps/indicators/sea-level-rise-5/assessment.
-
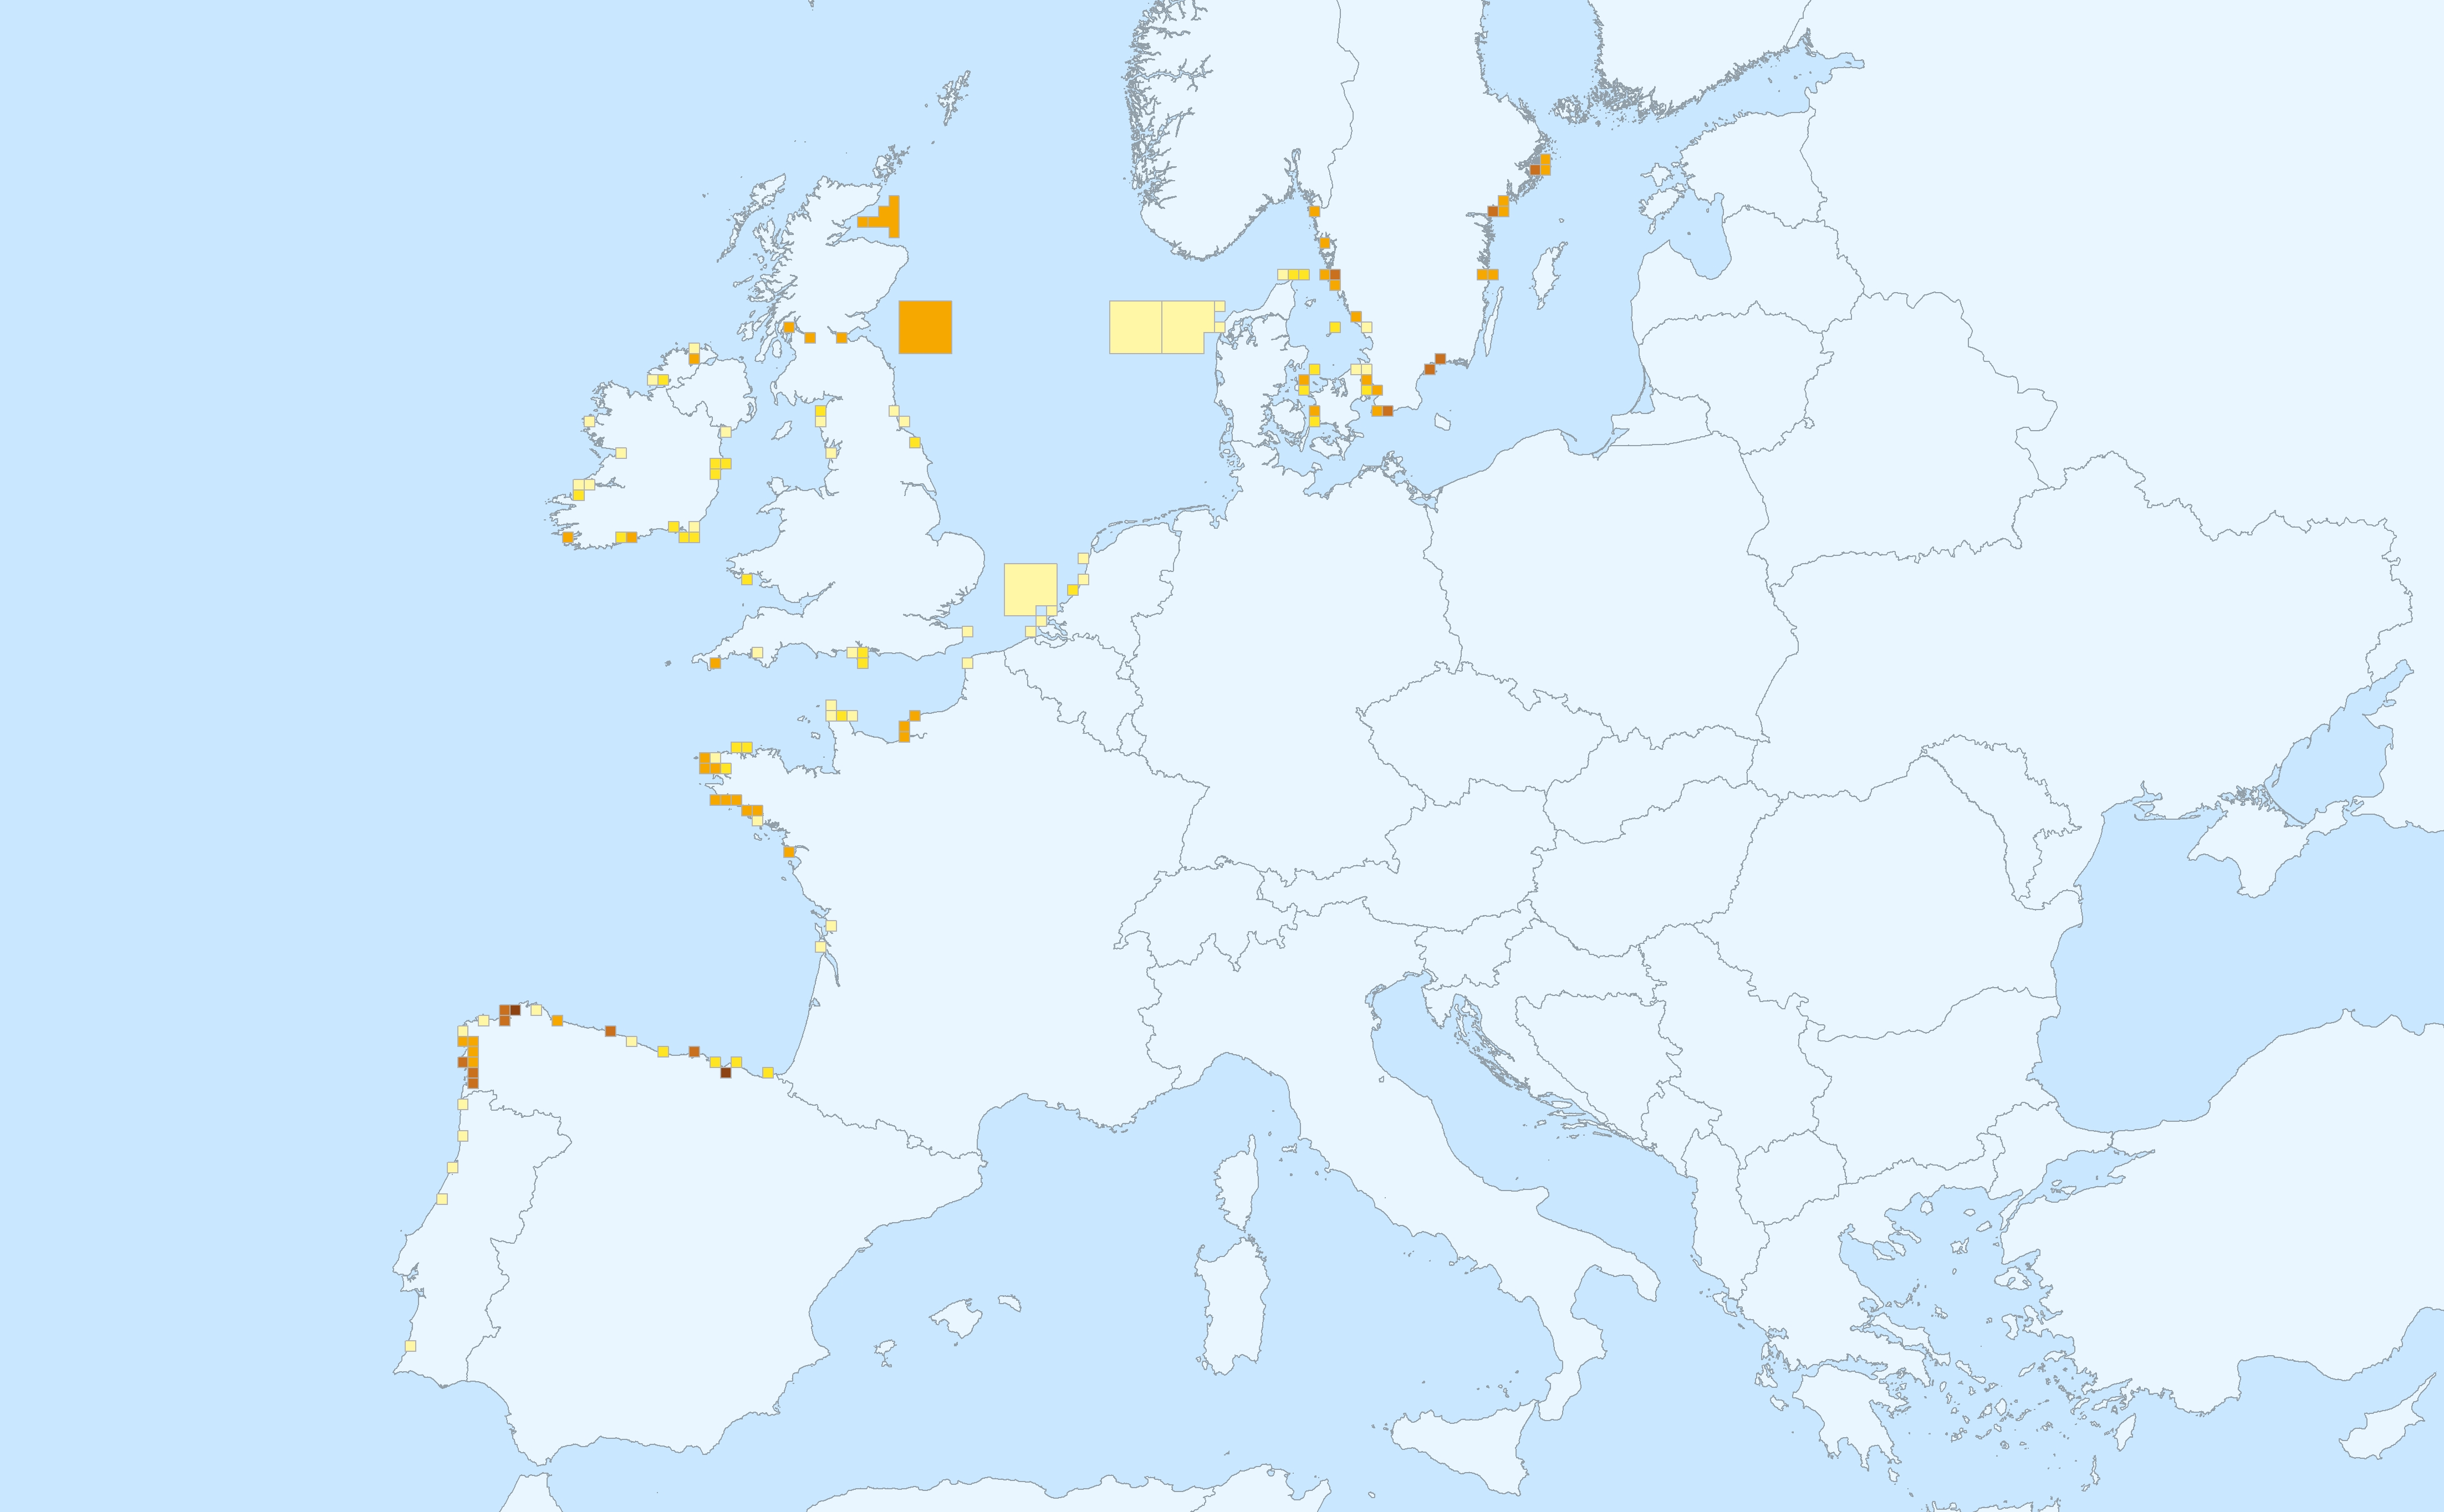
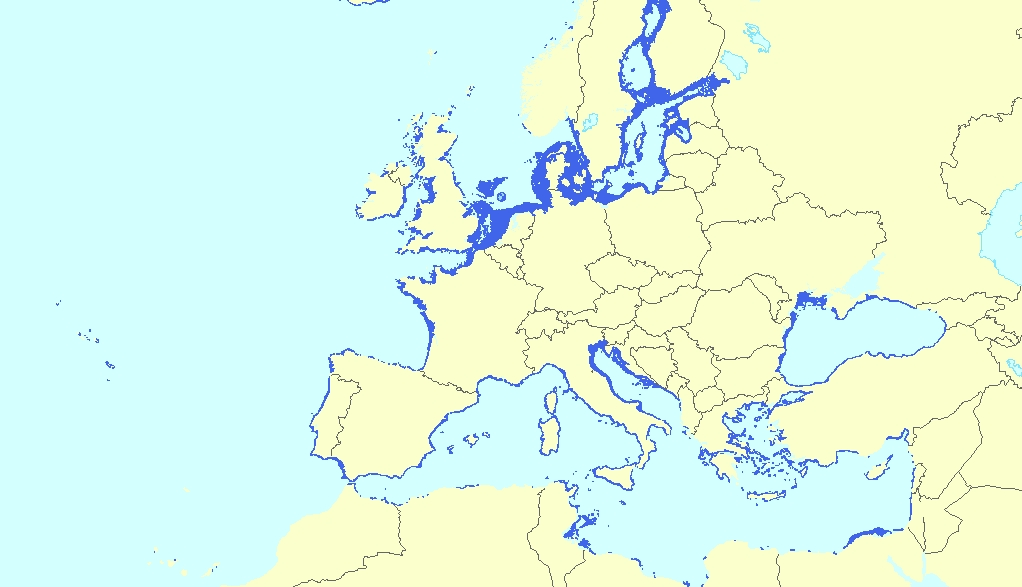
This data set presents the resulting assessment grid (based on the EEA reference grid) with the classification of chemical status of the transitional, coastal and marine waters in the context of the Water Framework Directive (WFD) and the Marine Strategy Framework Directive (MSFD), providing a mapping of contamination 'problem areas' and 'non-problem areas' based on measurements of biological effects. This classification has been performed using the CHASE+ tool, with classifications of the of contaminant status of indicators of biological effects. The status is evaluated in five classes, where NPAhigh and NPAgood are recognised as ‘non-problem areas’ and PAmoderate, PApoor and PAbad are recognised as ‘problem areas’. Monitoring biological effects is restricted to a few indicators (e.g. imposex) and data coverage is currently limited. Biological effects have thus been addressed in only 134 assessment units, mostly in the Baltic Sea, the North Sea and the North-East Atlantic Ocean. This data set underpins the findings and cartographic representations published in the EEA report “Contaminants in Europe’s seas” (No 25/2018). See the mentioned report for further information.
-
This raster dataset represents the probability of occurrence of whales in the Europe Seas, where the species included are: Blue whale, Sei whale, Humpback whale, Sperm whale, Fin whale and Northern right whale. The northern right whale model only describes the range of the western population of this species, since the eastern population is probably almost extinct. Thus, the northern right whale model only partly overlaps with the EEA area on interest. This dataset is based on AquaMaps distribution maps (version 10/2019). The dataset has been prepared in the context of the development of the first European Maritime Transport Environmental Report (EMSA-EEA report, 2021: https://www.eea.europa.eu/publications/maritime-transport).
-
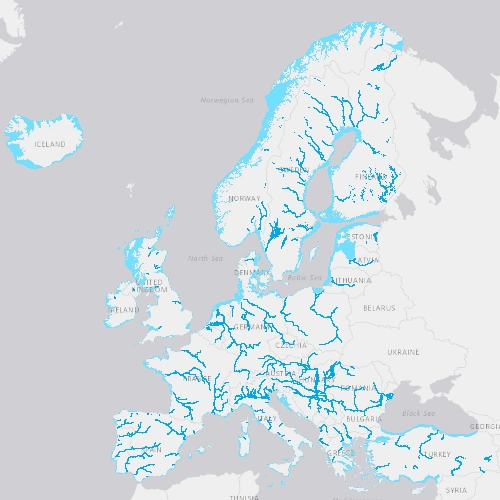
EU-Hydro is a dataset for all EEA38 countries and the United Kingdom providing photo-interpreted river network, consistent of surface interpretation of water bodies (lakes and wide rivers), and a drainage model (also called Drainage Network), derived from EU-DEM, with catchments and drainage lines and nodes. The EU-Hydro dataset is distributed in separate files (river network and drainage network) for each of the 35 major basins of the EEA38 + UK area, in GDB and GPKG formats. The production of EU-Hydro and the derived layers was coordinated by the European Environment Agency in the frame of the EU Copernicus programme.
-
This vector dataset represents the benthic broad habitat types in Europe Seas potentially affected by the ship wakes. When navigating, the propellers of ships generate a turbulent mixing of the water that can produce sediment re-suspension in soft bottoms of shallow areas. This can increase the turbidity in those areas, affecting the seafloor organisms (especially those that are directly dependent on light, such as aquatic plants). It may also contribute to an increase of the the eutrophication level of the ecosystem (since the turbid waters may become warmer, which may turn into a reduction of dissolved oxygen in water). Finally, turbidity can produce an increase in the inputs of contaminants and microbial pathogens, since those can become attached to the suspended solids. The dataset has been prepared in the context of the development of the first European Maritime Transport Environmental Report (https://www.eea.europa.eu/publications/maritime-transport).