 Catalogue PIGMA
in situ
Type of resources
Available actions
Topics
Keywords
Contact for the resource
Provided by
Years
Formats
Representation types
Update frequencies
Scale
Resolution
-

Monthly time series of Water Discharge (Qw) [m3/s] from in situ and model data
-
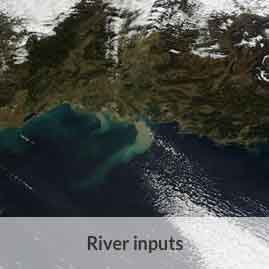
Annual time series of Water Discharge (Qw) [m3/s] from in situ and model data
-

Annual time series of Total Nitrogen/Nitrates [mg/l] from in situ and model data
-

Annual time series of Total Phosphorous/Phosphates [mg/l] from in situ and model data
-

The Argo program provides an unprecedented volume of oceanographic data, yet the complexity of its dataset — involving multiple data modes, quality control flags, and metadata conventions — often hinders its direct usage. The EasyOneArgo initiative addresses this challenge by delivering simplified, high-quality subsets of Argo data, specifically designed to streamline user access and integration. The EasyOneArgo data product is comprised of 4 datasets: - EasyOneArgoTS – A curated selection of temperature-salinity profiles filtered by strict quality criteria and optimized across raw, real-time adjusted, and delayed-mode status. - EasyOneArgoTSLite – The vertically interpolated counterpart of EasyOneArgoTS, with standardized pressure levels between 2 and 6000 dbar. - EasyOneArgoBGC – A curated selection of biogeochemical profiles filtered by strict quality criteria. The BGC parameters include DOXY, NITRATE, PH, CHLA, BBP, and various radiometry parameters. All BGC data are adjusted either in real-time or in delayed-mode. Accompanying TS measurements are also included. - EasyOneArgoBGCLite – The vertically interpolated counterpart of EasyOneArgoBGC, with the same standardized pressure levels as EasyOneArgoTSLite. Note: The BGC vertical interpolation process involves pre-filtering the original data before interpolation. Hence the magnitudes of some of the features are modulated in the BGCLite dataset. Each profile in EasyOneArgo is packaged as a standalone CSV file, with metadata and indexes for seamless retrieval. This work represents a user-centric shift in Argo data delivery: no QC flags, no data modes, no data manuals — just good, clean, structured ocean data ready for immediate scientific application. The EasyOneArgo data product is publicly available through monthly FAIR-compliant releases. We invite community feedback for continued refinement. Please send any comments to Annie Wong (apsw.uw@gmail.com) or Thierry Carval (Thierry.Carval@ifremer.fr).
-
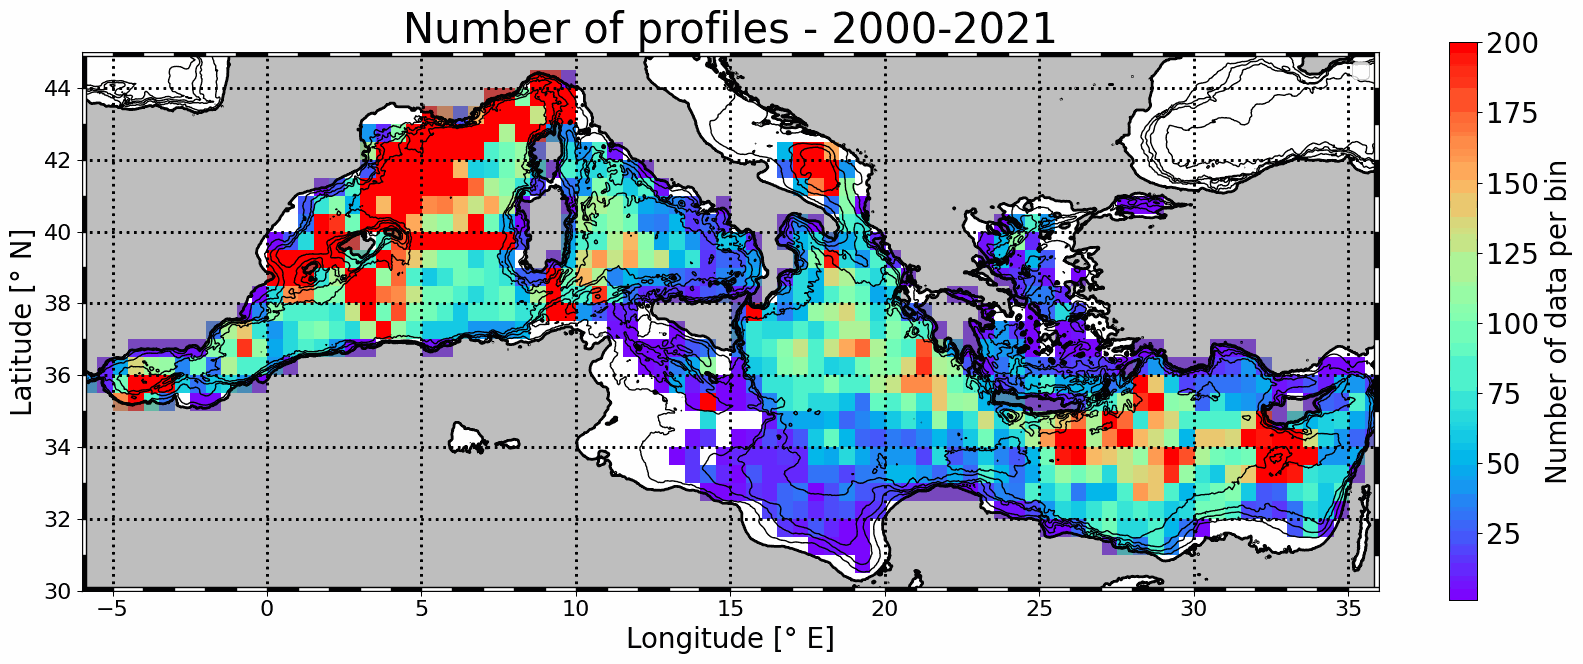
Mesoscale eddy detection from 2000 to 2021 are computed using the AMEDA algorithm applied on AVISO L4 absolute dynamic topography at 1/8th degree. Eddy numbers correspond to tracks referenced in the DYNED atlas (https://doi.org/10.14768/2019130201.2). Detection is based on AVISO delyed-time product from 2000 to 2019 and on day+6 near-real-time altimetry from 2020 to 2021. Colocalisation is then made with available in situ profiles from Coriolis Ocean Dataset for Reanalysis (CORA) delayed-time data (113486 profiles) and Copernicus near-real-time profiles (43567).
-
This dataset is an aggregation of all availale in situ data from Coriolis and Copernicus in situ data centres, observed in the French DCSMM area. It contains 5167 NetCDF CF files from 1903 to 2017. Each file contains the observations of a specific platform (e.g. vessel, mooring site, sea level station). Observed parameters are temperature, salinity, pressure, oxygen, nitrate, chlorophyll (and other bio-geo-chemicals), current, wave, sea level, river flow.
-
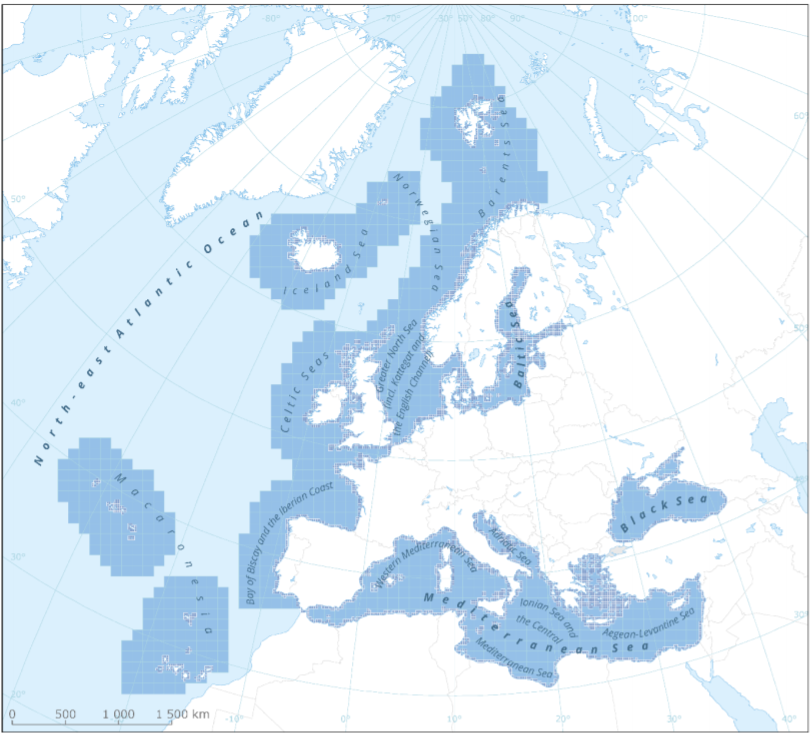
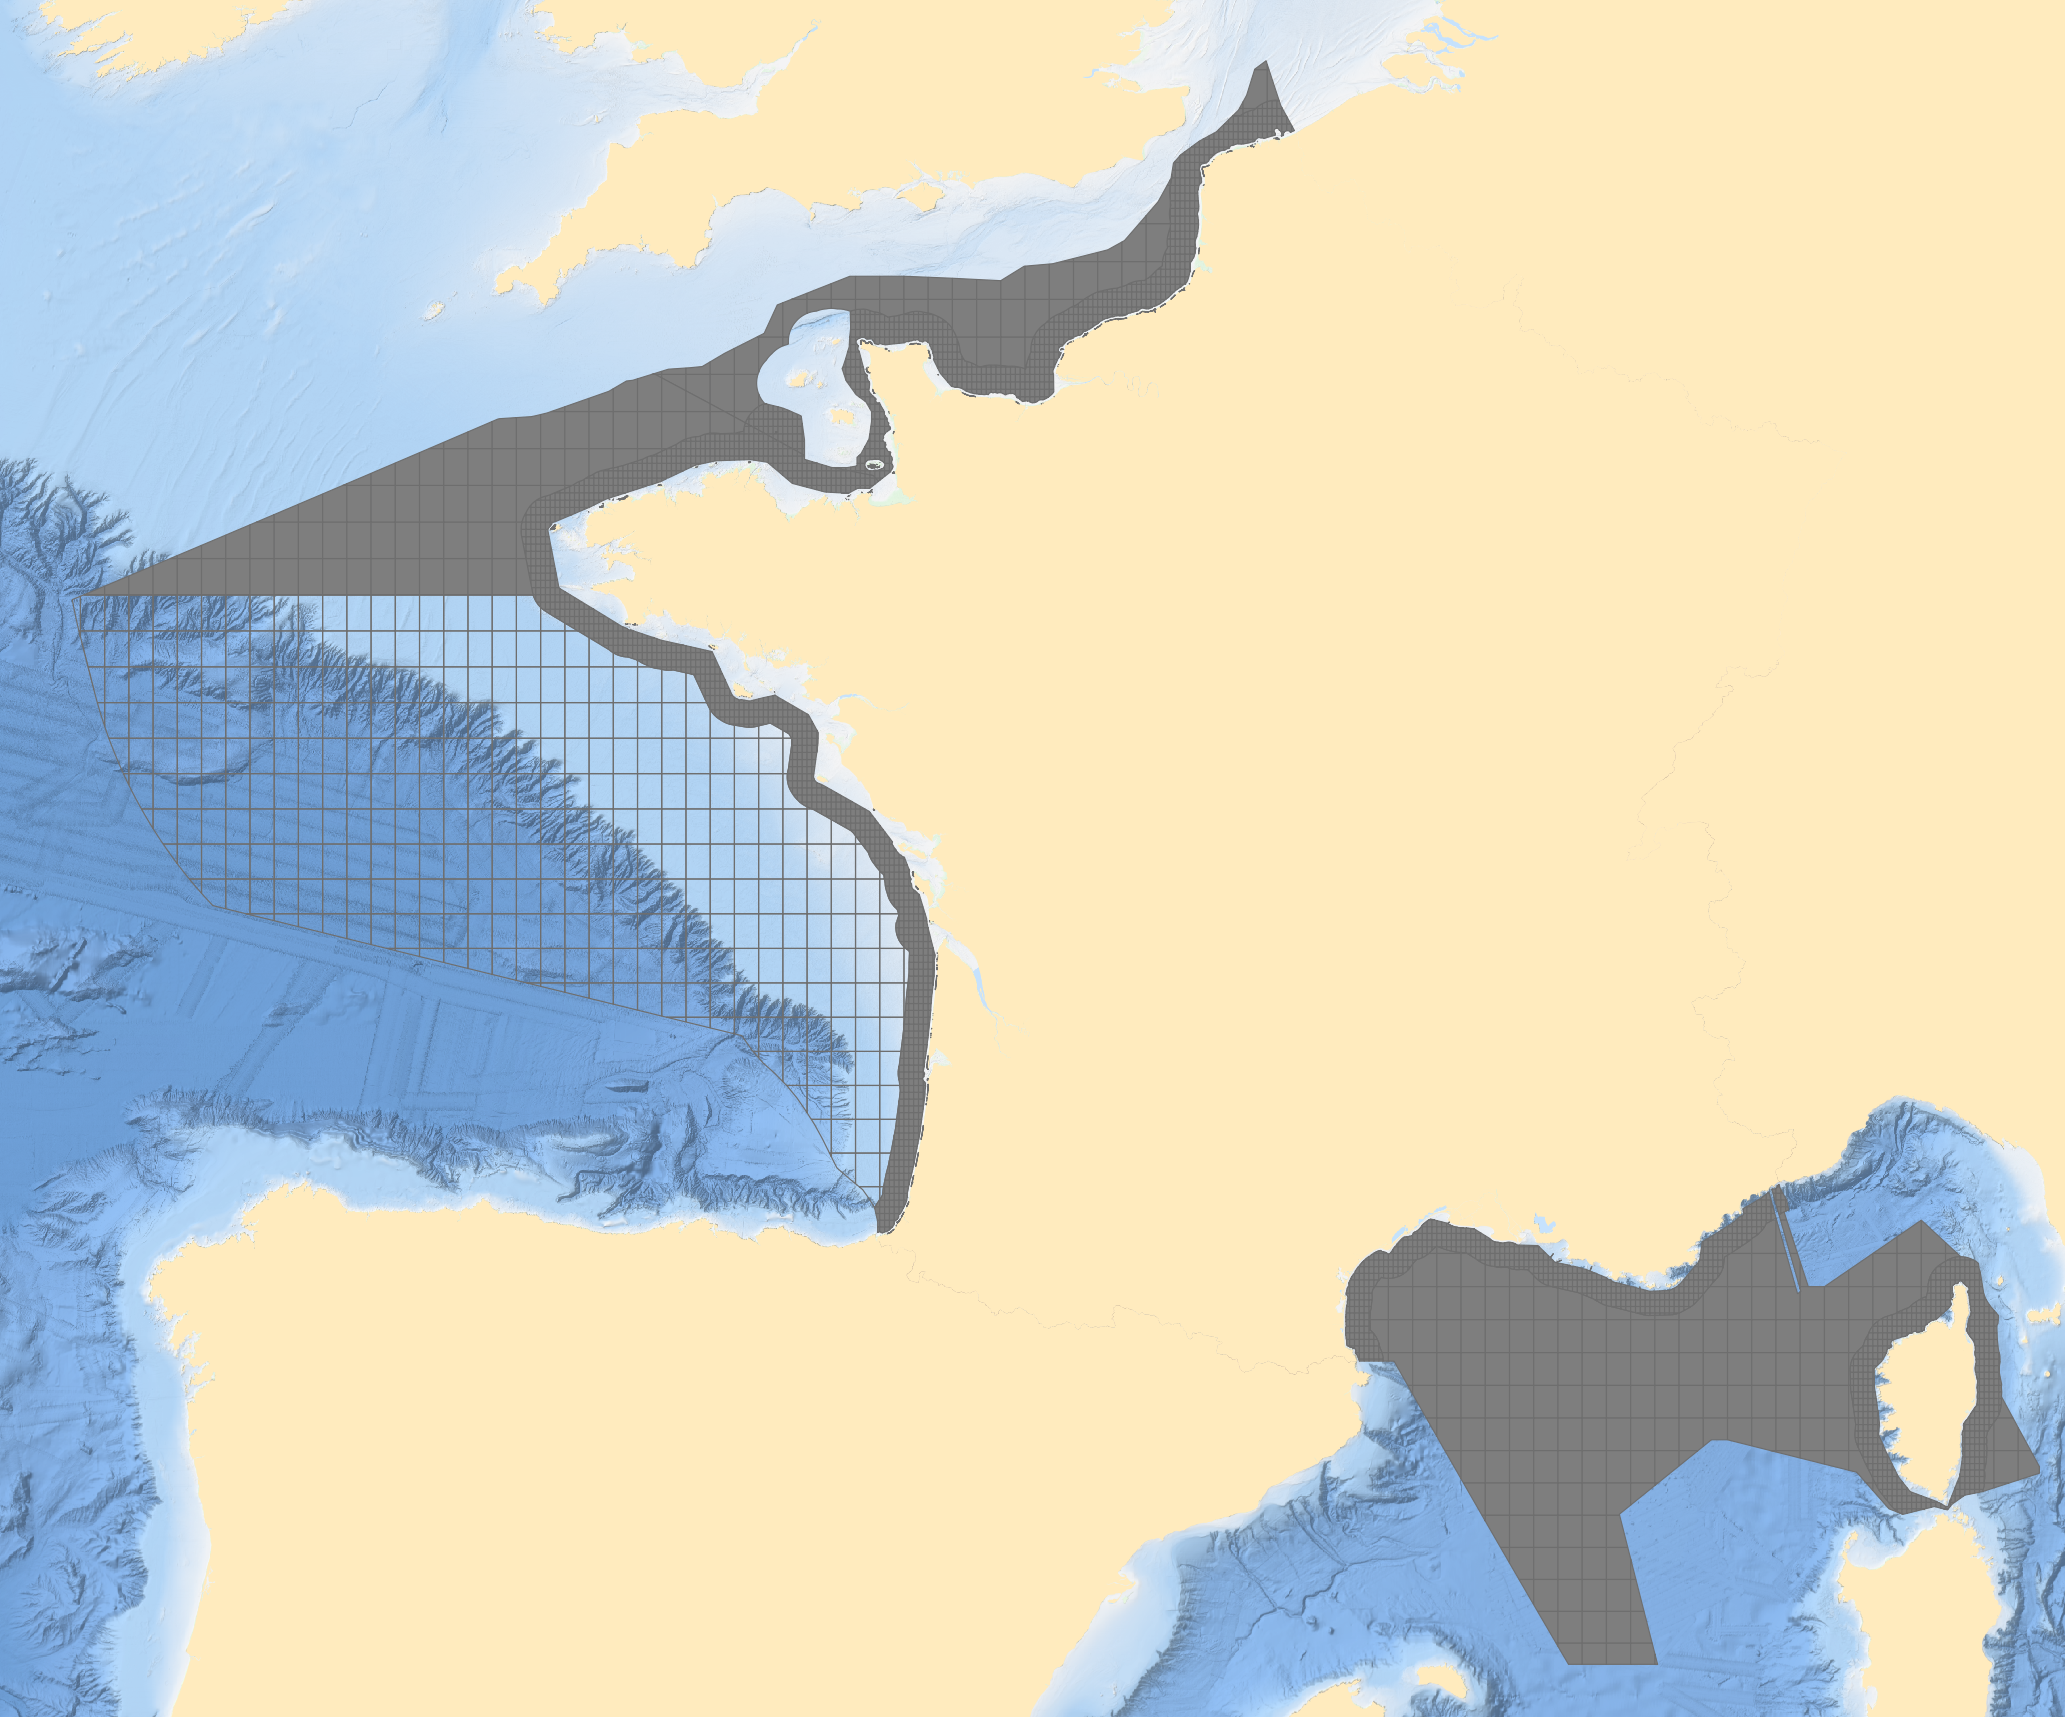
This metadata refers to the EEA marine assessment grid, to which all data and assessment results have been spatially mapped in order to ensure that data can be compared in a uniform way across the European regional seas. The marine assessment grid is based on the EEA reference grid system. The EEA reference grid is based on ERTS89 Lambert Azimuthal Equal Area projection with parameters: latitude of origin 52° N, longitude of origin 10° E, false northing 3 210 000.0 m, false easting 4 321 000.0 m. All grid cells are named with a unique identifier containing information on grid cell size and the distance from origin in meters (easting and northing). An important attribute of the EEA reference grid system is that by using an equal area projection all grid cells are having the same area for the same grid size. In this marine assessment grid, two grid sizes are used: * 100 x 100 km in offshore areas (> 20 km from the coastline) * 20 x 20 km in coastal areas (<= 20 km from the coastline) The grid sizes were choosen after an evaluation of data availability versus the need for sufficient detail in the resulting assessment. The resulting assessment grid is a combination of two grid sizes using the EEA reference grid system. The overall area of interest used in the grid is based on the marine regions and subregions under the Marine Strategy Framework Directive (MSFD). Additionally, Norwegian (Barent Sea and Norwegian Sea) and Icelandic waters (’Iceland Sea’) have been added (see Surrounding seas of Europe). Note that, within the North East Atlantic region, only the subregions within EEZ boundaries (~200 nm) have been included.
-
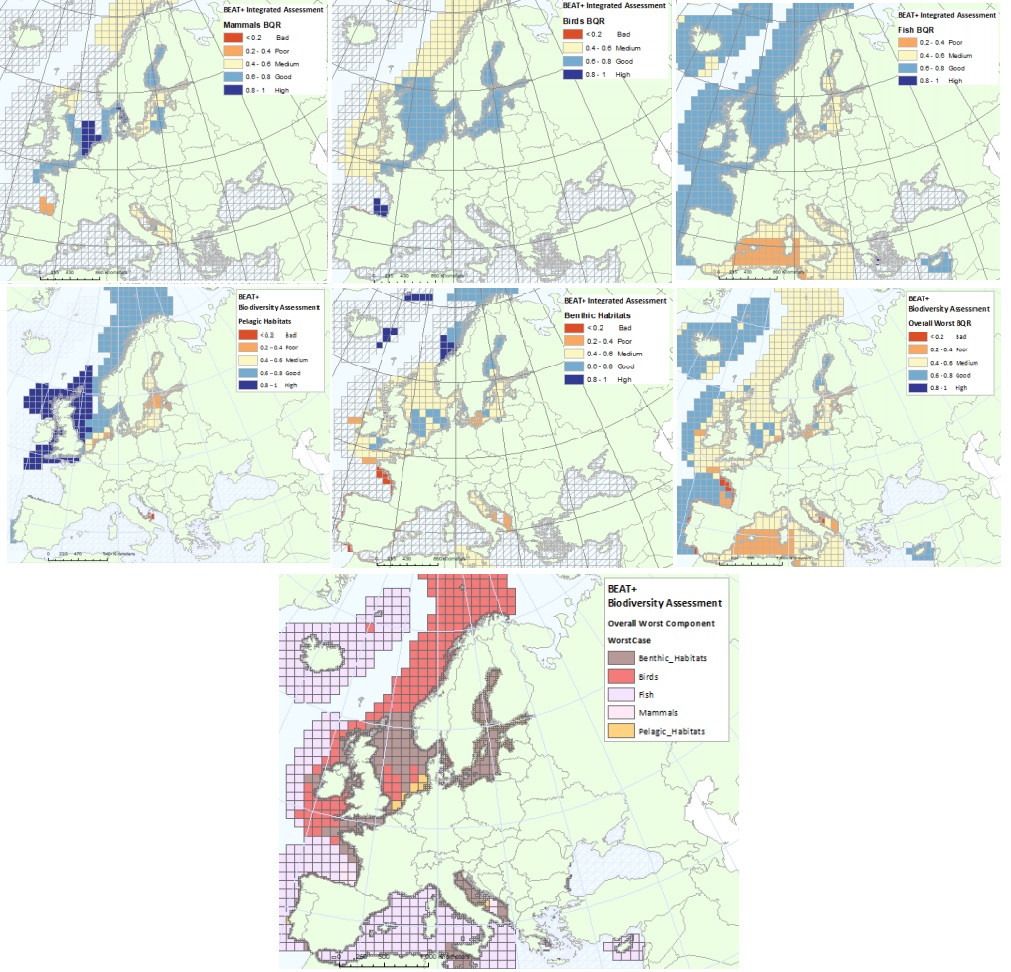
The BEAT+ tool builds on the EEA assessment tools developed and applied in the context of assessing the degree of contamination (CHASE+), eutrophication (HEAT+) and biodiversity (BEAT+) in Europe's seas. BEAT+ makes use of the same data sets and threshold values used in these assessments but recombines these in a new framework that addresses 'biodiversity condition'. BEAT+ has been designed to provide an assessment of the spatial variability of a range of biodiversity components by combining existing biodiversity indicators. The tool integrates data from normalised indicators to identify worst case status measures for different biodiversity components. The results are then linked to a standard gridE based Spatial Assessment Unit (SAU) which is used both for biodiversity and for pressures assessments (Andersen et al., 2014). These grid-based SAUs not only allow alignment of indicators for biodiversity and for pressures but provide a means for combining large assessment areas (e.g. for wide‐ranging species) with point data collected from biological surveys e.g. WFD monitoring. BEAT+ tool works by calculating a Biological Quality Ratio (BQR) which is an aggregated score of indicator outcomes within a grid square. To allow objective comparison, the indicator outcomes are normalised to a scale of 0 to 1, with five status classes at equal intervals on that scale (from Bad starting at 0, Poor at 0.2, Medium at 0.4, Good at 0.6 and High at 0.8). By this means, indicators based on different biological criteria can be aggregated in a consistent way. This metadata refers to dataset providing the results of classification of biodiversity status using the BEAT+ tool. The status is evaluated in five classes, where High and Good are recognised as ‘non-problem areas’ and Moderate, Poor and Bad are recognised as ‘problem areas’. The dataset covers: - BQR Assessment of all marine mammals combined (mainly focused on coastal and relatively stable inshore populations of seals, dolphins and porpoises) - BQR Assessment of seabirds and wading birds - BQR Assessment of commercial fish (as these have agreed targets defined on biomass and fishing mortality) - BQR Assessment of pelagic habitats - BQR Assessment of benthic habitats - BQR Assessment of worst-performing biodiversity groups - An overall synthesis of the Biological Quality Ratios (BQR) values (showing which are the worst -lowest- BQR values in each assessment grid cell. The ‘worst’ value is used here to identify the biological group most at risk, rather than averaging over all groups to avoid over-emphasis on groups with more intensive monitoring). As reference, please consult the ETC/ICM Report 3/2019: Biodiversity in Europe's seas: https://www.eionet.europa.eu/etcs/etc-icm/products/biodiversity-in-europes-seas. The indicator BEAT+ Integrated Assessment Worst Case BQR has been used in the EEA report 17/2019 "Marine Messages II": https://www.eea.europa.eu/publications/marine-messages-2.
-
Les abondances de macroalgues opportunistes s'échouant sur les côtes constituent l'un des critères de définition de l'eutrophisation dans le cadre de la DCSMM (D5C6). Trois indices composés chacun de différentes métriques, qui sont fonction du type de substrat sur lesquels les macroalgues se dévéloppent et s'échouent, interviennent dans l'évaluation de l'atteinte du bon état écologique pour ce critère. Ils ont été développés par le CEVA (Centre d'Etude et de Valorisation des Algues). Ces 3 types de substrat sont : type 1 - algues opportunistes se développant dans les baies sableuses et dont les dépôts sont mobiles, type 2 - algues opportunistes ayant une phase de croissance fixée sur les platiers rocheux avant d’être arrachées et de venir s’échouer sur les plages, type 3 - algues opportunistes se développant sur substrat majoritairement vaseux avec des dépôts peu mobiles. Les indices sont calculés par unité géographique d'évaluation et pour la période comprise dans le cycle DCSMM (2010-2016). Les unités géographiques d'évaluation dans lesquelles ce critère est évalué sont les masses d'eau DCE (MEC) entre 0 et 1 Mille marin de la ligne de base, ce critère n'est pas pertinent pour les eaux plus au large. Les données sont présentées sous forme de fichiers géoréférencés de type shp. Le critère de bon état est que les concentrations ne sont pas à des niveaux indiquant des effets néfastes. - Pour la SRM MMN : sur les 24 MEC, 17 ont été évaluées et 3 n'atteignent pas le BEE pour ce critère. - Pour la SRM MC : sur les 15 MEC, 9 ont été évaluées et 4 n'atteignent pas le BEE pour ce critère. - Pour la SRM GdG : sur les 34 MEC, 21 ont été évaluées et 3 n'atteignent pas le BEE pour ce critère (7 MEC ne sont pas pertinentes pour ce critère). L'évaluation de ce critère n'est pas pertinent dans la SRM MO.