 Catalogue PIGMA
environment
Type of resources
Available actions
Topics
Keywords
Contact for the resource
Provided by
Years
Formats
Representation types
Update frequencies
status
Scale
Resolution
-

Les ministères chargés de l'écologie (Meeddm) et de l'agriculture (Maap) ont confié au Gip Ecofor une mission d'expertise collective scientifique et technique à visée prospective sur « l'avenir du massif forestier des Landes de Gascogne ». Son objectif est de mobiliser la connaissance autour d'options envisageables pour assurer l'avenir du massif forestier landais et de la partager avec l'ensemble des parties intéressées. Les document disponibles sont les rapports finaux des groupes de travail et d'experts.
-
L’objectif de cette étude est d’illustrer à l’aide d’indicateurs les conséquences de choix de gestion imposés par cinq scénarios socioéconomiques prospectifs appliqués à une large zone forestière pour les 60 prochaines années. Le cas d’étude choisi est la zone centrée sur la commune de Pontenx-les-Forges dans le sud-ouest de la France et couvrant 101000 hectares. Cet article présente une description de la zone d’étude et des itinéraires sylvicoles mis en œuvre par les propriétaires forestiers selon des scénarios. À l’aide d’un simulateur pilotant deux modèles de croissance, l’évolution de la zone d’étude à l’échelle de chaque parcelle est synthétisée par 9 indicateurs sur une période de 60 ans : le volume sur pied, le carbone sur pied, le volume total exploité, la valeur commerciale sur pied, le volume de l’arbre moyen, la vulnérabilité au vent et au feu, et des indices de biodiversité. Un des principaux résultats de cette étude est de montrer l’amplitude des changements pour la production et le volume sur pied : selon les scénarios les récoltes annuelles peuvent varier de 50 % dès 2030. Par conséquent, d’autres indicateurs sont impactés comme la biodiversité, la vulnérabilité au vent ou au feu. Pourtant, l’espèce dominante est maintenue et le comportement partiellement conservateur des types de propriétaires est pris en compte. En conclusion, des améliorations pour de futures simulations sont envisagées ; dans ce but, des synergies avec la télédétection sont nécessaires pour la collecte des données d’initialisation sur de larges territoires, ce qui permettra d’améliorer la précision des résultats.
-

Première utilisation du sol, devant l'agriculture et loin devant l'urbanisme, la forêt couvre 45 % du territoire aquitain. La région se caractérise par la domination d'une essence, le pin maritime. Celui-ci couvre plus de la moitié de la surface forestière régionale. Outre sa valeur patrimoniale, cette forêt génère une activité économique qui représente environ 3 milliards d'euros. Ce secteur forêt-bois est donc un formidable gisement d'emplois, principalement en milieu rural. Cet espace occupé par la forêt attise néanmoins des convoitises pour différents types d'usage: l'urbanisation, les installations photovoltaïques ou encore l'agriculture.
-

L’objectif général de ce projet de thèse est d’analyser et d’évaluer les données sources (actuelles et potentielles) des matrices de changements d’occupation du sol afin d’améliorer la robustesse de l’inventaire. Il s’agit d’expertiser par une démarche scientifique la pertinence des travaux réalisés annuellement pour l’inventaire UTCATF. En particulier, il s’agit de comprendre les causes des incertitudes des données sources ; compiler les données disponibles et leurs métadonnées ; étudier qualitativement les dynamiques paysagères décrites ; et redéfinir un cadre méthodologique permettant d’estimer des taux de changements plus pertinent.
-
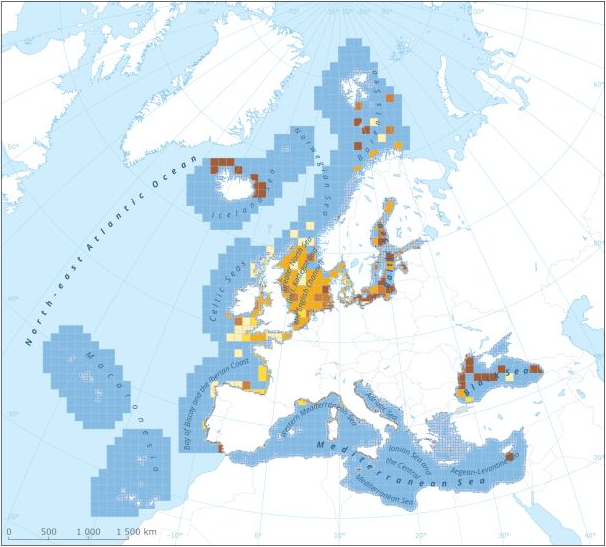
This dataset presents the resulting assessment grid (based on the EEA reference grid) with the classification of chemical status of the transitional, coastal and marine waters in the context of the Water Framework Directive (WFD) and the Marine Strategy Framework Directive (MSFD). This classification has been performed using the CHASE+ tool, with classifications of the matrices ‘water’, ‘sediment’ and ‘biota’ and indicators of ‘biological effects’, as well as an integrated classification of chemical status, combining results of all matrices. The chemical status is evaluated in five classes, where NPAhigh and NPAgood are recognised as ‘non-problem areas’ and PAmoderate, PApoor and PAbad are recognised as ‘problem areas’. This is the assessment made excluding concentrations of mercury (Hg) and polybrominated diphenyl ethers (PBDEs) The overall area of interest used is based on the marine regions and subregions under the Marine Strategy Framework Directive. Additionally, Norwegian (Barent Sea and Norwegian Sea) and Icelandic waters (’Iceland Sea’) have been added (see Surrounding seas of Europe). Note that within the North East Atlantic region only the subregions within EEZ boundaries (~200 nm) have been included. This dataset underpins the findings and cartographic representations published in the report "Contaminants in Europe's Seas" (EEA, 2019): https://www.eea.europa.eu/publications/contaminants-in-europes-seas.
-
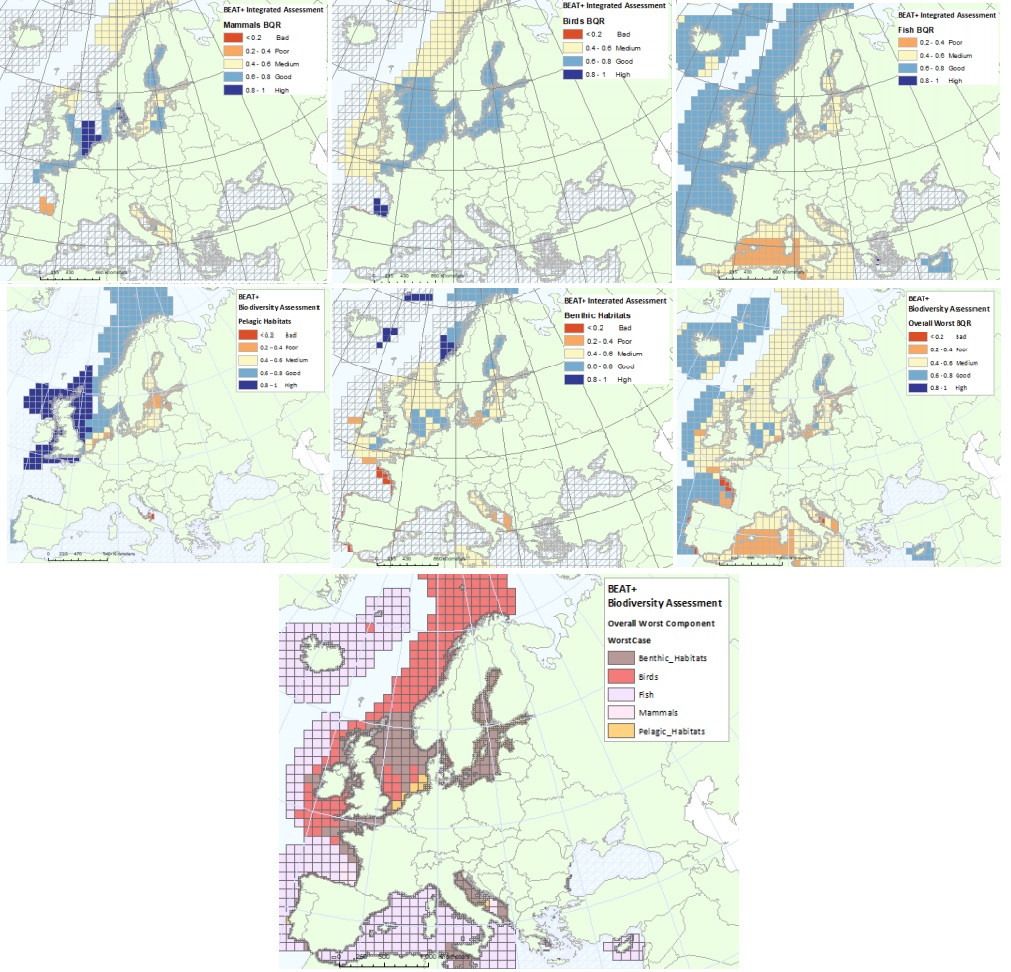
The BEAT+ tool builds on the EEA assessment tools developed and applied in the context of assessing the degree of contamination (CHASE+), eutrophication (HEAT+) and biodiversity (BEAT+) in Europe's seas. BEAT+ makes use of the same data sets and threshold values used in these assessments but recombines these in a new framework that addresses 'biodiversity condition'. BEAT+ has been designed to provide an assessment of the spatial variability of a range of biodiversity components by combining existing biodiversity indicators. The tool integrates data from normalised indicators to identify worst case status measures for different biodiversity components. The results are then linked to a standard gridE based Spatial Assessment Unit (SAU) which is used both for biodiversity and for pressures assessments (Andersen et al., 2014). These grid-based SAUs not only allow alignment of indicators for biodiversity and for pressures but provide a means for combining large assessment areas (e.g. for wide‐ranging species) with point data collected from biological surveys e.g. WFD monitoring. BEAT+ tool works by calculating a Biological Quality Ratio (BQR) which is an aggregated score of indicator outcomes within a grid square. To allow objective comparison, the indicator outcomes are normalised to a scale of 0 to 1, with five status classes at equal intervals on that scale (from Bad starting at 0, Poor at 0.2, Medium at 0.4, Good at 0.6 and High at 0.8). By this means, indicators based on different biological criteria can be aggregated in a consistent way. This metadata refers to dataset providing the results of classification of biodiversity status using the BEAT+ tool. The status is evaluated in five classes, where High and Good are recognised as ‘non-problem areas’ and Moderate, Poor and Bad are recognised as ‘problem areas’. The dataset covers: - BQR Assessment of all marine mammals combined (mainly focused on coastal and relatively stable inshore populations of seals, dolphins and porpoises) - BQR Assessment of seabirds and wading birds - BQR Assessment of commercial fish (as these have agreed targets defined on biomass and fishing mortality) - BQR Assessment of pelagic habitats - BQR Assessment of benthic habitats - BQR Assessment of worst-performing biodiversity groups - An overall synthesis of the Biological Quality Ratios (BQR) values (showing which are the worst -lowest- BQR values in each assessment grid cell. The ‘worst’ value is used here to identify the biological group most at risk, rather than averaging over all groups to avoid over-emphasis on groups with more intensive monitoring). As reference, please consult the ETC/ICM Report 3/2019: Biodiversity in Europe's seas: https://www.eionet.europa.eu/etcs/etc-icm/products/biodiversity-in-europes-seas. The indicator BEAT+ Integrated Assessment Worst Case BQR has been used in the EEA report 17/2019 "Marine Messages II": https://www.eea.europa.eu/publications/marine-messages-2.
-
Rapport final ONF
-

List of fish stocks referenced for the year 2018. The repository includes 477 stocks. Each stock is identified by a unique key in accordance with the ICES codification in use. Each record contains a stock identifier, a species or group of species identifier according to the ASFIS/FAO classification, the English stock name, the Latin name of the species, the assessment area according to the FAO codification of fishing sectors. When the stock assessment area groups a series of sectors, the first and last sectors in the series are separated by a dash.
-

In European sea bass like in other animals, the tongue plays a fundamental role in the mechanics of food ingestion. It is composed from the surface in depth of mucosa, submucosa, musculature and fibro cartilaginous skeleton. The tunica mucosa exhibits a stratified epithelium interrupted by numerous teeth differently distributed that erupt more or less completely from the layers below. The European sea bass tongue is composed of canine-like teeth, surrounded by taste buds and numerous fungiform and conical papillae. The tongue beeing directly in contact with external environment, the success of the adaptation of fishes to different environments in the context of global change, depends oamong other on the modifications occurring on the tongue structures. The present study investigates the potential effect of ocean acidification on the lingual transcriptome.
-

Frise chronologique des millésimes de modes d'occupation des sols produits par les régions françaises et par le programme Corine Land Cover.