 Catalogue PIGMA
notPlanned
Type of resources
Available actions
Topics
Keywords
Contact for the resource
Provided by
Years
Formats
Representation types
Update frequencies
status
Scale
Resolution
-
-

-

-
-
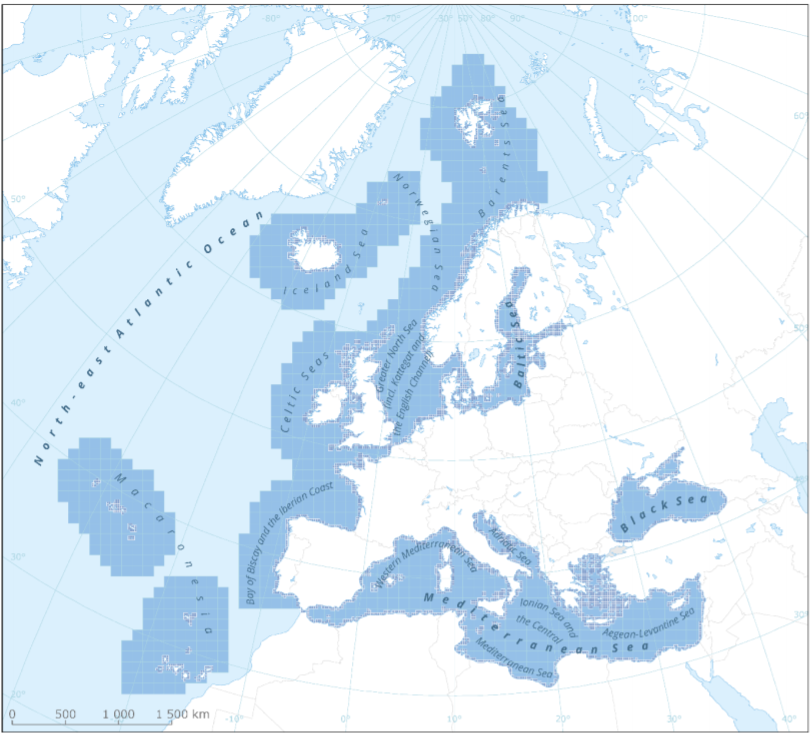
This metadata refers to the EEA marine assessment grid, to which all data and assessment results have been spatially mapped in order to ensure that data can be compared in a uniform way across the European regional seas. The marine assessment grid is based on the EEA reference grid system. The EEA reference grid is based on ERTS89 Lambert Azimuthal Equal Area projection with parameters: latitude of origin 52° N, longitude of origin 10° E, false northing 3 210 000.0 m, false easting 4 321 000.0 m. All grid cells are named with a unique identifier containing information on grid cell size and the distance from origin in meters (easting and northing). An important attribute of the EEA reference grid system is that by using an equal area projection all grid cells are having the same area for the same grid size. In this marine assessment grid, two grid sizes are used: * 100 x 100 km in offshore areas (> 20 km from the coastline) * 20 x 20 km in coastal areas (<= 20 km from the coastline) The grid sizes were choosen after an evaluation of data availability versus the need for sufficient detail in the resulting assessment. The resulting assessment grid is a combination of two grid sizes using the EEA reference grid system. The overall area of interest used in the grid is based on the marine regions and subregions under the Marine Strategy Framework Directive (MSFD). Additionally, Norwegian (Barent Sea and Norwegian Sea) and Icelandic waters (’Iceland Sea’) have been added (see Surrounding seas of Europe). Note that, within the North East Atlantic region, only the subregions within EEZ boundaries (~200 nm) have been included.
-

Digital Surface Models (DSMs) of the study area were generated by drones on 19 September 2024 and 18 September 2025. Each pixel represents the elevation value of the terrain at the time of the survey. These DSMs were generated from 895 (2024) and 1,282 images (2025), captured at an altitude of 120 (2024) and 100 meters (2025) using the DJI Mavic 3E RTK and Mavic 3M RTK drones, with ground resolutions of 3.19 (2024) and 2.63 cm/pixel (2025). The surveyed area covers approximately 1 km². The DSMs were resampled to a resolution of 20 cm. The vertical coordinate system used is NGF IGN69.
-
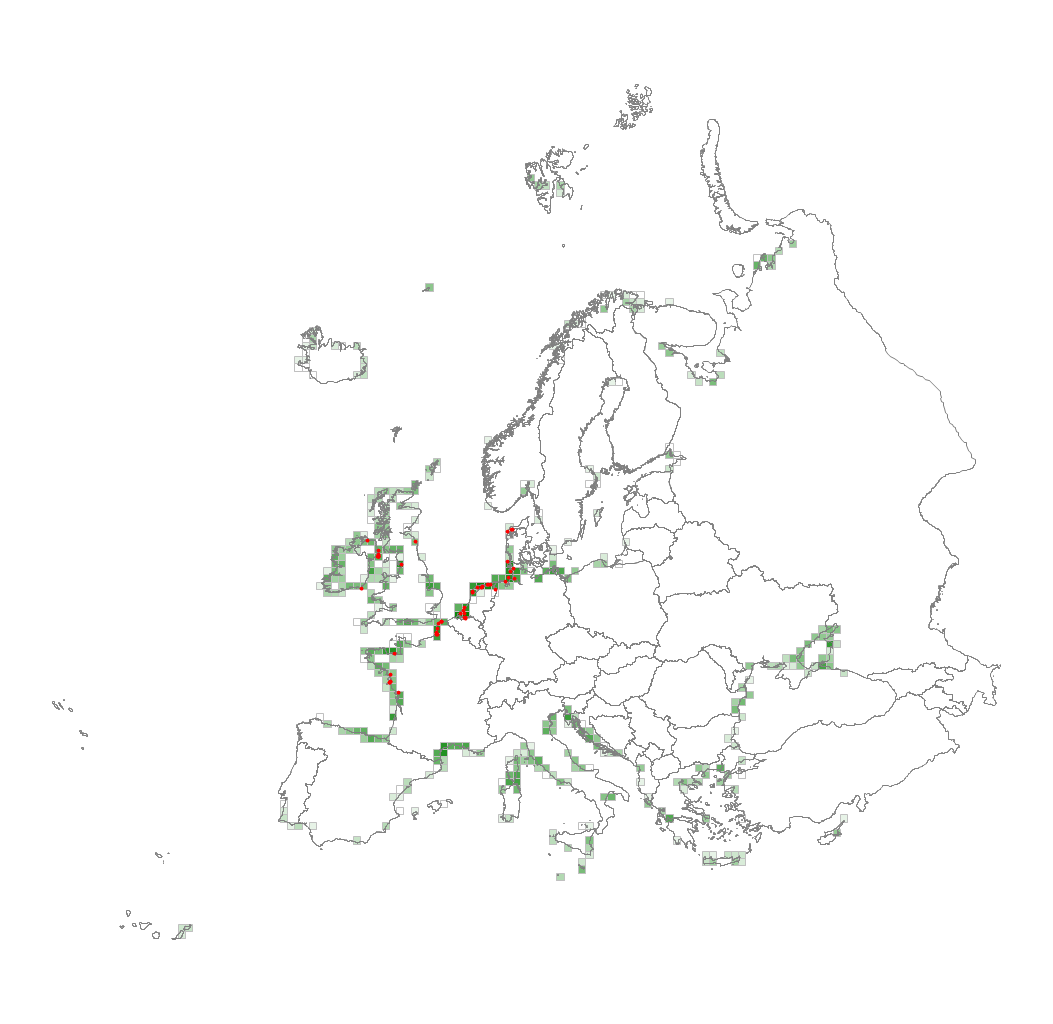
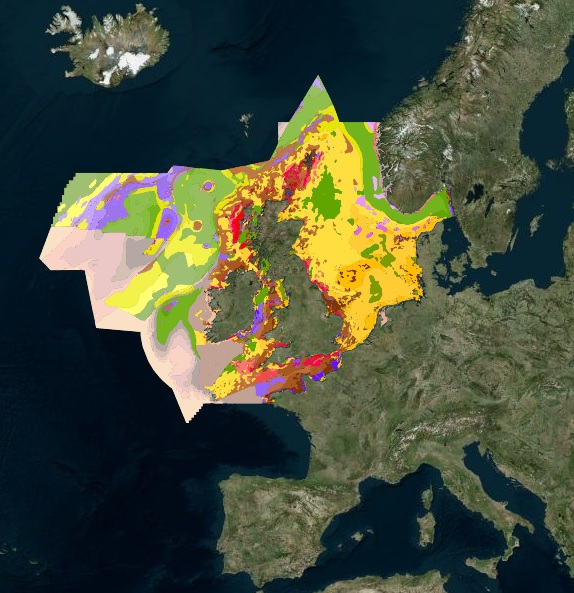
This metadata corresponds to the EUNIS Littoral biogenic habitat types (salt marshes), distribution based on vegetation plot data dataset. Littoral biogenic habitats (commonly known as salt marshes) are formed by animals such as worms and mussels or plants. The verified saltmarsh habitat samples used are derived from the Braun-Blanquet database (http://www.sci.muni.cz/botany/vegsci/braun_blanquet.php?lang=en) which is a centralised database of vegetation plots and comprises copies of national and regional databases using a unified taxonomic reference database. The geographic extent of the distribution data are all European countries except Armenia and Azerbaijan. The dataset is provided both in Geodatabase and Geopackage formats.
-
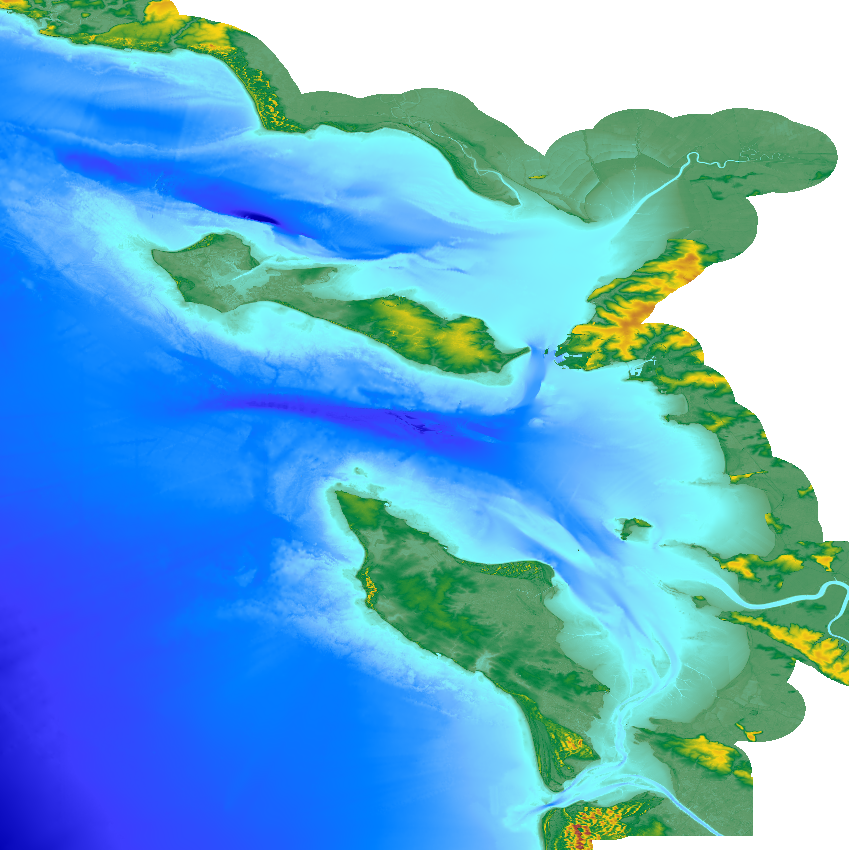
The update of the coastal topo-bathymetric DEM of the Pertuis charentais at a resolution of 0.0002° (~ 20 m) was carried out in the third phase of the HOMONIM project. The DEM extends from the terrestrial domain to about 60 meters depth over all the pertuis (pertuis Breton, pertuis d’Antioche and pertuis of Maumusson). The DEM is intended to be implemented in hydrodynamic models in order to produce forecasts as accurate as possible of water heights and sea states at the coast to improve the relevance of the Wave-Submergence Vigilance. This product is available with either the Lowest Astronomic Tide (LAT) or the Mean Sea Level (MSL) as a vertical reference.
-
-