 Catalogue PIGMA
SHP
Type of resources
Available actions
Topics
Keywords
Contact for the resource
Provided by
Years
Formats
Representation types
Update frequencies
status
Scale
Resolution
-
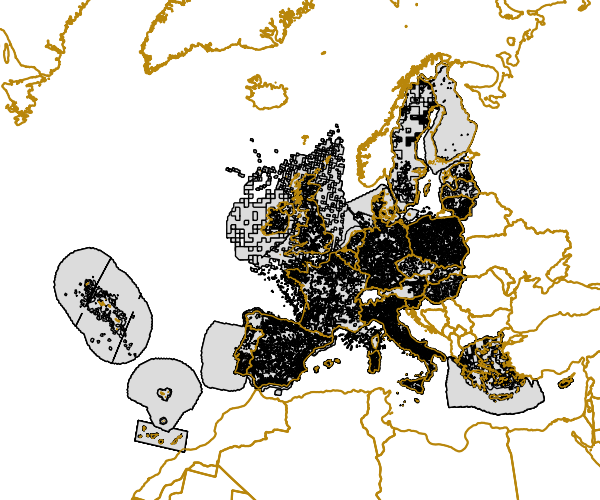
Gridded Distribution of Species as reported during the Article 17 of the Habitats Directive (92/43/EEC) covering the period 2001 to 2006. The data covers the EU 25. All Member States are requested by the Habitats Directive (92/43/EEC) to monitor habitat types and species considered to be of Community interest. Article 17 of the Habitats Directive 92/43/EEC requires that every 6 years Member States prepare reports to be sent to the European Commission on the implementation of the Directive. The Article 17 report for the period 2001-2006 for the first time includes assessments on the conservation status of the habitat types and species of Community interest. Information on the data quality of the 2001-2006 reporting round is available at http://bd.eionet.europa.eu/article17.
-
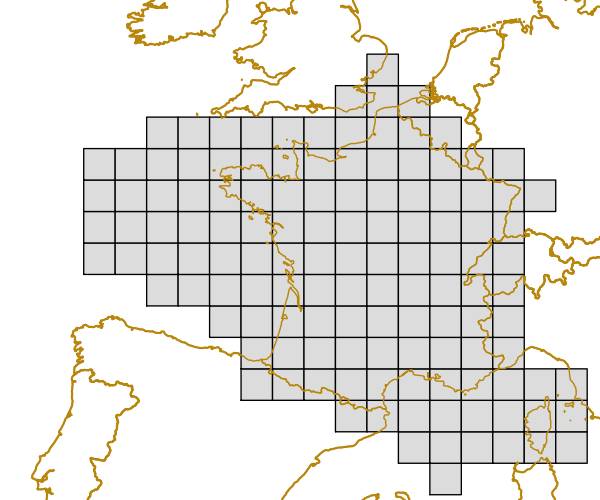
The grid is based on proposal at the 1st European Workshop on Reference Grids in 2003 and later INSPIRE geographical grid systems. The sample grid available here is part of a set of three polygon grids in 1, 10 and 100 kilometres. The grids cover at least country borders and, where applicable, marine Exclusive Economic Zones v7.0, http://www.marineregions.org. Note that the extent of the grid into the marine area does not reflect the extent of the territorial waters.
-
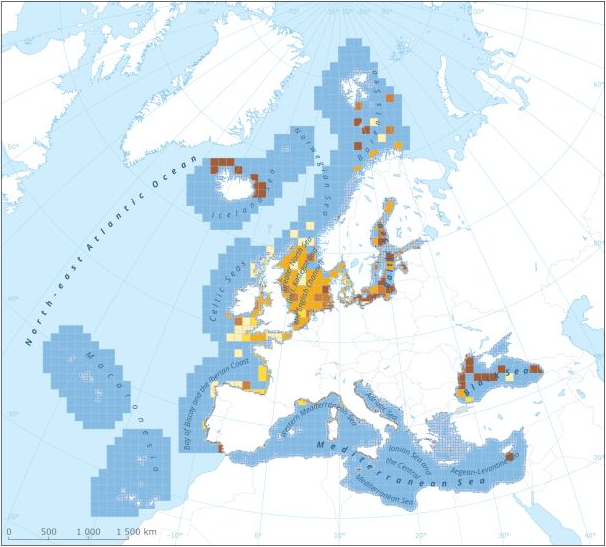
This dataset presents the resulting assessment grid (based on the EEA reference grid) with the classification of chemical status of the transitional, coastal and marine waters in the context of the Water Framework Directive (WFD) and the Marine Strategy Framework Directive (MSFD). This classification has been performed using the CHASE+ tool, with classifications of the matrices ‘water’, ‘sediment’ and ‘biota’ and indicators of ‘biological effects’, as well as an integrated classification of chemical status, combining results of all matrices. The chemical status is evaluated in five classes, where NPAhigh and NPAgood are recognised as ‘non-problem areas’ and PAmoderate, PApoor and PAbad are recognised as ‘problem areas’. This is the assessment made excluding concentrations of mercury (Hg) and polybrominated diphenyl ethers (PBDEs) The overall area of interest used is based on the marine regions and subregions under the Marine Strategy Framework Directive. Additionally, Norwegian (Barent Sea and Norwegian Sea) and Icelandic waters (’Iceland Sea’) have been added (see Surrounding seas of Europe). Note that within the North East Atlantic region only the subregions within EEZ boundaries (~200 nm) have been included. This dataset underpins the findings and cartographic representations published in the report "Contaminants in Europe's Seas" (EEA, 2019): https://www.eea.europa.eu/publications/contaminants-in-europes-seas.
-

The EEA coastline dataset is created for detailed analysis with a Minimum Mapping Unit of e.g. 1:100000, for geographical Europe. The coastline is a hybrid product obtained from satellite imagery from two projects: 1) EUHYDRO (Pan-European hydrographic and drainage database) [https://land.copernicus.eu/pan-european/satellite-derived-products/eu-hydro/view] and 2) GSHHG (A Global Self-consistent, Hierarchical, High-resolution Geography Database) [http://www.soest.hawaii.edu/pwessel/gshhg/]. The defining criteria was altitude level = 0 from EUDEM [https://land.copernicus.eu/pan-european/satellite-derived-products/eu-dem/view]. Outside the coverage of the EUDEM, the coastline from GSHHG was used without modifications. A few manual amendments to the dataset were necessary to meet requirements from EU Nature Directives, Water Framework Directive and Marine Strategy Framework Directive. In 2015, several corrections were made in the Kalogeroi Islands (coordinates 38.169, 25.287) and two other Greek little islets (coordinates 36.766264, 23.604318), as well as in the peninsula of Porkkala (around coordinates 59.99, 24.42). In this revision (v3, 2017), 2 big lagoons have been removed from Baltic region, because, according to HELCOM, are freshwater lagoons. This dataset is a polygon usable as a water-land mask.
-
This vector data set is the first public version released of the EU marine waters used for the implementation of the Marine Strategy Framework Directive (MSFD), submitted by the Member States to the European Commission. The Marine Strategy Framework Directive (MSFD) applies to all marine waters of EU Member States, which in Article 3 are defined as follows: (a) waters, the seabed and subsoil on the seaward side of the baseline from which the extent of territorial waters is measured extending to the outmost reach of the area where a Member State has and/or exercises jurisdictional rights, in accordance with the UNCLOS, with the exception of waters adjacent to the countries and territories mentioned in Annex II to the Treaty and the French Overseas Departments and Collectivities; and (b) coastal waters as defined by Directive 2000/60/EC, their seabed and their subsoil, in so far as particular aspects of the environmental status of the marine environment are not already addressed through that Directive or other Community legislation.
-
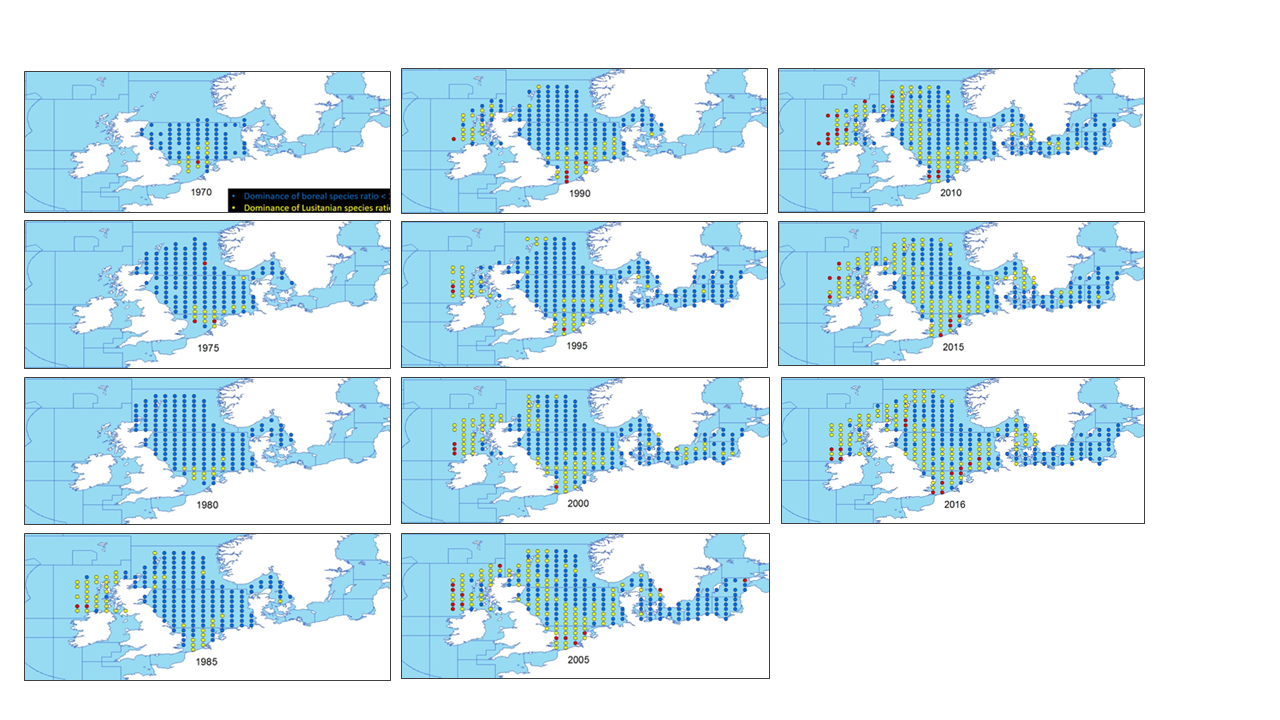
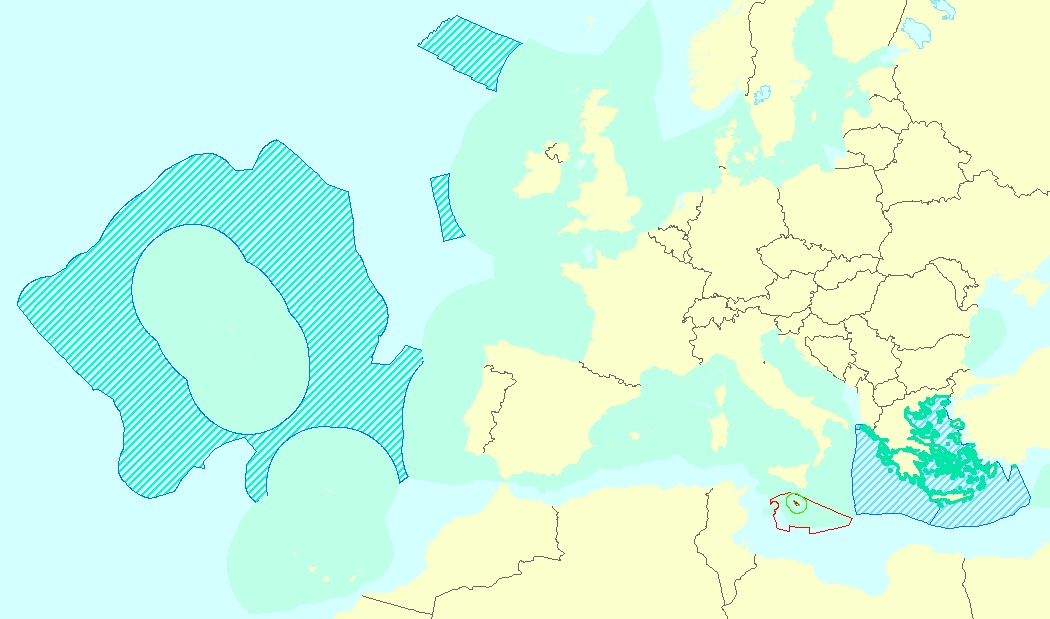
This metadata describes the ICES data on the temporal development of the Lusitanian/Boreal species ratio in the period from 19657 to 2016. Key message: The ratio between the number of Lusitanian (warm-favouring) and Boreal (cool-favouring) species are significantly increasing in several North-East Atlantic marine areas whereas there is no significant changes in all the southern areas. Changes in ratios are most apparent in the North Sea, Irish Sea and West of Scotland. Furthermore, it seems that Lusitanian species have not spread in all northward directions, but have followed two particular routes, through the English Channel and north around Scotland Blue dots indicates L/B ratios below 1 (dominance of Boreal species) Yellow dots indicates L/B ratios >=1 and <2 (dominance of Lusitanian species) Red dots indicates L/B ratios >=2 (high dominance of Lusitanian species) The dataset is derived from the ICES data portal 'DATRAS' (the Database of Trawl Surveys). DATRAS is an online database of trawl surveys with access to standard data products. DATRAS stores data collected primarily from bottom trawl fish surveys coordinated by ICES expert groups. The survey data are covering the Baltic Sea, Skagerrak, Kattegat, North Sea, English Channel, Celtic Sea, Irish Sea, Bay of Biscay and the eastern Atlantic from the Shetlands to Gibraltar. At present, there are more than 56 years of continuous time series data in DATRAS, and survey data are continuously updated by national institutions. The dataset has been used in the EEA Indicator "Changes in fish distribution in European seas" https://www.eea.europa.eu/data-and-maps/indicators/fish-distribution-shifts/assessment-1. The dataset has been used for this static map: https://www.eea.europa.eu/en/analysis/indicators/changes-in-fish-distribution-in/temporal-development-of-the-ratio
-
Complete Coastline Features for all the countries that produced Corine Land Cover 2000 and have a coastline, with detailed descriptions on the environment and type of coastal areas. Each coast segment has inherited CLC 2000 class, and also the attributes from Eurosion Coastline version 2.1 2004, regarding geomorphology, type of coast and erosion trends.
-
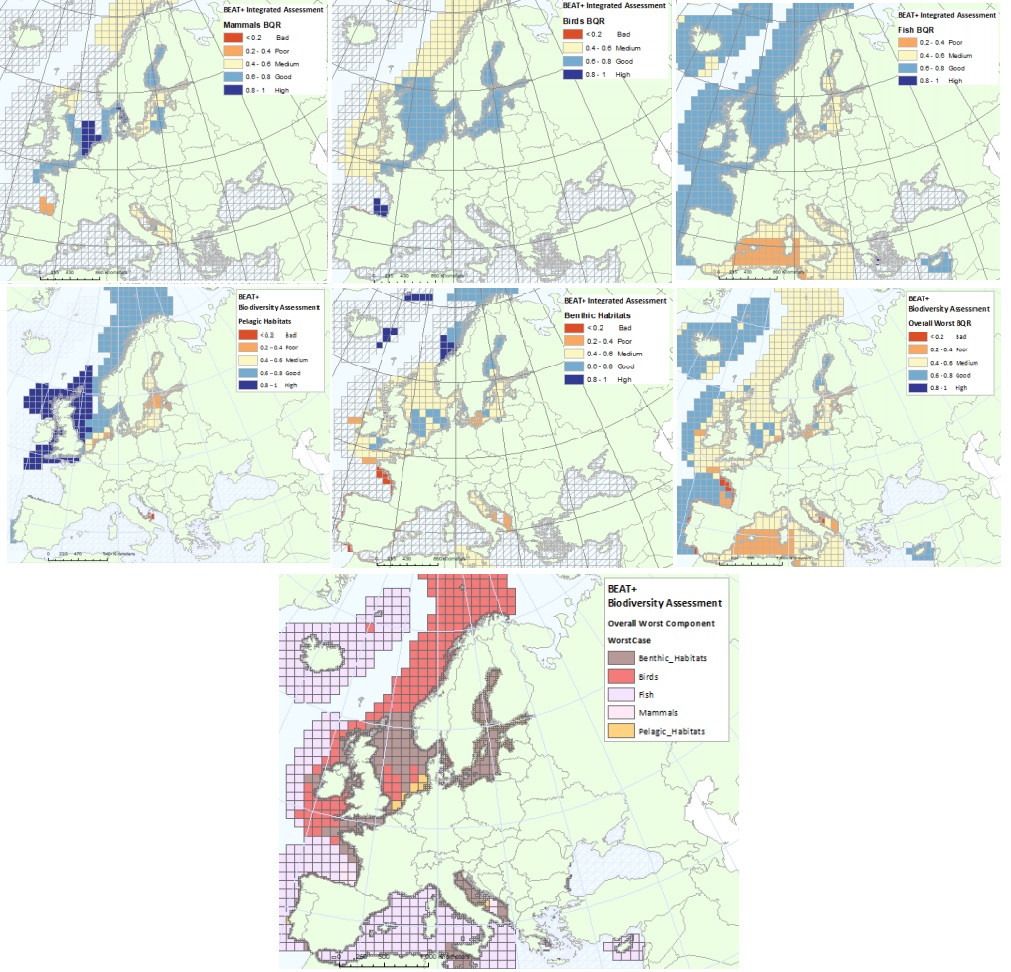
The BEAT+ tool builds on the EEA assessment tools developed and applied in the context of assessing the degree of contamination (CHASE+), eutrophication (HEAT+) and biodiversity (BEAT+) in Europe's seas. BEAT+ makes use of the same data sets and threshold values used in these assessments but recombines these in a new framework that addresses 'biodiversity condition'. BEAT+ has been designed to provide an assessment of the spatial variability of a range of biodiversity components by combining existing biodiversity indicators. The tool integrates data from normalised indicators to identify worst case status measures for different biodiversity components. The results are then linked to a standard gridE based Spatial Assessment Unit (SAU) which is used both for biodiversity and for pressures assessments (Andersen et al., 2014). These grid-based SAUs not only allow alignment of indicators for biodiversity and for pressures but provide a means for combining large assessment areas (e.g. for wide‐ranging species) with point data collected from biological surveys e.g. WFD monitoring. BEAT+ tool works by calculating a Biological Quality Ratio (BQR) which is an aggregated score of indicator outcomes within a grid square. To allow objective comparison, the indicator outcomes are normalised to a scale of 0 to 1, with five status classes at equal intervals on that scale (from Bad starting at 0, Poor at 0.2, Medium at 0.4, Good at 0.6 and High at 0.8). By this means, indicators based on different biological criteria can be aggregated in a consistent way. This metadata refers to dataset providing the results of classification of biodiversity status using the BEAT+ tool. The status is evaluated in five classes, where High and Good are recognised as ‘non-problem areas’ and Moderate, Poor and Bad are recognised as ‘problem areas’. The dataset covers: - BQR Assessment of all marine mammals combined (mainly focused on coastal and relatively stable inshore populations of seals, dolphins and porpoises) - BQR Assessment of seabirds and wading birds - BQR Assessment of commercial fish (as these have agreed targets defined on biomass and fishing mortality) - BQR Assessment of pelagic habitats - BQR Assessment of benthic habitats - BQR Assessment of worst-performing biodiversity groups - An overall synthesis of the Biological Quality Ratios (BQR) values (showing which are the worst -lowest- BQR values in each assessment grid cell. The ‘worst’ value is used here to identify the biological group most at risk, rather than averaging over all groups to avoid over-emphasis on groups with more intensive monitoring). As reference, please consult the ETC/ICM Report 3/2019: Biodiversity in Europe's seas: https://www.eionet.europa.eu/etcs/etc-icm/products/biodiversity-in-europes-seas. The indicator BEAT+ Integrated Assessment Worst Case BQR has been used in the EEA report 17/2019 "Marine Messages II": https://www.eea.europa.eu/publications/marine-messages-2.
-
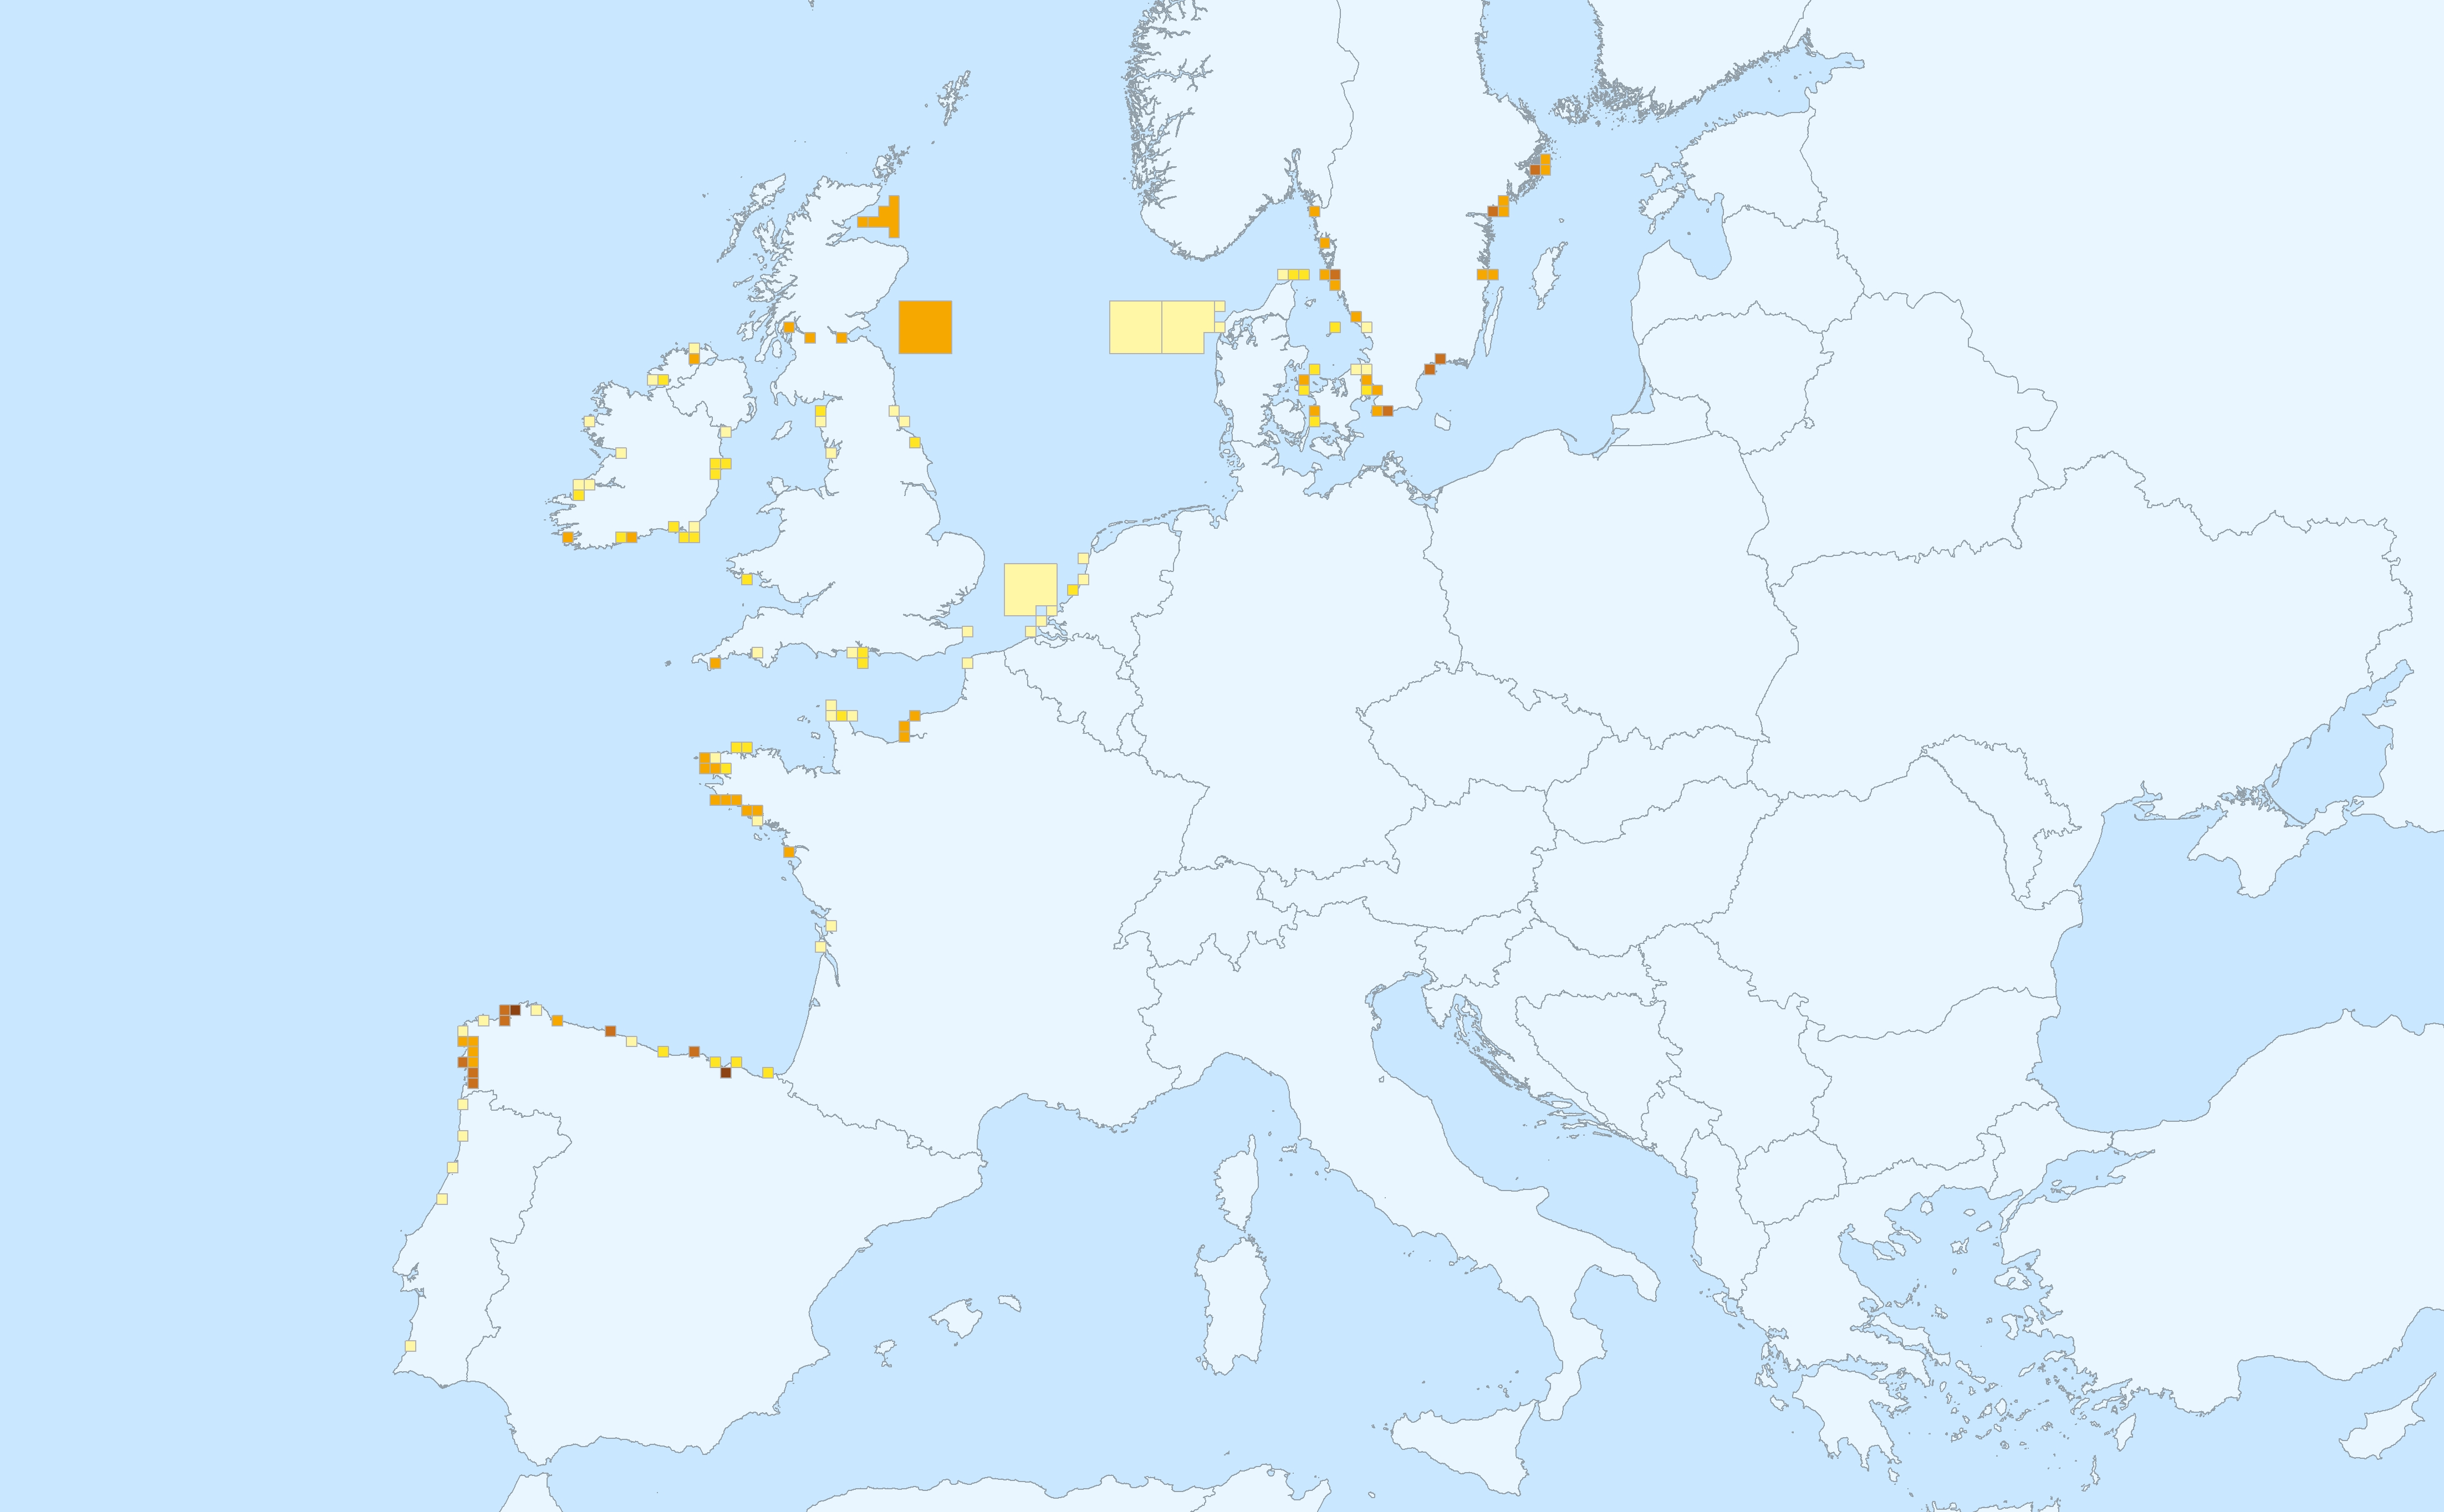
This data set presents the resulting assessment grid (based on the EEA reference grid) with the classification of chemical status of the transitional, coastal and marine waters in the context of the Water Framework Directive (WFD) and the Marine Strategy Framework Directive (MSFD), providing a mapping of contamination 'problem areas' and 'non-problem areas' based on measurements of biological effects. This classification has been performed using the CHASE+ tool, with classifications of the of contaminant status of indicators of biological effects. The status is evaluated in five classes, where NPAhigh and NPAgood are recognised as ‘non-problem areas’ and PAmoderate, PApoor and PAbad are recognised as ‘problem areas’. Monitoring biological effects is restricted to a few indicators (e.g. imposex) and data coverage is currently limited. Biological effects have thus been addressed in only 134 assessment units, mostly in the Baltic Sea, the North Sea and the North-East Atlantic Ocean. This data set underpins the findings and cartographic representations published in the EEA report “Contaminants in Europe’s seas” (No 25/2018). See the mentioned report for further information.
-
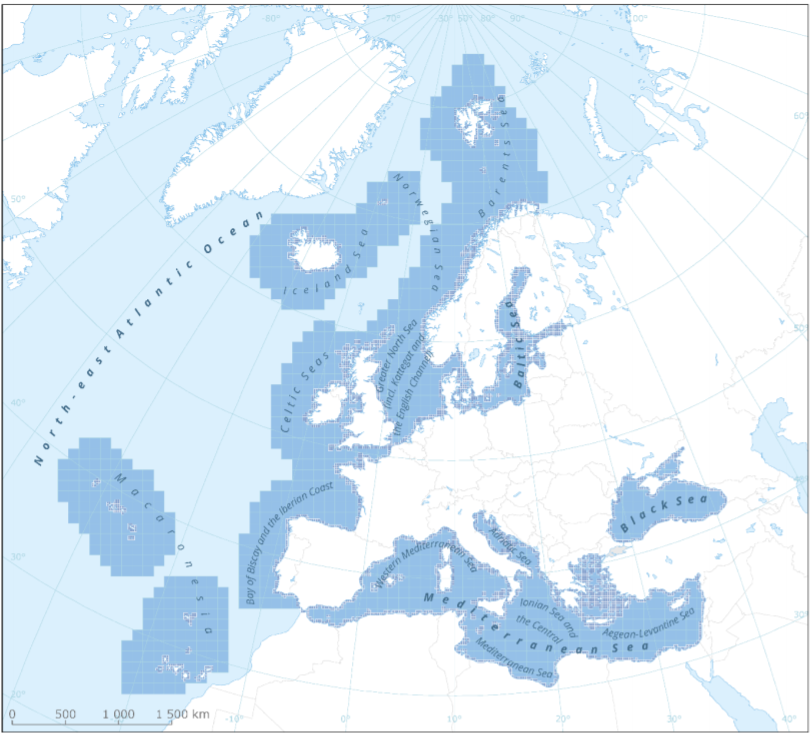
This metadata refers to the EEA marine assessment grid, to which all data and assessment results have been spatially mapped in order to ensure that data can be compared in a uniform way across the European regional seas. The marine assessment grid is based on the EEA reference grid system. The EEA reference grid is based on ERTS89 Lambert Azimuthal Equal Area projection with parameters: latitude of origin 52° N, longitude of origin 10° E, false northing 3 210 000.0 m, false easting 4 321 000.0 m. All grid cells are named with a unique identifier containing information on grid cell size and the distance from origin in meters (easting and northing). An important attribute of the EEA reference grid system is that by using an equal area projection all grid cells are having the same area for the same grid size. In this marine assessment grid, two grid sizes are used: * 100 x 100 km in offshore areas (> 20 km from the coastline) * 20 x 20 km in coastal areas (<= 20 km from the coastline) The grid sizes were choosen after an evaluation of data availability versus the need for sufficient detail in the resulting assessment. The resulting assessment grid is a combination of two grid sizes using the EEA reference grid system. The overall area of interest used in the grid is based on the marine regions and subregions under the Marine Strategy Framework Directive (MSFD). Additionally, Norwegian (Barent Sea and Norwegian Sea) and Icelandic waters (’Iceland Sea’) have been added (see Surrounding seas of Europe). Note that, within the North East Atlantic region, only the subregions within EEZ boundaries (~200 nm) have been included.