 Catalogue PIGMA
250000
Type of resources
Available actions
Topics
Keywords
Contact for the resource
Provided by
Years
Formats
Representation types
Update frequencies
status
Scale
Resolution
-
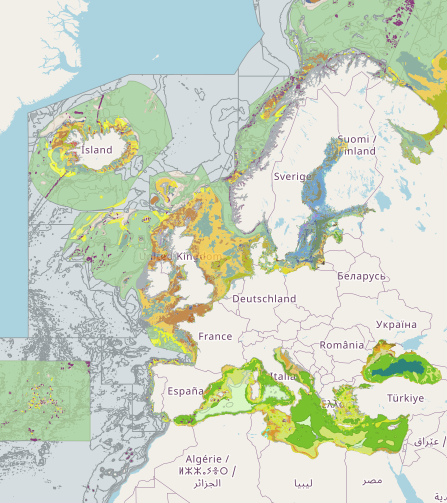
Output of the 2019 EUSeaMap broad-scale predictive model, produced by EMODnet Seabed Habitats. The extent of the mapped area includes the Mediterranean Sea, Black Sea, Baltic Sea, and areas of the North Eastern Atlantic extending from the Canary Islands in the south to the Barents Sea in the north. The map was produced using a "top-down" modelling approach using classified habitat descriptors to determine a final output habitat. Habitat descriptors differ per region but include: Biological zone Energy class Oxygen regime Salinity regime Seabed substrate Riverine input Habitat descriptors (excepting Substrate) are calculated using underlying physical data and thresholds derived from statistical analyses or expert judgement on known conditions. The model is produced using R and Arc Model Builder (10.1). The model was created using raster input layers with a cell size of 0.00104dd (roughly 100 metres). The model includes the sublittoral zone only; due to the high variability of the littoral zone, a lack of detailed substrate data and the resolution of the model, it is difficult to predict littoral habitats at this scale. This map follows the EUNIS 2007-11 classification system where it is appropriate. It has also been classified according to MSFD Benthic Broad Habitat types. This report details the methods used in the previous version (v2016) - a new report is in progress: Populus J. And Vasquez M. (Eds), 2017. EUSeaMap, a European broad-scale seabed habitat map. Ifremer Available from: http://archimer.ifremer.fr/doc/00388/49975/
-
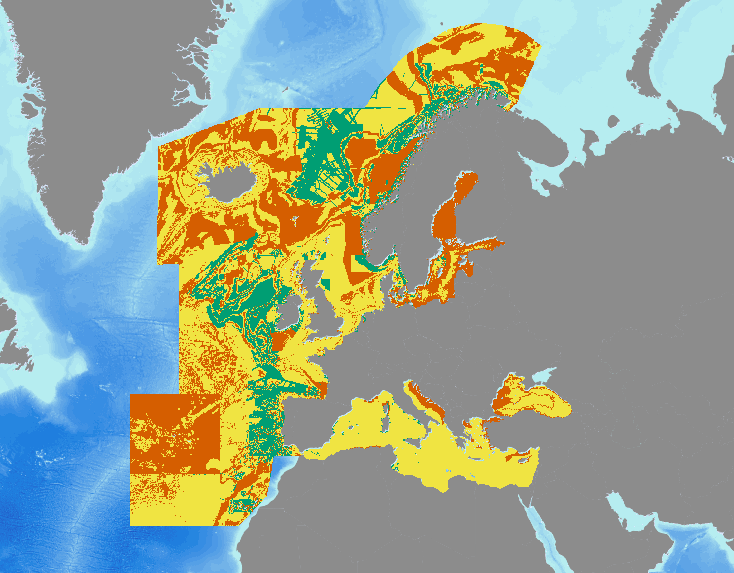
Output of the 2016 EUSeaMap broad-scale predictive model, produced by EMODnet Seabed Habitats and aggregated into the predominant habitats of the Marine Strategy Framework Directive. The extent of the mapped area includes the Mediterranean Sea, Black Sea, Baltic Sea, and areas of the North Eastern Atlantic extending from the Canary Islands in the south to Norway in the North. The map was produced using a "top-down" modelling approach using classified habitat descriptors to determine a final output habitat. Habitat descriptors differ per region but include: Biological zone Energy class Oxygen regime Salinity regime Seabed Substrate Riverine input Habitat descriptors (excepting Substrate) are calculated using underlying physical data and thresholds derived from statistical analyses or expert judgement on known conditions. The model is produced in Arc Model Builder (10.1). For more information on the modelling process please read the EMODnet Seabed Habitats The model was created using raster input layers with a cell size of 0.002dd (roughly 250 meters). The model includes the sublittoral zone only; due to the high variability of the littoral zone, a lack of detailed substrate data and the resolution of the model, it is difficult to predict littoral habitats at this scale.
-
-
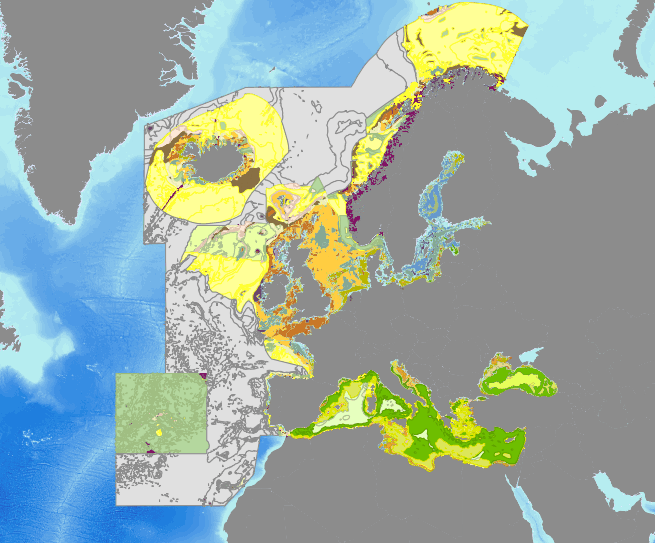
Output of the 2016 EUSeaMap broad-scale predictive model, produced by EMODnet Seabed Habitats. The extent of the mapped area includes the Mediterranean Sea, Black Sea, Baltic Sea, and areas of the North Eastern Atlantic extending from the Canary Islands in the south to Norway in the North. The map was produced using a "top-down" modelling approach using classified habitat descriptors to determine a final output habitat. Habitat descriptors differ per region but include: Biological zone Energy class Oxygen regime Salinity regime Seabed Substrate Riverine input Habitat descriptors (excepting Substrate) are calculated using underlying physical data and thresholds derived from statistical analyses or expert judgement on known conditions. The model is produced in Arc Model Builder (10.1). For more information on the modelling process please read the EMODnet Seabed Habitats The model was created using raster input layers with a cell size of 0.002dd (roughly 250 meters). The model includes the sublittoral zone only; due to the high variability of the littoral zone, a lack of detailed substrate data and the resolution of the model, it is difficult to predict littoral habitats at this scale. The map follows the EUNIS 2007-11 classification system where it is appropriate.
-
-
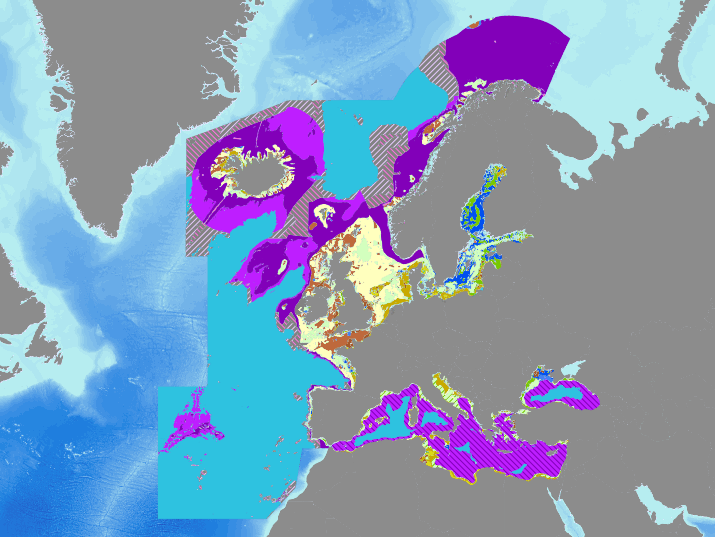
Confidence in the full output of the 2016 EUSeaMap broad-scale predictive model, produced by EMODnet Seabed Habitats. Values are on a range from 1 (low confidence) to 3 (high confidence). Confidence is calculated by amalgamating the confidence values of the underlying applicable habitat descriptors used to generate the habitat value in the area in question. Habitat descriptors differ per region but include: Biological zone Energy class Oxygen regime Salinity regime Seabed Substrate Riverine input Confidence in habitat descriptors are driven by the confidence in the source data used to determine the descriptor, and the confidence in the threshold/margin (areas closer to a boundary between two classes will have lower confidence). Confidence values are also available for each habitat descriptor and input data layer.
-
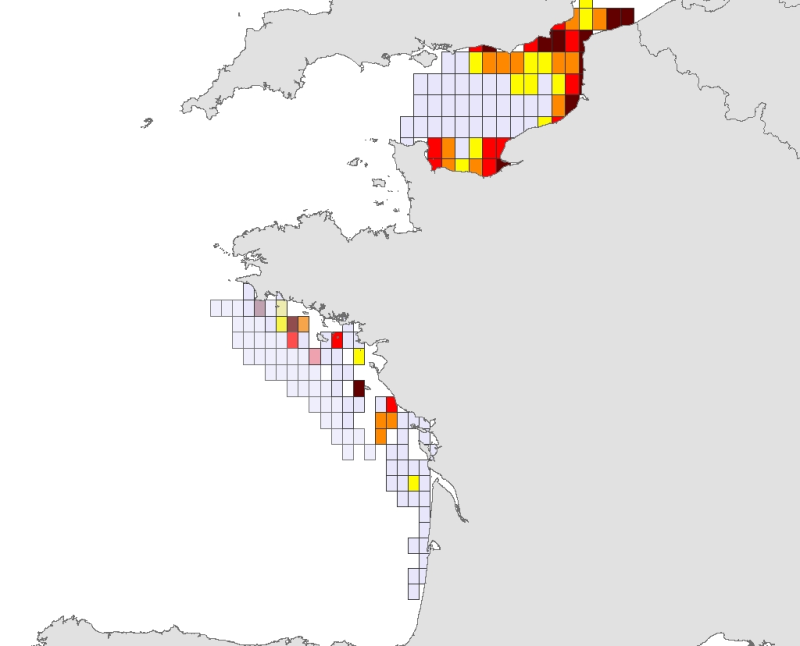
L'abondance de plie (Pleuronectes platessa) est exprimée en nombre d’individus par km² et observée lors des campagnes halieutiques de l'Ifremer utilisant un engin de pêche ”traînant de fond” : CGFS (2005-2009), LANGOLF (2006-2009), ORHAGO (2007-2010). Données utilisées dans le cadre d'une étude visant à l'identification de zones de moindres contraintes pour l'exploitation de granulats marins (étude confiée par le Ministère chargé de l'écologie).
-
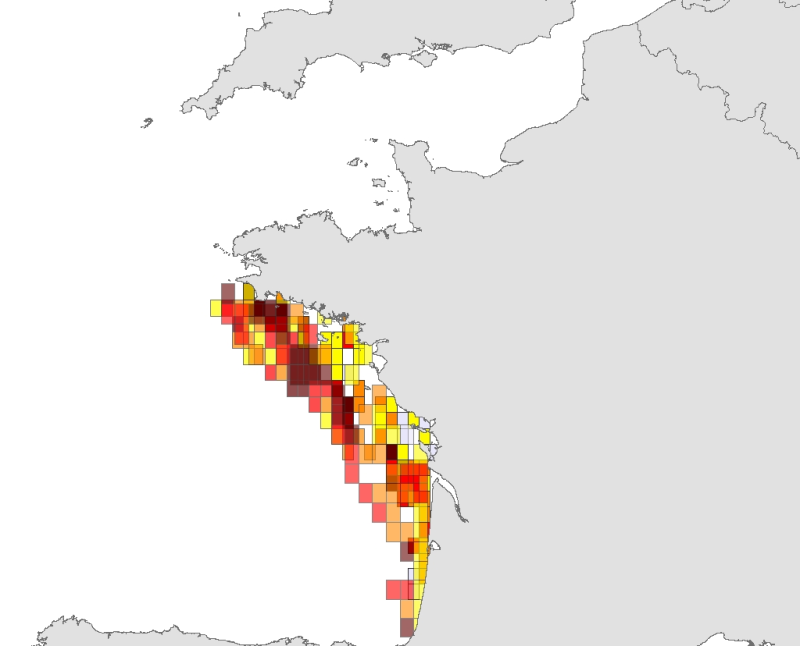
L'abondance de merlu (Merluccius merluccius) est exprimée en nombre d’individus par km² et observée lors des campagnes halieutiques de l'Ifremer utilisant un engin de pêche ”traînant de fond” : EVHOE (2005-2009), LANGOLF (2006-2009), ORHAGO (2007-2010). Données utilisées dans le cadre d'une étude visant à l'identification de zones de moindres contraintes pour l'exploitation de granulats marins (étude confiée par le Ministère chargé de l'écologie).
-
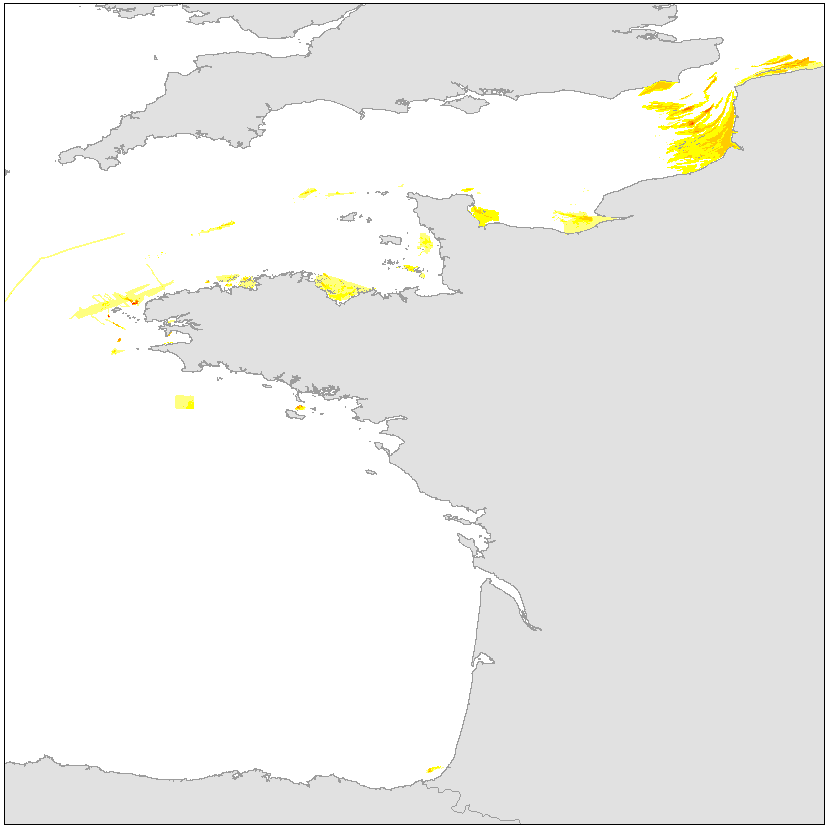
Synthèse sur les épaisseurs de "bancs sableux" sur les façades Mer du Nord, Manche et Atlantique à partir de la compilation des données de l'Ifremer, du SHOM et de l'IUEM. Les données sont restituées sous la forme : - de lignes, - de polygones qui délimitent des surfaces représentant les classes d'intervalles des isopaques de bancs sableux. Ces surfaces ont été fermées arbitrairement pour le calcul des volumes.
-
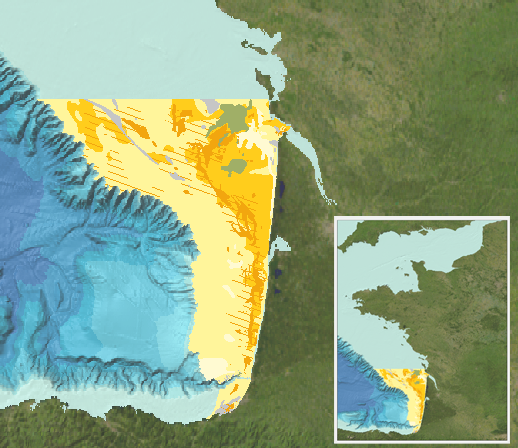
Cette carte de répartition des sédiments à l'échelle 1/250 000 (WGS84, projection de Mercator à N44°45') correspond à une compilation des travaux et une synthèse des connaissances acquises sur le secteur du plateau aquitain. Campagnes océanographiques à l'origine de cette carte : - BERNE Serge (1987) GEODEP 87 cruise, RV Thalia, https://doi.org/10.17600/87009111 - AUGRIS Claude (1993) PLABAS cruise, RV Thalia, https://doi.org/10.17600/93000660 - LERICOLAIS Gilles, AUGRIS Claude (1994) PLABAS 94/1 cruise, RV Thalia, https://doi.org/10.17600/94070170 - AUGRIS Claude (1994) PLABAS 94/2 cruise, RV Thalia, https://doi.org/10.17600/94070180 - LERICOLAIS Gilles, AUGRIS Claude (1995) PLACETA / PLABAS 3 cruise, RV Thalia, https://doi.org/10.17600/95070070 - CIRAC Pierre (1998) ITSAS cruise, RV Le Suroît, https://doi.org/10.17600/98020070 - CIRAC Pierre (2001) ITSAS II cruise, RV Le Suroît, https://doi.org/10.17600/1020050 - BERNE Serge (1984) FASEC-1 cruise, RV Cote D'Aquitaine, https://doi.org/10.17600/84012111 - CIRAC Pierre (2001) ITSAS V cruise, RV Thalia, https://doi.org/10.17600/1070060 - GILLET Hervé (2008) SEDYMAQ cruise, RV Thalia, https://doi.org/10.17600/8070110 - GILLET Hervé (2010) SEDYMAQ2 cruise, RV Thalia, https://doi.org/10.17600/10070100 - GILLET Hervé (2012) SEDYMAQ3 cruise, RV Thalia, https://doi.org/10.17600/12070080