 Catalogue PIGMA
2024
Type of resources
Available actions
Topics
Keywords
Contact for the resource
Provided by
Years
Formats
Representation types
Update frequencies
status
Scale
Resolution
-
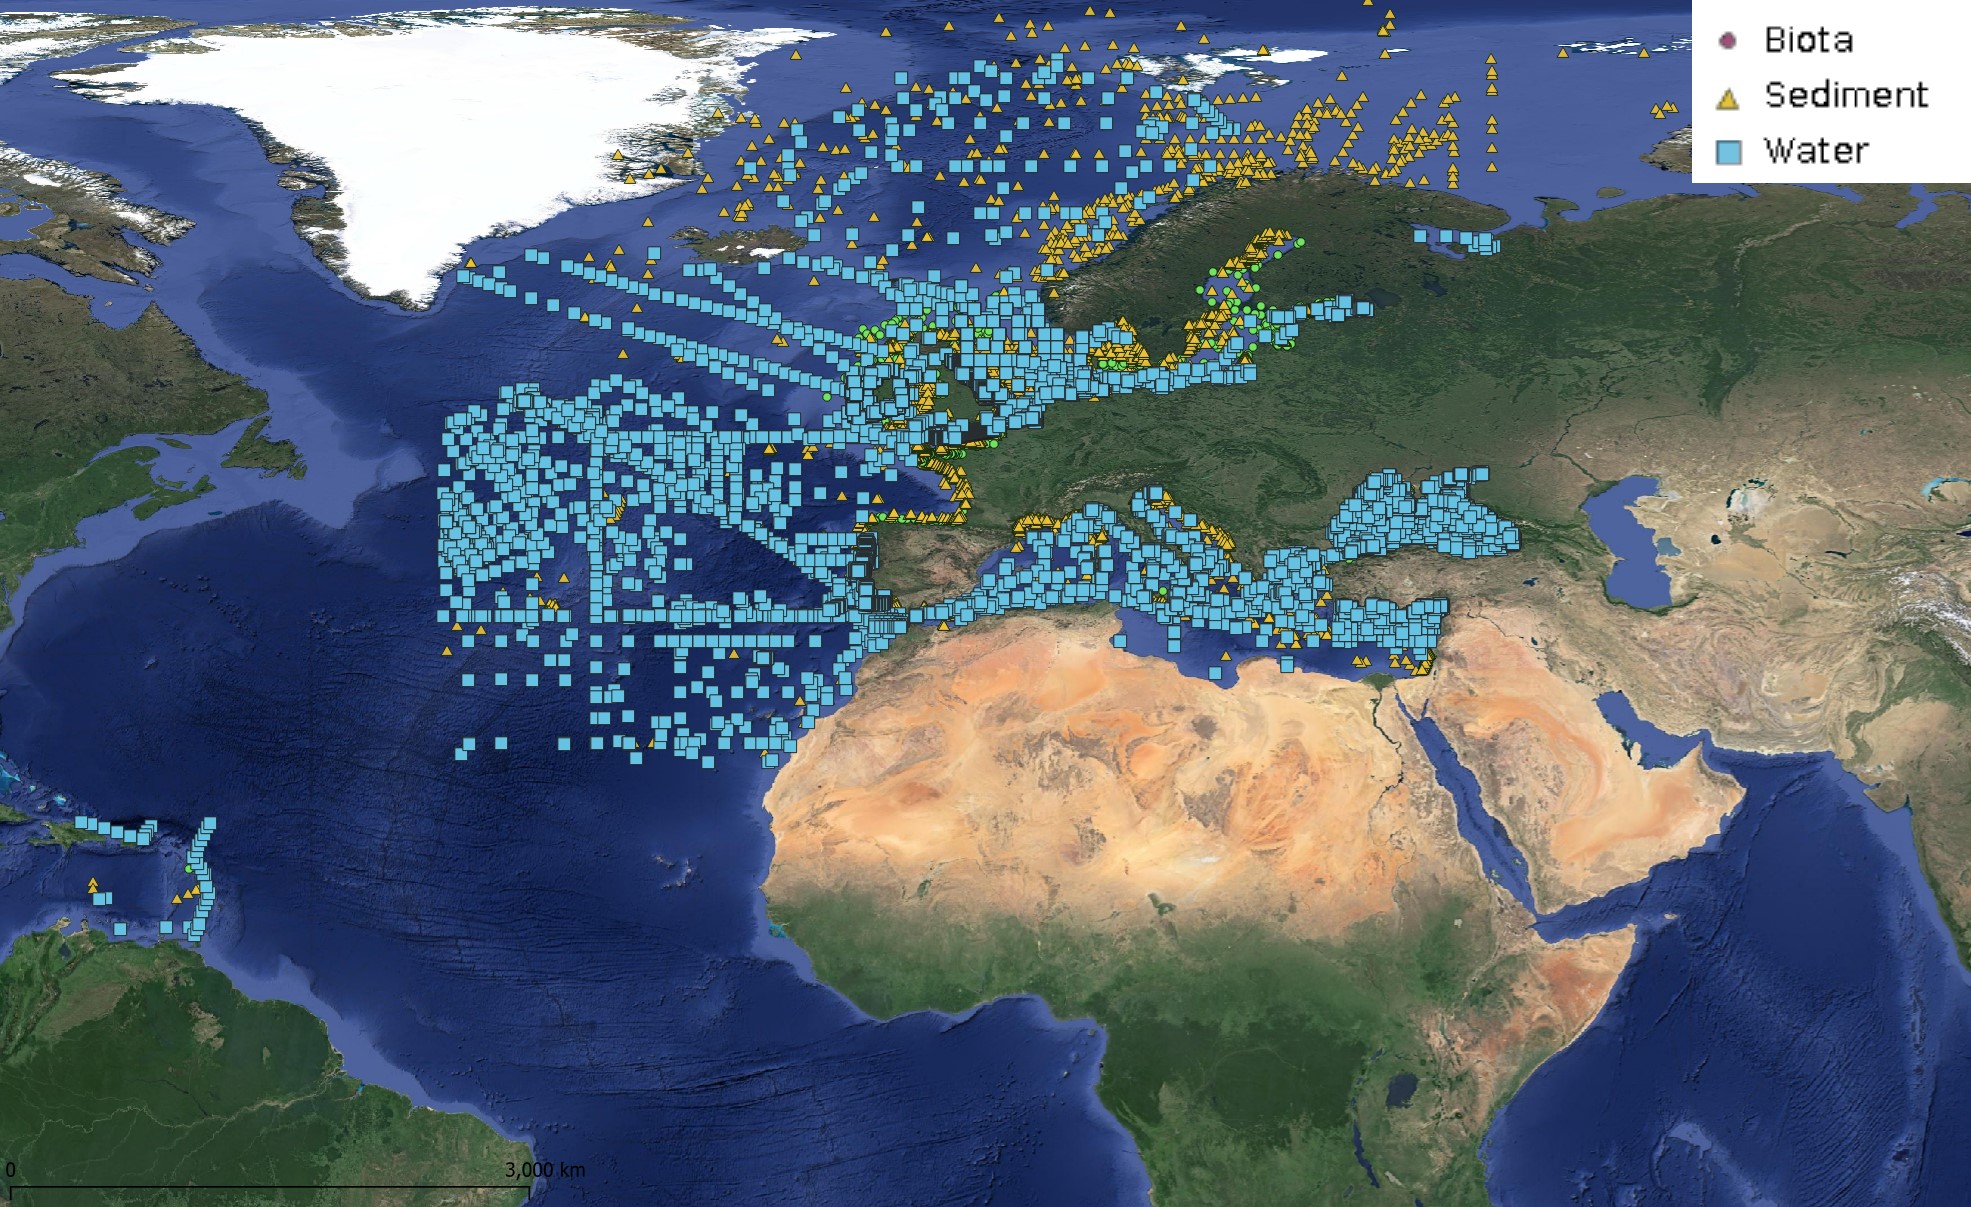
This product displays positions symbolized per matrix, for all available contaminants measurements for each year present in EMODnet regional contaminants aggregated datasets, v2024. The product displays positions for every available year.
-
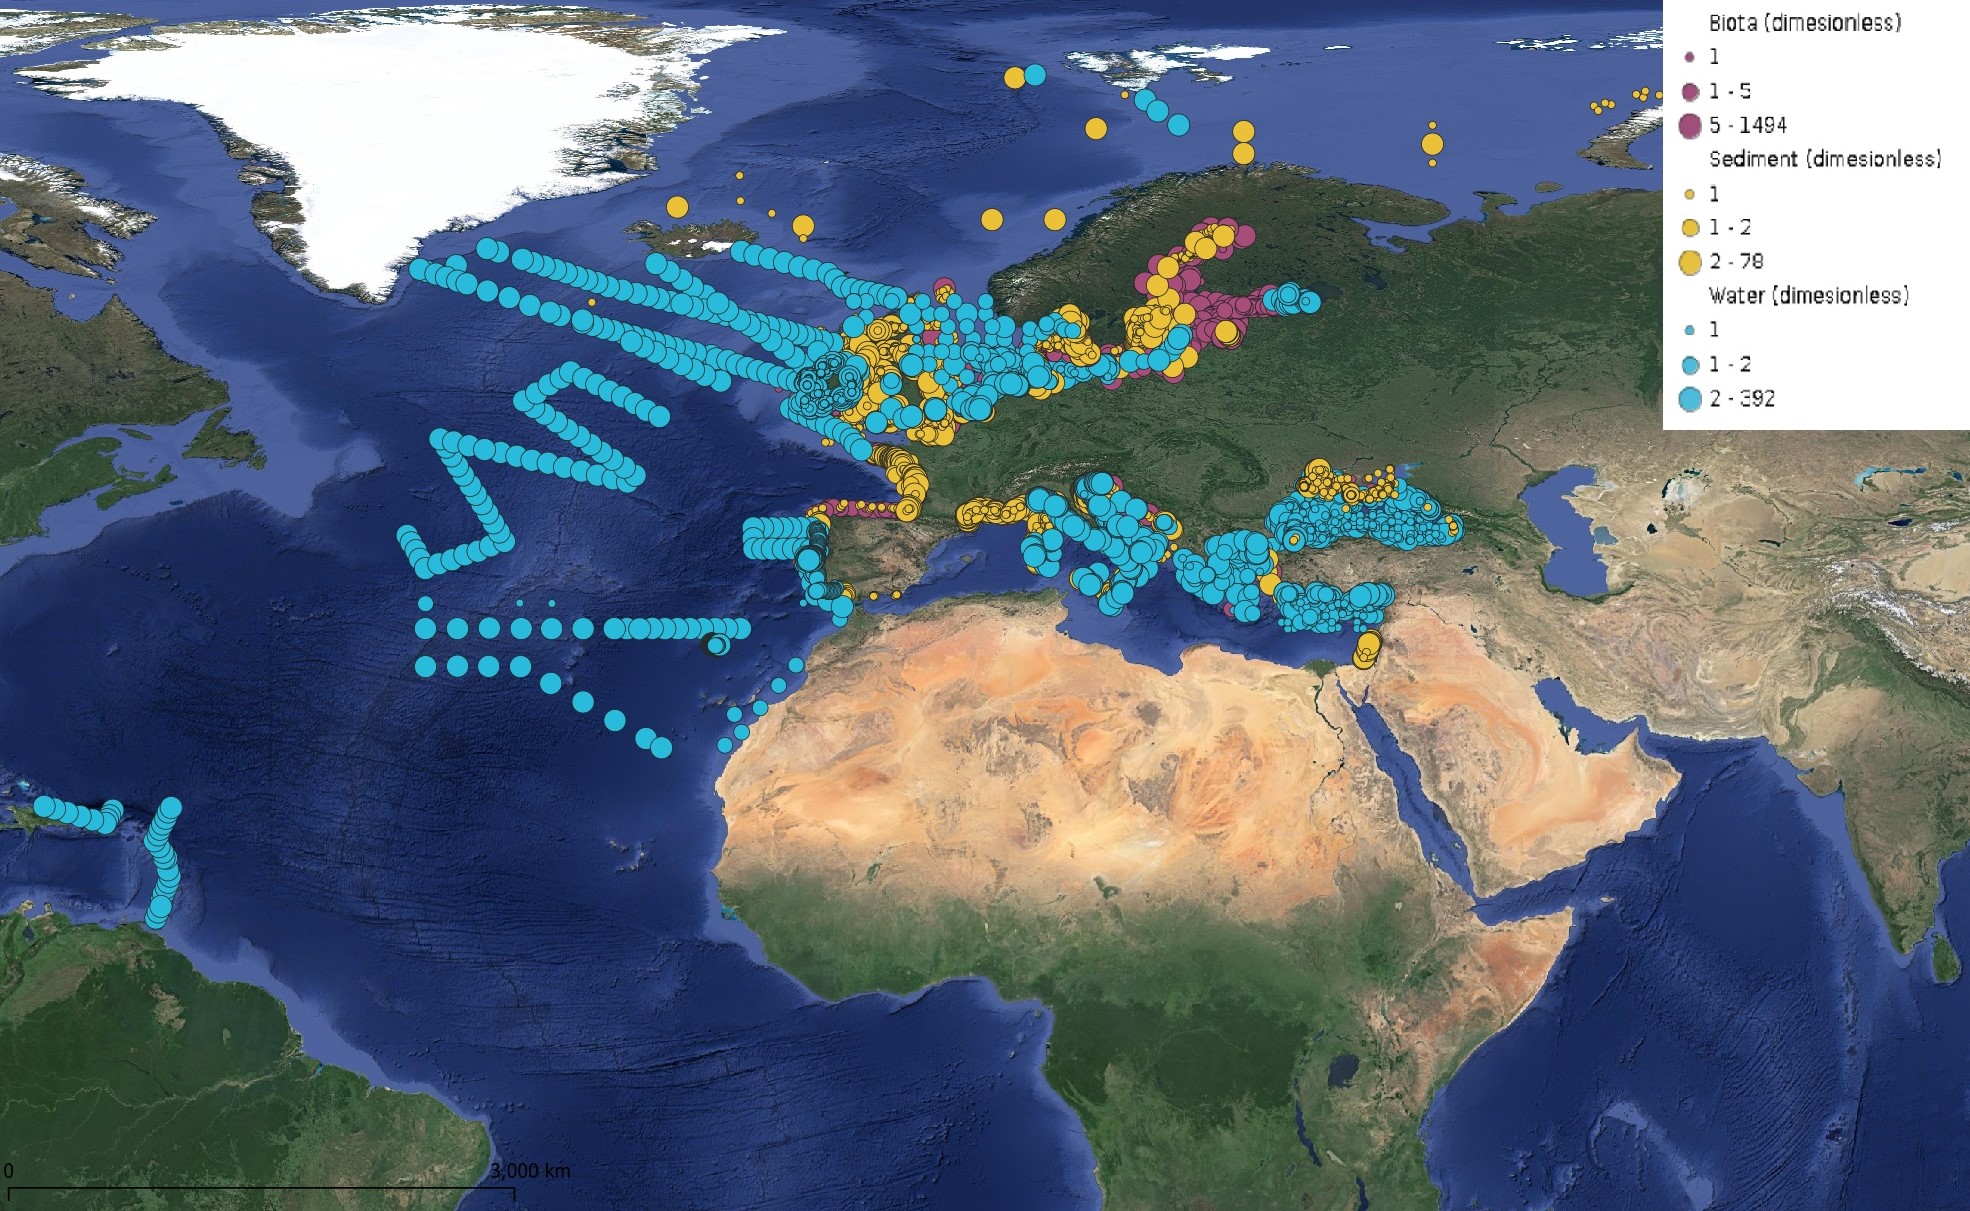
This product displays for Mercury, positions with values counts that have been measured per matrix for each year and are present in EMODnet regional contaminants aggregated datasets, v2024. The product displays positions for every available year.
-

Level 3, hourly, sub-skin Sea Surface Temperature derived from **Meteosat Third Generation (MTG)** at 0° longitude, covering 60S-60N and 60W-60E and re-projected on a 0.05° regular grid, in GHRSST compliant netCDF format. The satellite input data come from MTG level 1 data processed at EUMETSAT. SST is retrieved from the Flexible Combined Imager (FCI) spectral imaging instrument, using a multi-spectral algorithm and a cloud mask. Atmospheric profiles of water vapor and temperature from a numerical weather prediction model, Sea Surface Temperature from an analysis, together with a radiative transfer model, are used to correct the multispectral algorithm for regional and seasonal biases due to changing atmospheric conditions.The quality of the products is monitored regularly by daily comparison of the satellite estimates against buoy measurements. The product format is compliant with the GHRSST Data Specification (GDS) version 2. Users are advised to use data only with quality levels 3, 4 and 5. This dataset is generated by Meteo-France in the frame of the [EUMETSAT Ocean & Sea Ice Satellite Application Facility (OSI SAF)](https://osi-saf.eumetsat.int/).
-
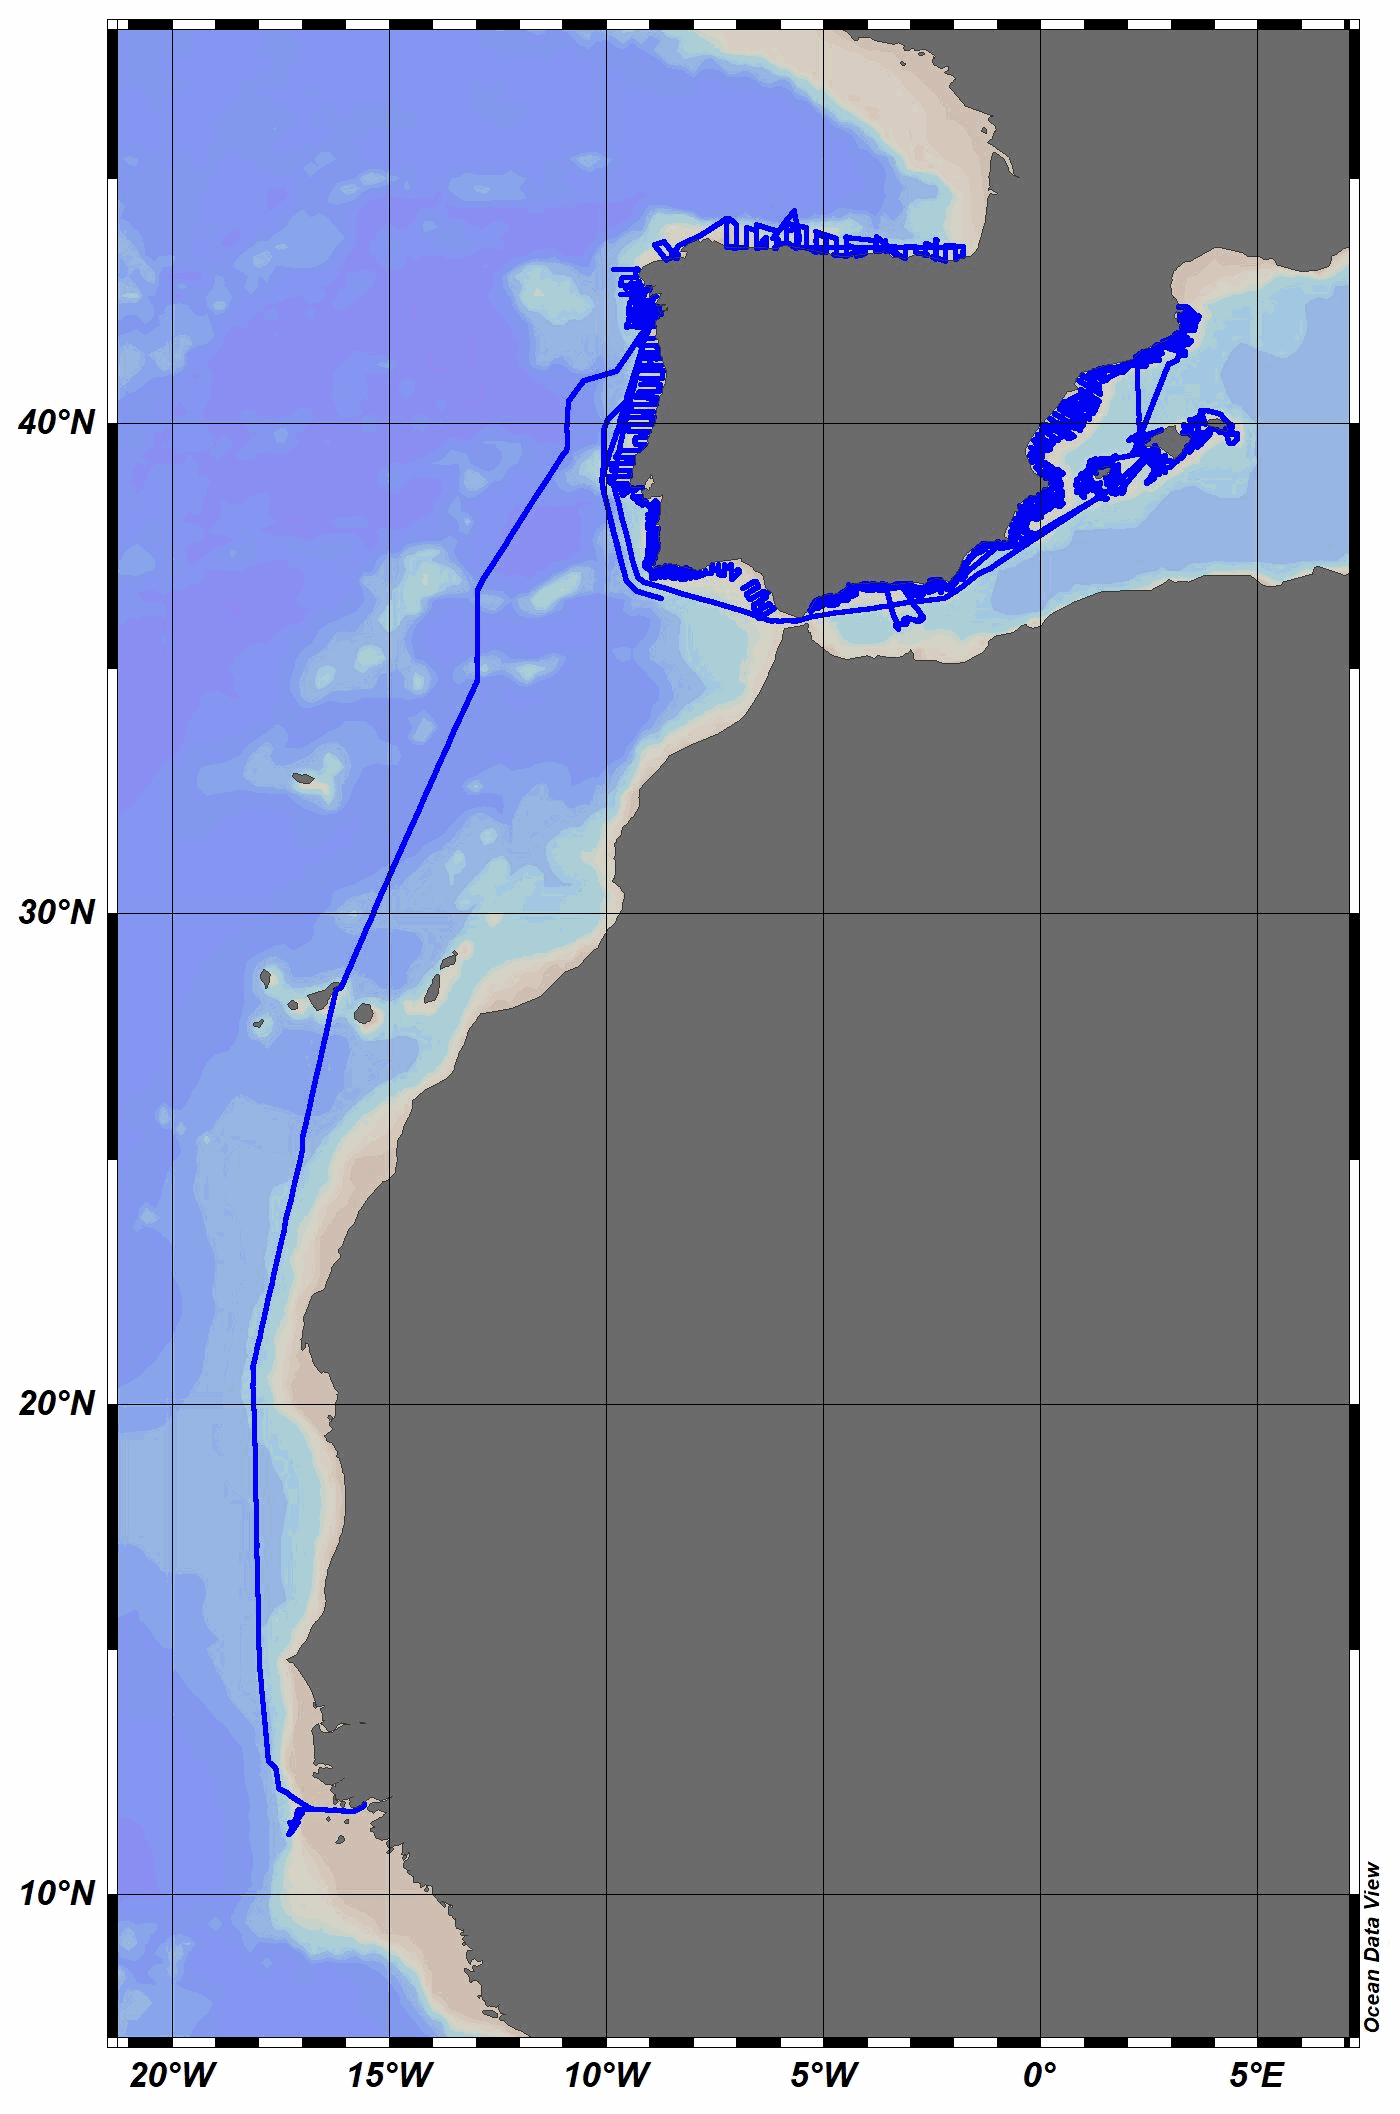
The R/V Miguel Oliver was built in 2007 for scientific fisheries assessment and oceanographic research purposes. Owned by the Spanish General Secretariat of Fisheries, it mainly operates around the Iberian Peninsula and Canary Islands waters. Equipped with an automatic weather station, collected data are daily sent to the Spanish Institute of Oceanography (IEO) Data Center / National Oceanographic Data Center (NODC) for delayed-mode quality control and long-term archive and dissemination. Recently, a semi-automatic process has been used to perform quality control and data assessment. The quality controlled data have been stored in MEDAR/MEDATLAS format, and the corresponding quality flag has been added to each individual measurement. This facilitates their reuse for different purposes, from climatology or academic studies to industrial sector needs, among others. In 2023, air temperature, relative humidity, wind speed and direction and solar radiation were collected.
-

This product displays for Tributyltin, positions with values counts that have been measured per matrix and are present in EMODnet regional contaminants aggregated datasets, v2024. The product displays positions for all available years.
-
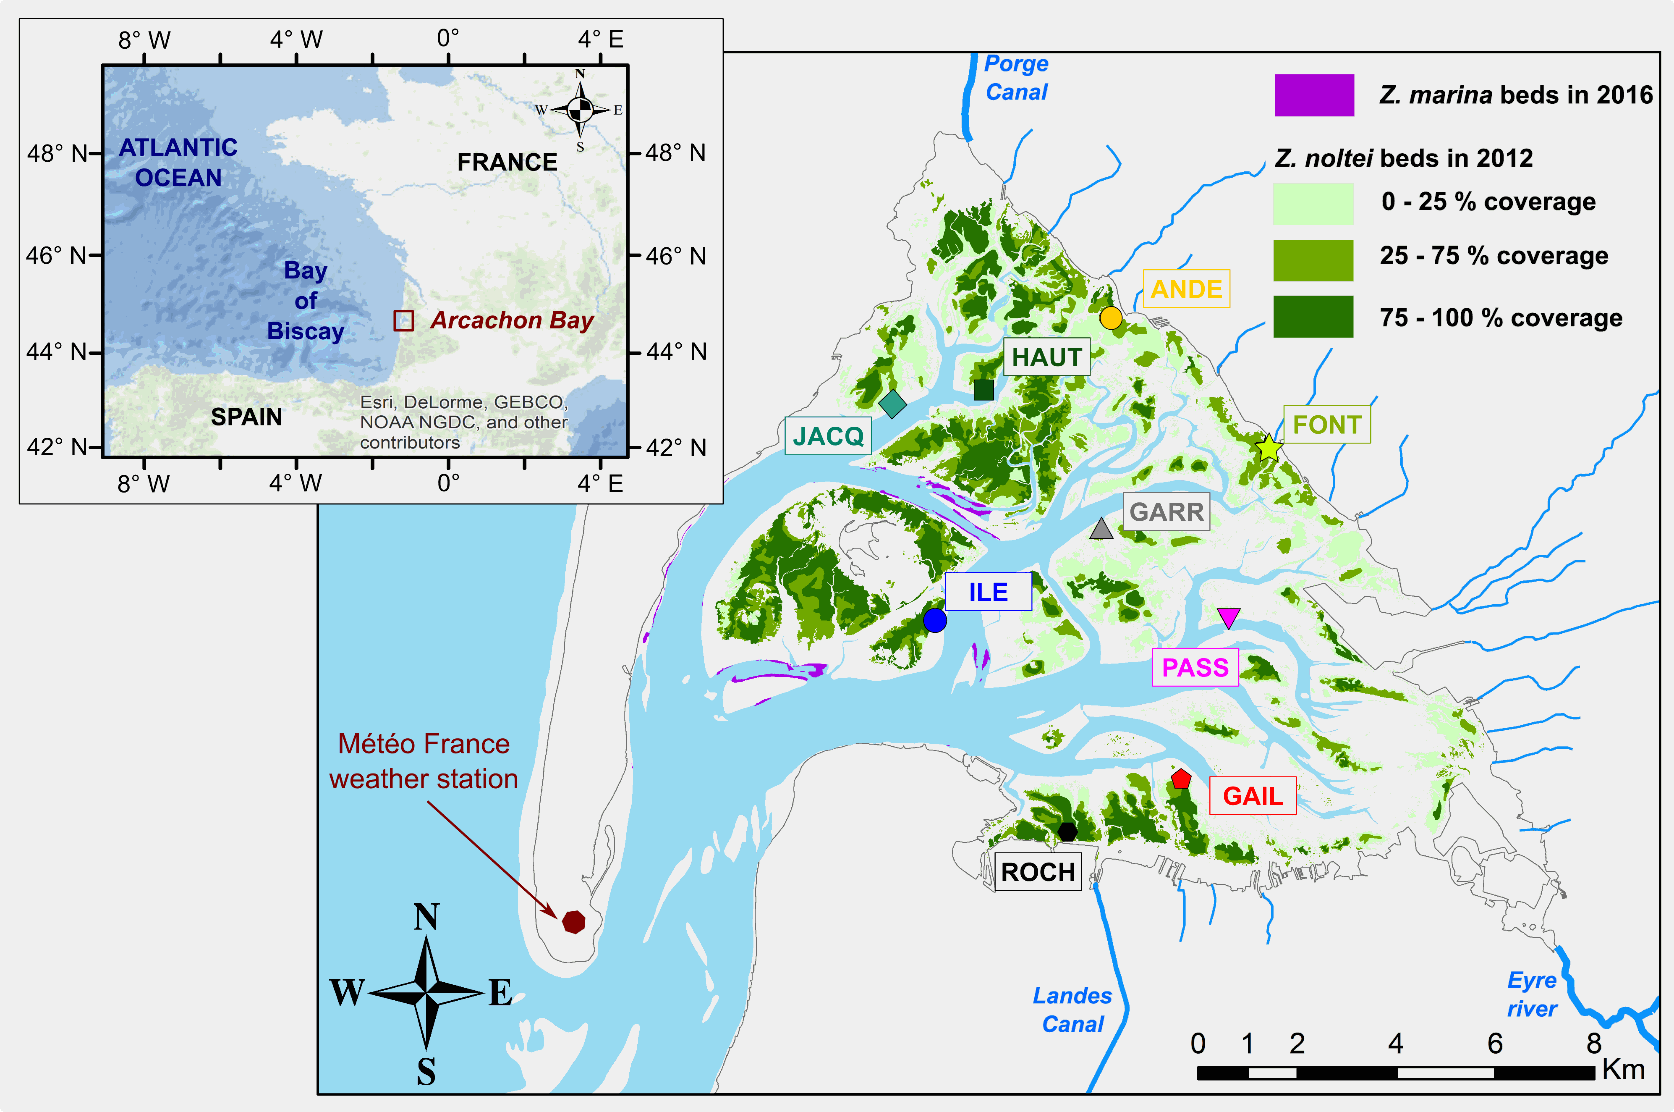
The ReZoEnv field campaign was conducted at 9 sites distributed within contrasted seagrass (Zostera notlei) meadows in the Arcachon Bay. This multi-parameter survey was conducted during one year (November 2015 – November 2016). Water levels, temperature and light were recorded every 10 minutes. While bed sediment characteristics (granulometry, water content, organic matter content), seagrass characteristics (coverage, biometry, chlorophyll and CNP content) were measured monthly. Additionally, wind-wave parameters were obtained from high frequency pressure sensor at 4 sites, every 20 minutes. List of sites : - ANDE : 44.745091 N, 1.121366 O - FONT : 44.722631 N, 1.080133 O - GAIL : 44.662573 N, 1.099575 O - GARR : 44.705132 N, 1.121562 O - HAUT : 44.729331 N, 1.15608 O - ILE : 44.683117 N, 1.162716 O - JACQ : 44.724563 N, 1.181109 O - PASS : 44.689927 N, 1.089491 O - ROCH : 44.648529 N, 1.127736 O
-
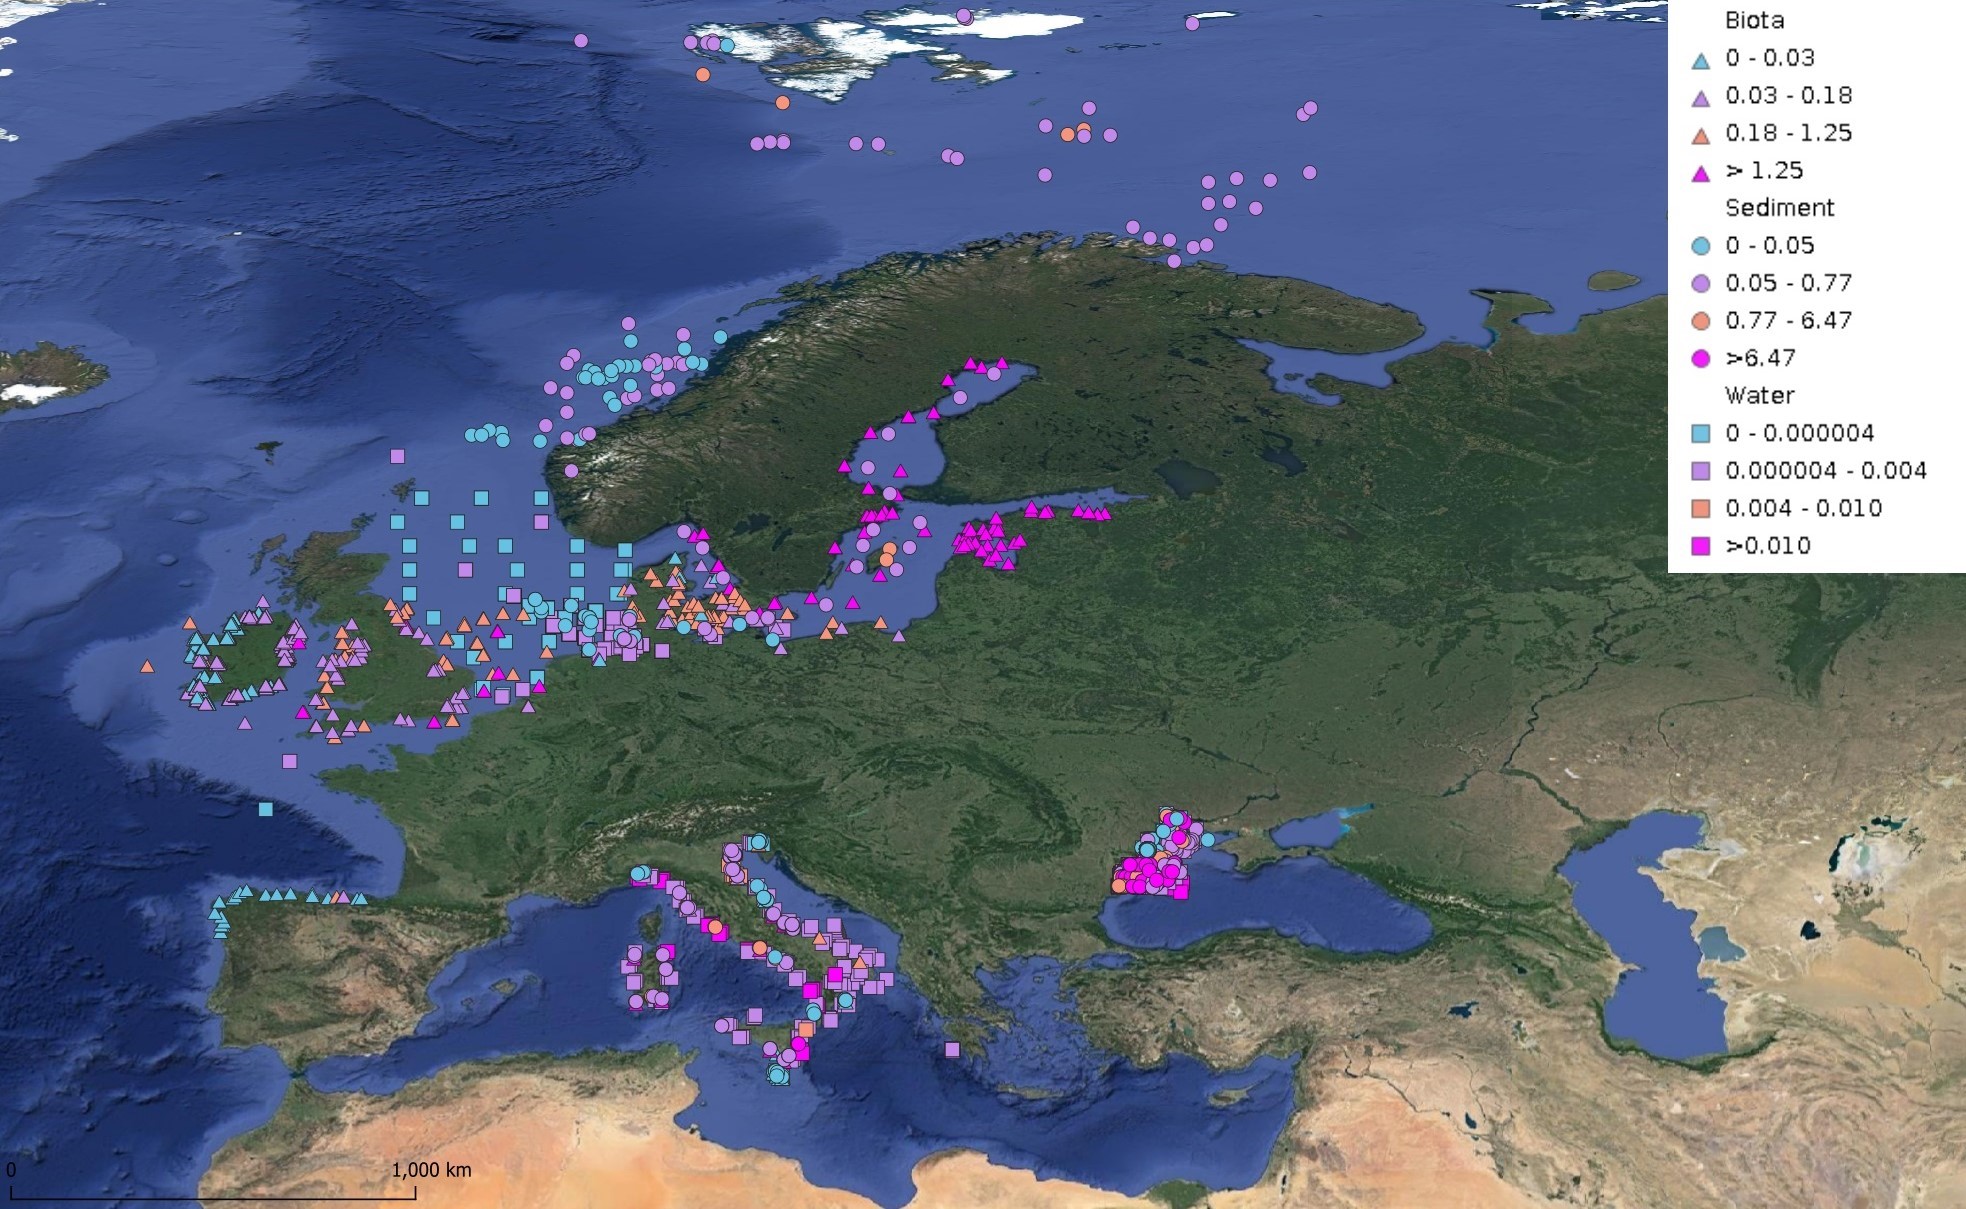
This product displays for Hexachlorobenzene, median values since 2012 that have been measured per matrix and are present in EMODnet regional contaminants aggregated datasets, v2024. The median values ranges are derived from the following percentiles: 0-25%, 25-75%, 75-90%, >90%. Only "good data" are used, namely data with Quality Flag=1, 2, 6, Q (SeaDataNet Quality Flag schema). For water, only surface values are used (0-15 m), for sediment and biota data at all depths are used.
-
Water_body_dissolved_oxygen_concentration - Monthly Climatology for the European Seas for the period 1960-2023 on the domain from longitude -45.0 to 70.0 degrees East and latitude 24.0 to 83.0 degrees North. Data Sources: observational data from SeaDataNet/EMODnet Chemistry Data Network. Description of DIVA analysis: The computation was done with the DIVAnd (Data-Interpolating Variational Analysis in n dimensions), version 2.7.12, using GEBCO 30sec topography for the spatial connectivity of water masses. Horizontal correlation length and vertical correlation length vary spatially depending on the topography and domain. Depth range: 0.0, 5.0, 10.0, 15.0, 20.0, 25.0, 30.0, 35.0, 40.0, 45.0, 50.0, 55.0, 60.0, 65.0, 70.0, 75.0, 80.0, 85.0, 90.0, 95.0, 100.0, 125.0, 150.0, 175.0, 200.0, 225.0, 250.0, 275.0, 300.0, 325.0, 350.0, 375.0, 400.0, 425.0, 450.0, 475.0, 500.0, 550.0, 600.0, 650.0, 700.0, 750.0, 800.0, 850.0, 900.0, 950.0, 1000.0, 1050.0, 1100.0, 1150.0, 1200.0, 1250.0, 1300.0, 1350.0, 1400.0, 1450.0, 1500.0, 1550.0, 1600.0, 1650.0, 1700.0, 1750.0, 1800.0, 1850.0, 1900.0, 1950.0, 2000.0, 2100.0, 2200.0, 2300.0, 2400.0, 2500.0, 2600.0, 2700.0, 2800.0, 2900.0, 3000.0, 3100.0, 3200.0, 3300.0, 3400.0, 3500.0, 3600.0, 3700.0, 3800.0, 3900.0, 4000.0, 4100.0, 4200.0, 4300.0, 4400.0, 4500.0, 4600.0, 4700.0, 4800.0, 4900.0, 5000.0, 5100.0, 5200.0, 5300.0, 5400.0, 5500.0 m. Units: umol/l. The horizontal resolution of the produced DIVAnd analysis is 0.25 degrees.
-

'''Short description:''' For the Atlantic Ocean - The product contains daily Level-3 sea surface wind with a 1km horizontal pixel spacing using Synthetic Aperture Radar (SAR) observations and their collocated European Centre for Medium-Range Weather Forecasts (ECMWF) model outputs. Products are processed homogeneously starting from the L2OCN products. '''DOI (product) :''' https://doi.org/10.48670/mds-00339
-
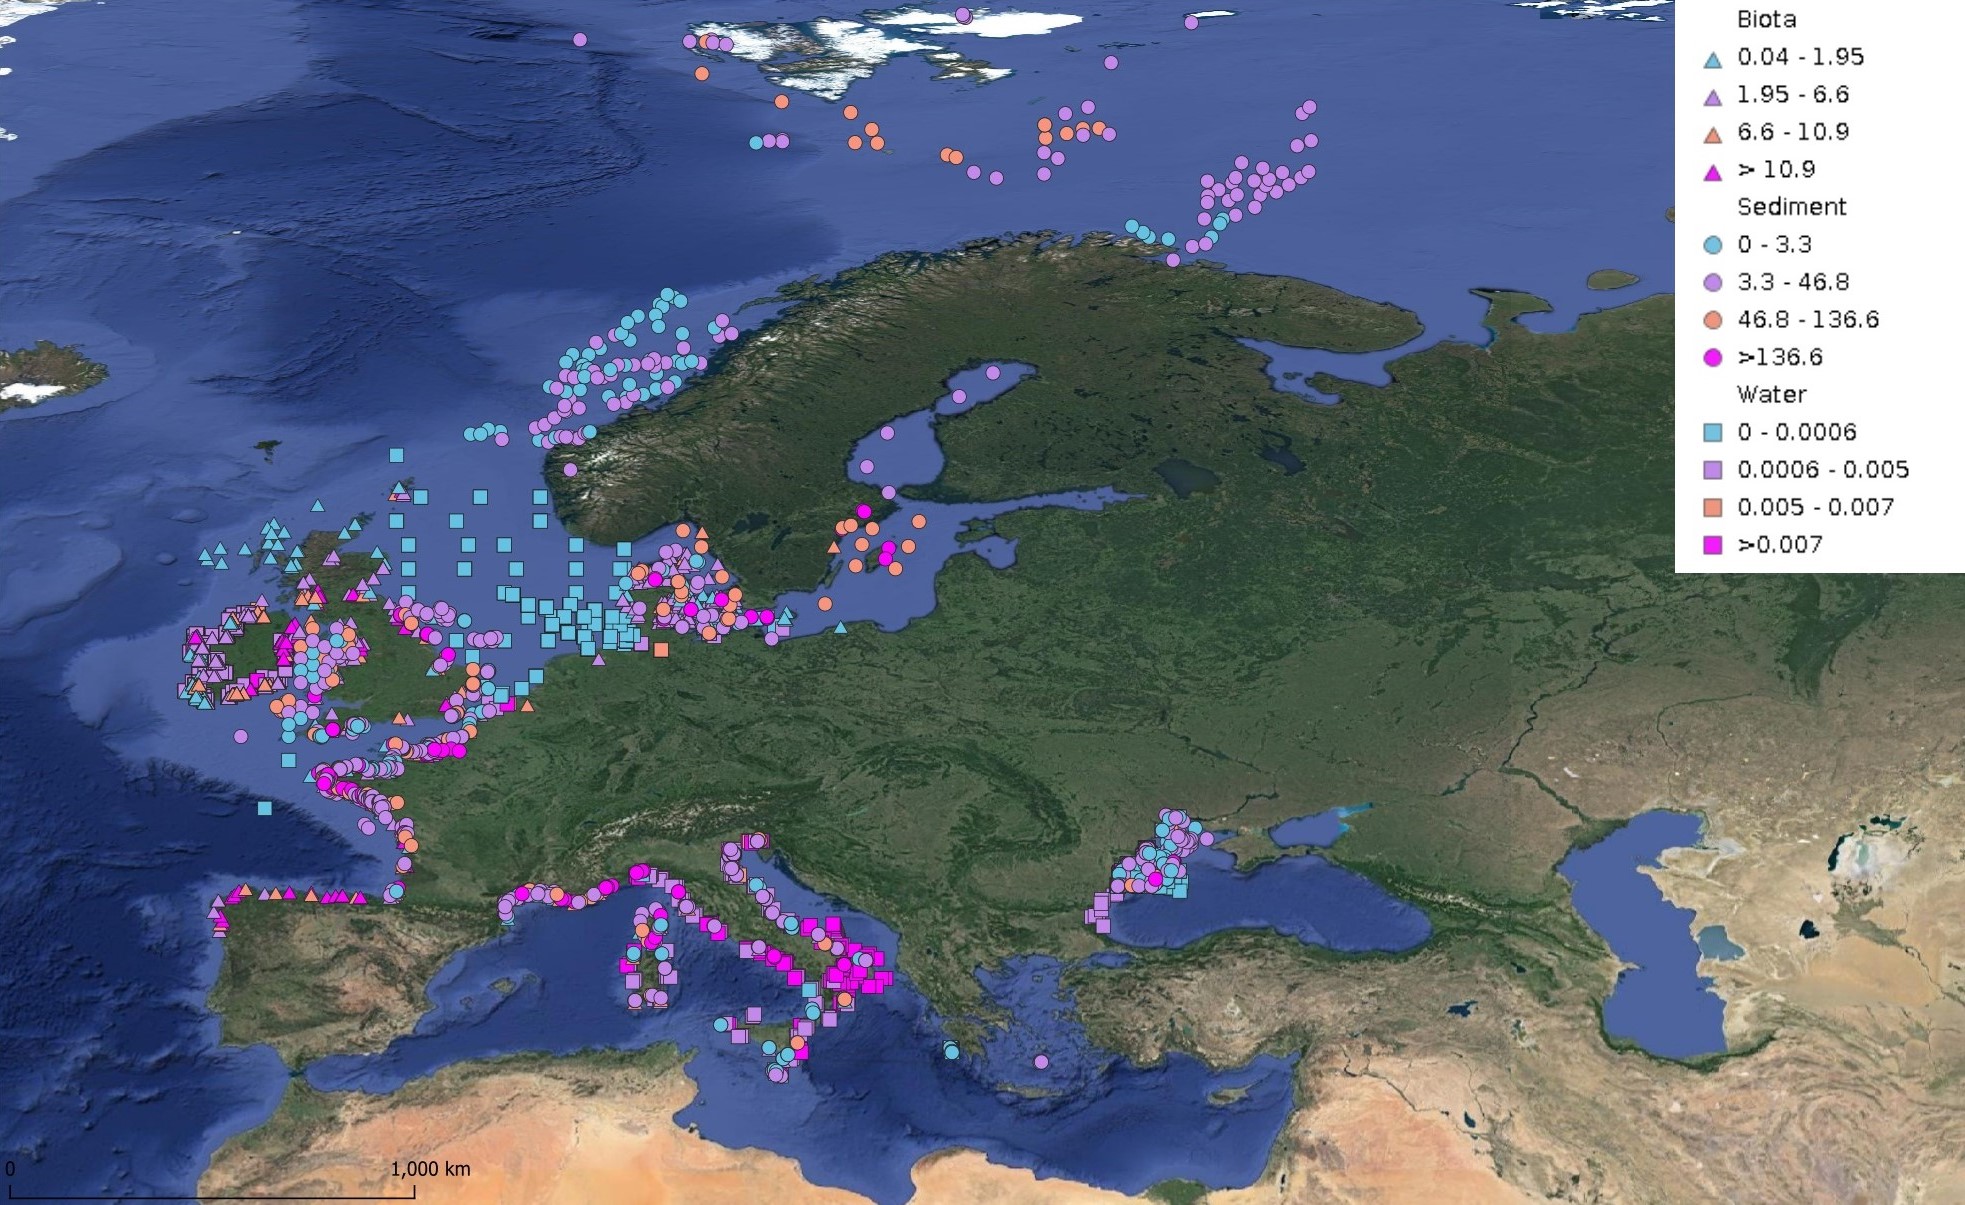
This product displays for Fluoranthene, median values since 2012 that have been measured per matrix and are present in EMODnet regional contaminants aggregated datasets, v2024. The median values ranges are derived from the following percentiles: 0-25%, 25-75%, 75-90%, >90%. Only "good data" are used, namely data with Quality Flag=1, 2, 6, Q (SeaDataNet Quality Flag schema). For water, only surface values are used (0-15 m), for sediment and biota data at all depths are used.