 Catalogue PIGMA
10000
Type of resources
Available actions
Topics
Keywords
Contact for the resource
Provided by
Years
Formats
Representation types
Update frequencies
status
Scale
Resolution
-
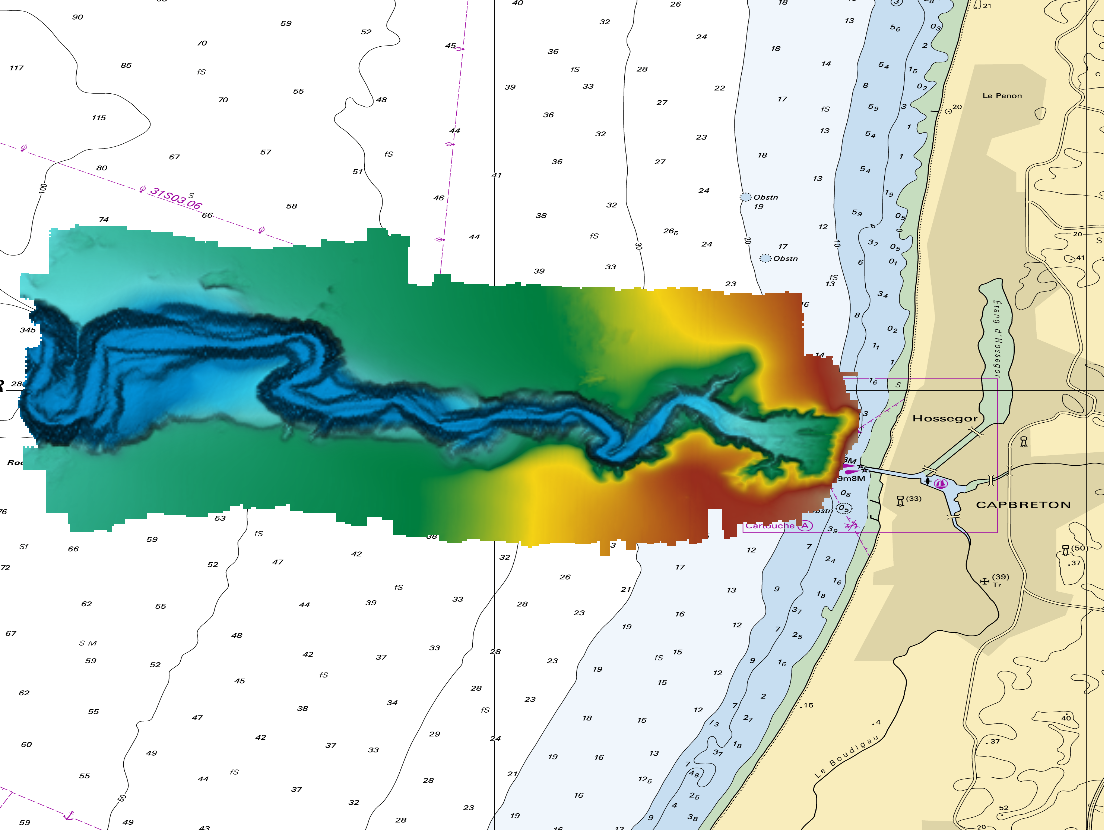
The DTM is a compilation of multibeam echosounder surveys acquired in 2013. The resolution is 1/64 arc-minutes (~30m). Surveys are located on the Capbreton Submarine Canyon (France) with depths from -4.7m to -344.9m. Depths are referenced to the Lowest Astronomical Tide and the coordinates are expressed into the WGS84 reference frame. The surveys which compose the DTM are S201306500-09 and S201306500-11. Data and metadata associated to these surveys are available on the website http://diffusion.shom.fr/pro/lots-bathy.html. The DTM is not to be used for navigation.
-
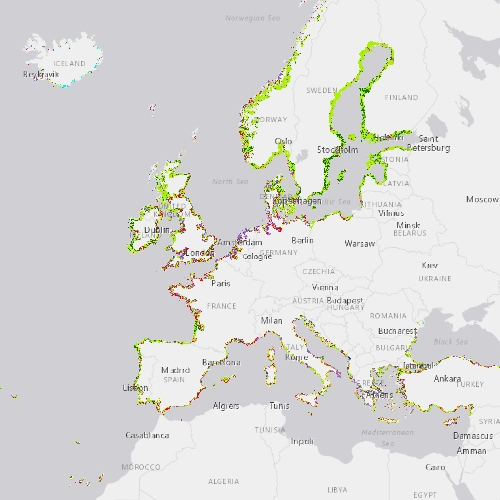
The Coastal Zones LC/LU Change (CZC) 2012-2018 is providing the Land Cover / Land Use (LC/ LU) change for areas along the coastline of the EEA38 countries and the United Kingdom, between the reference years 2012 and 2018. The Coastal Zones product monitors landscape dynamics in European coastal territory to an inland depth of 10 km with a total area of approximately 730,000 km², with all the relevant areas (estuaries, coastal lowlands, nature reserves). The production of the coastal zone layers was coordinated by the European Environment Agency (EEA) in the frame of the EU Copernicus programme, as part of the Copernicus Land Monitoring Service (CLMS) Local Component. The Coastal Zones Change product covers a buffer zone of coastline derived from EU-Hydro v1.1. The Land Cover/Land Use (LC/LU) Change layer is extracted from Very High Resolution (VHR) satellite data and other available data. The reference years for the change are 2012 and 2018. The class definitions follow the pre-defined nomenclature on the basis of Mapping and Assessment of Ecosystems and their Services (MAES) typology of ecosystems (Level 1 to Level 4) and CORINE Land Cover adapted to the specific characteristics of coastal zones. The classification provides 71 distinct thematic classes with a Minimum Mapping Unit (MMU) of 0.5 ha and a Minimum Mapping Width (MMW) of 10 m. The status product is available for the 2012 and 2018 reference years. This CZC dataset is distributed in vector format, in a single OGC GeoPackage file covering the area of interest.
-
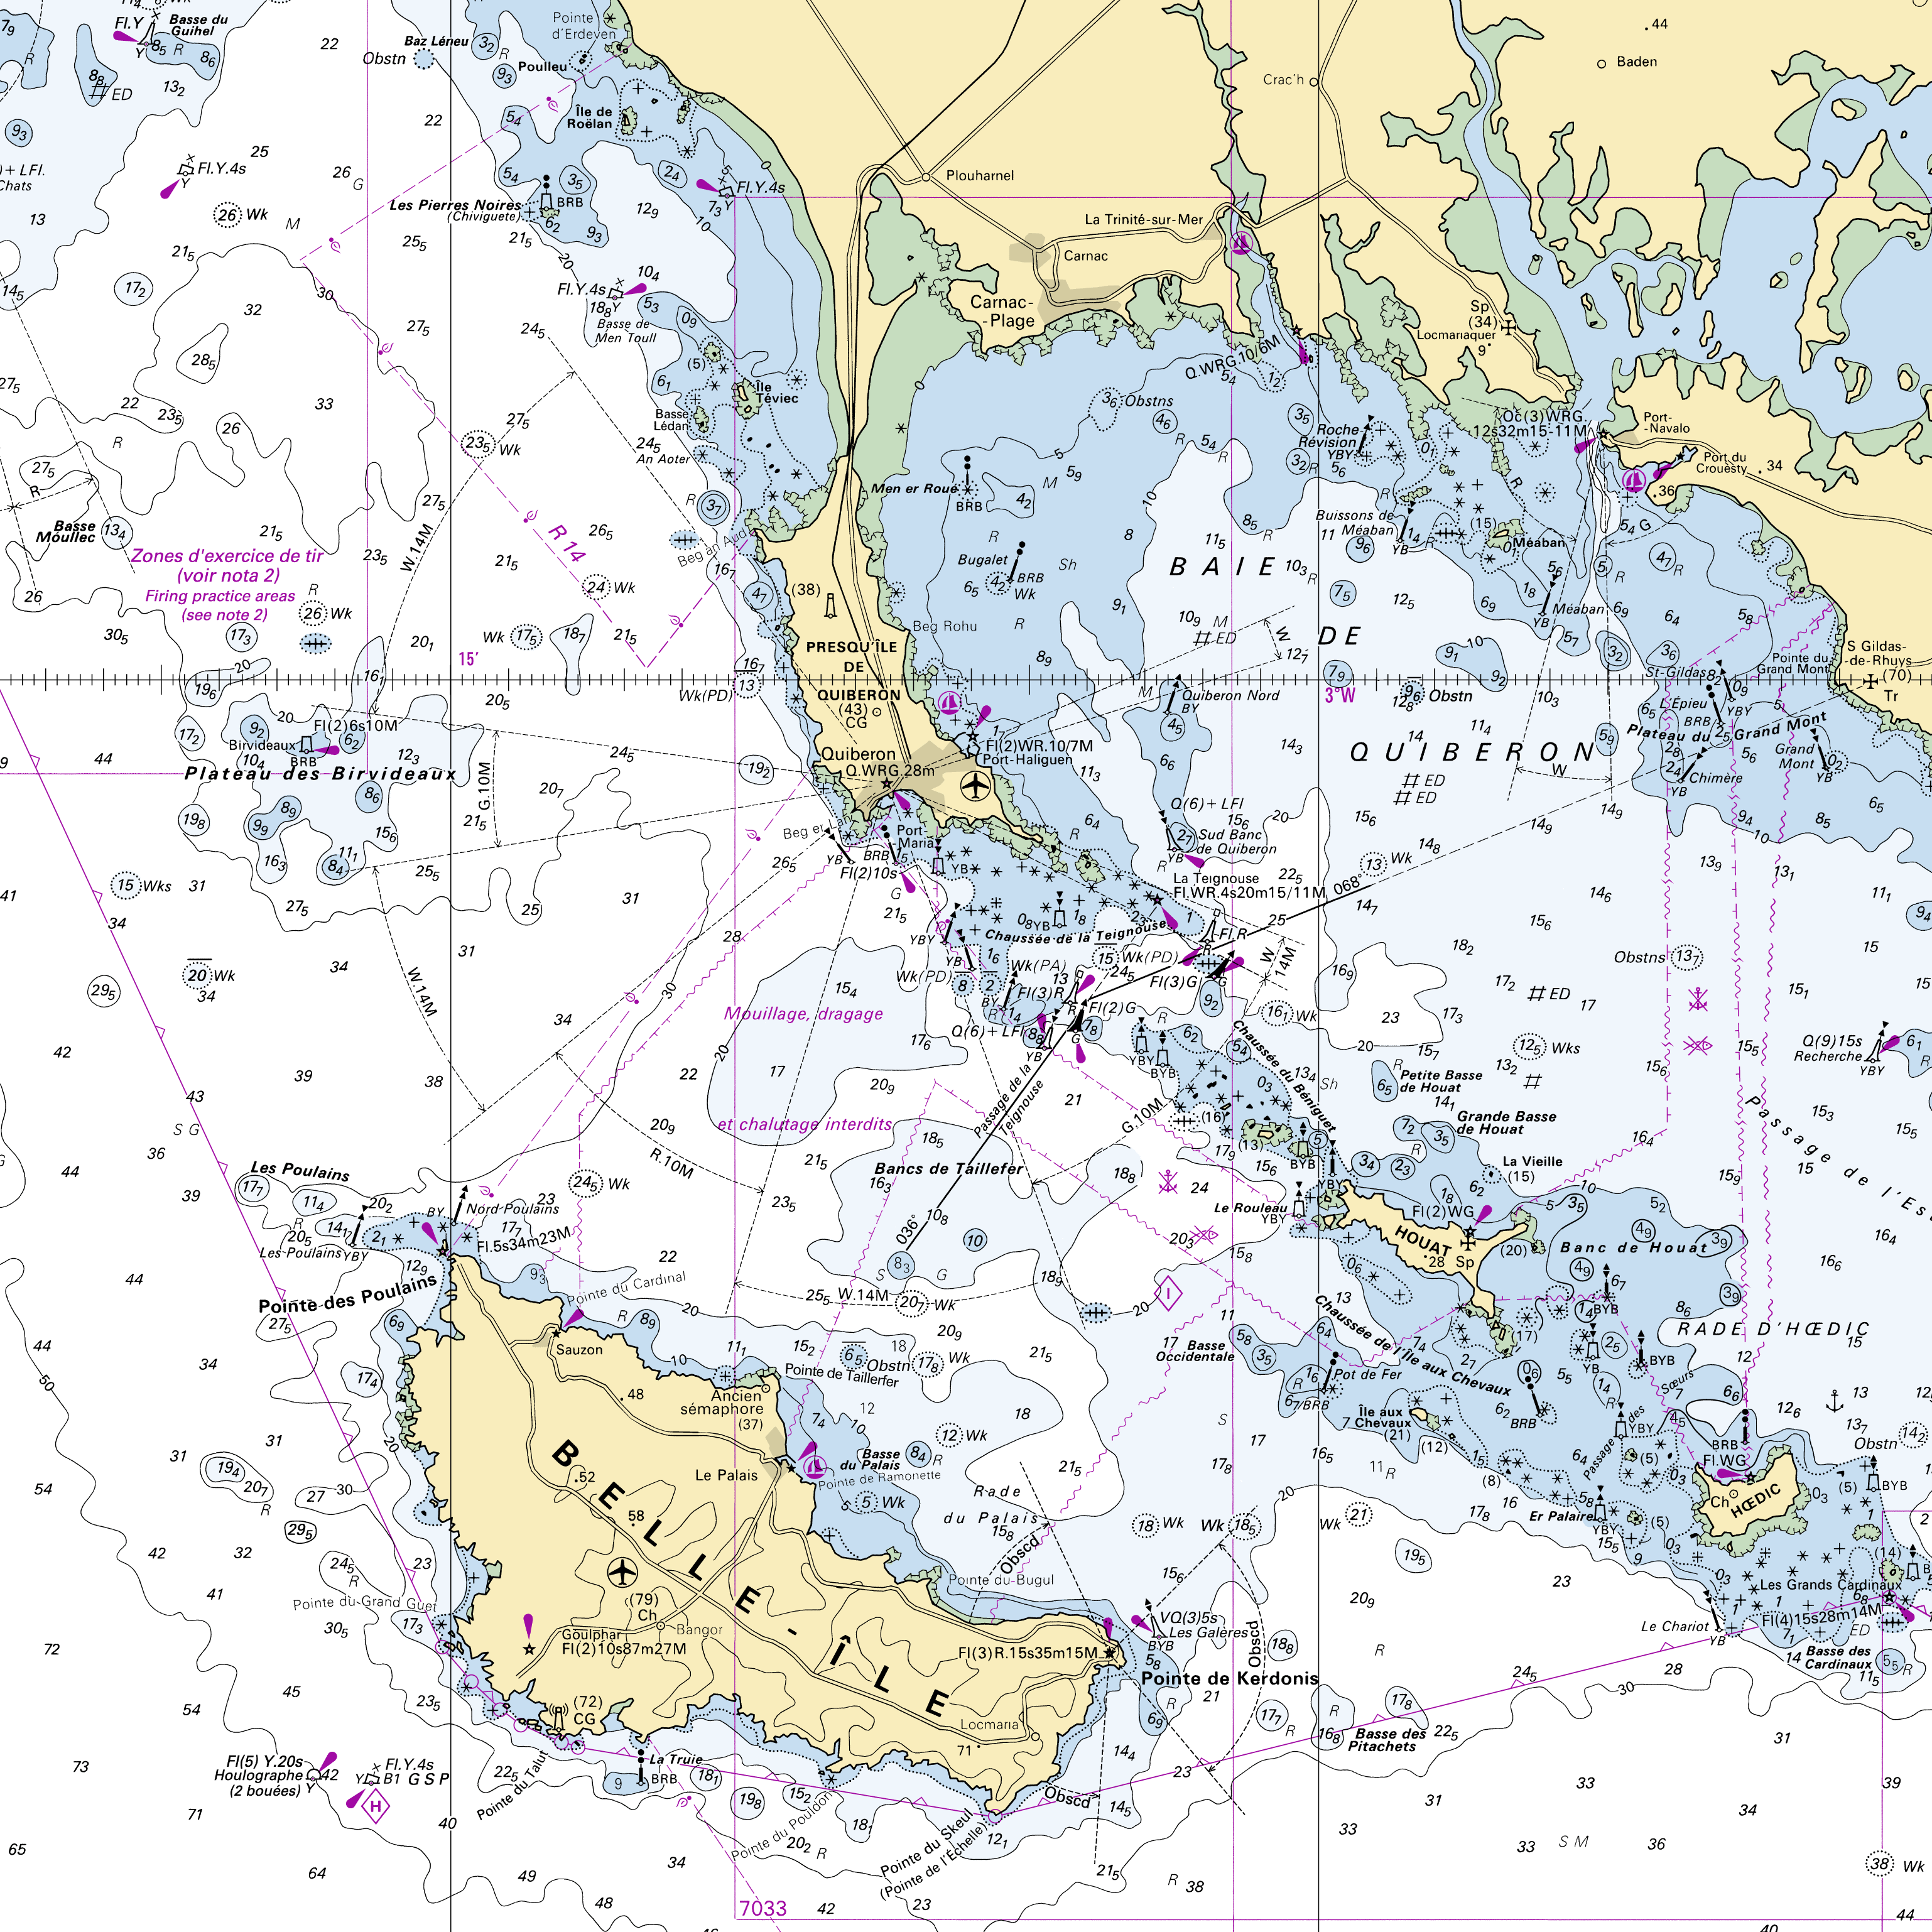
RasterMarine is a series of digital images taken from nautical charts, with no additions, legends or georeferencing information. The RasterMarine range is available at six sets of scales: - RasterMarine10 1:10,000 - RasterMarine25 1:25,000 - RasterMarine50 1:50,000 - RasterMarine100 1:100,000 - RasterMarine350 1:350,000 - RasterMarine1M 1:1,000,000. Unless exceptional circumstances apply, the RasterMarine range is updated on a weekly basis and the modified grid squares are re-published, replacing the previous versions. All corrections, publications, editions and suppressions with an effect on the reference nautical charts are taken into consideration. <br /> 09/07/2026 version <br />
-
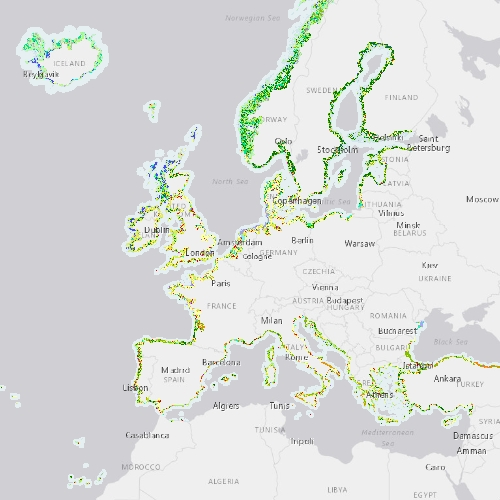
The Coastal Zones (CZ) LC/LU product for 2012 is providing a detailed Land Cover / Land Use (LC/ LU) dataset for areas along the coastline of the EEA38 countries and the United Kingdom, with reference year 2012 for the classification. This product monitors landscape dynamics in European coastal territory to an inland depth of 10 km with a total area of approximately 730,000 km², with all the relevant areas (estuaries, coastal lowlands, nature reserves). The production of the coastal zone layers was coordinated by the European Environment Agency (EEA) in the frame of the EU Copernicus programme, as part of the Copernicus Land Monitoring Service (CLMS) Local Component. The Coastal Zones product covers a buffer zone of coastline derived from EU-Hydro v1.1. Land Cover/Land Use (LC/LU) layer is extracted from Very High Resolution (VHR) satellite data and other available data. The class definitions follow the pre-defined nomenclature on the basis of Mapping and Assessment of Ecosystems and their Services (MAES) typology of ecosystems (Level 1 to Level 4) and CORINE Land Cover adapted to the specific characteristics of coastal zones. The classification provides 71 distinct thematic classes with a Minimum Mapping Unit (MMU) of 0.5 ha and a Minimum Mapping Width (MMW) of 10 m. The product is available for the 2012 and 2018 reference year including change mapping. This CZ dataset is distributed in vector format, in a single OGC GeoPackage SQLite file covering the area of interest.
-

The Digital Terrain Model of the Bay of Biscaye and of the Channel is the result of the processing of a compilation of single and multibeam echosounder data, of DTMs and of chart countours produced before 2008 for hydrodynamic modeling.
-

The Coastal Zones (CZ) LC/LU product for 2018 is providing a detailed Land Cover / Land Use (LC/ LU) dataset for areas along the coastline of the EEA38 countries and the United Kingdom, with reference year 2018 for the classification. This product monitors landscape dynamics in European coastal territory to an inland depth of 10 km with a total area of approximately 730,000 km², with all the relevant areas (estuaries, coastal lowlands, nature reserves). The production of the coastal zone layers was coordinated by the European Environment Agency (EEA) in the frame of the EU Copernicus programme, as part of the Copernicus Land Monitoring Service (CLMS) Local Component. The Coastal Zones product covers a buffer zone of coastline derived from EU-Hydro v1.1. Land Cover/Land Use (LC/LU) layer is extracted from Very High Resolution (VHR) satellite data and other available data. The class definitions follow the pre-defined nomenclature on the basis of Mapping and Assessment of Ecosystems and their Services (MAES) typology of ecosystems (Level 1 to Level 4) and CORINE Land Cover adapted to the specific characteristics of coastal zones. The classification provides 71 distinct thematic classes with a Minimum Mapping Unit (MMU) of 0.5 ha and a Minimum Mapping Width (MMW) of 10 m. The product is available for the 2012 and 2018 reference year including change mapping. This CZ dataset is distributed in vector format, in a single OGC GeoPackage SQLite file covering the area of interest.
-
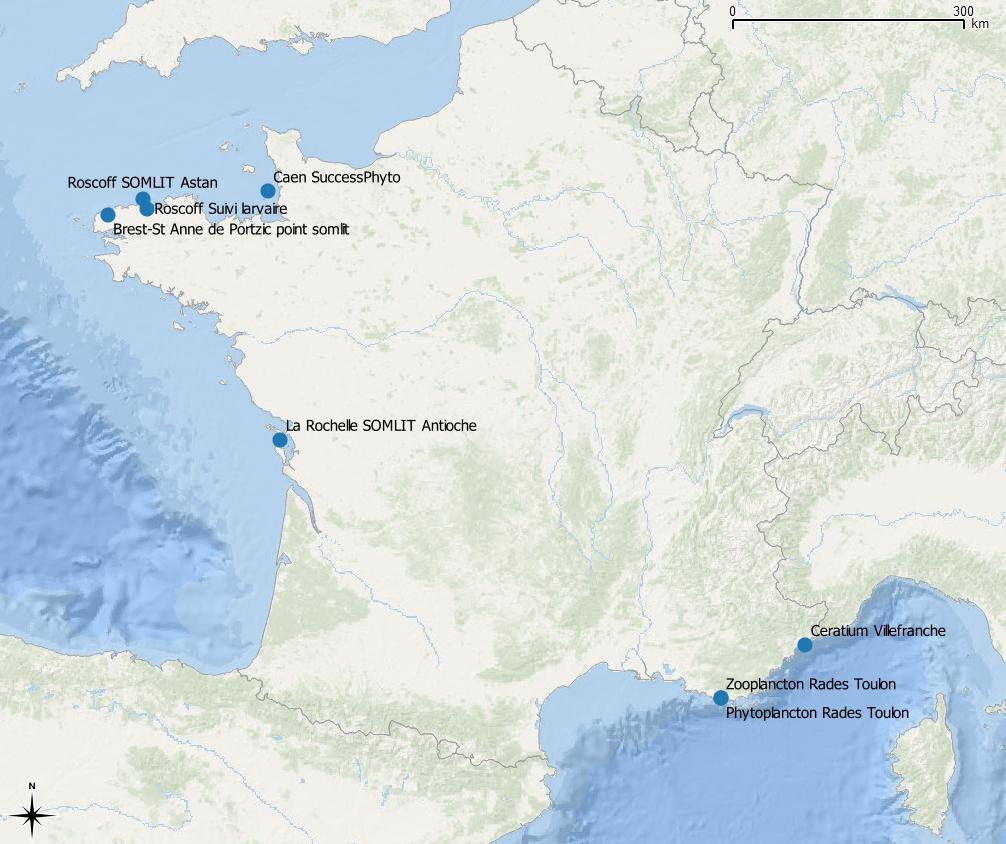
La base de données PELAGOS regroupe des données de biodiversité de l’écosystème pélagique côtier (dont des séries temporelles). L’un des objectifs est d’exploiter l’information biologique acquise, pour répondre à des questions scientifiques concernant par exemple les facteurs qui contrôlent la distribution et l’abondance des organismes pélagiques à différentes échelles spatiales et à différentes échelles de temps. Ces données présentent le suivi du site de la Petite Rade (PROTEE-EBMA Université de Toulon) faisant partie du RESOMAR et concernent le comptage taxinomique phytoplancton (3 mètres de profondeur) de 2006 à 2007.
-
Les émissions de polluants en Nouvelle-Aquitaine sont déterminées conformément aux recommandations du document "Guide méthodologique pour l'élaboration des inventaires territoriaux des émissions atmosphériques (polluants de l'air et gaz à effet de serre)" établi par le Pôle de Coordination des Inventaires Territoriaux (PCIT).
-

Toponymes marins utilisés dans le cadre de l'analyse des socio-écosystèmes côtiers
-

Cette couche représente les servitudes hertziennes PT2 des sémaphores.