 Catalogue PIGMA
/Etat du Milieu/Biogéochimie
Type of resources
Available actions
Topics
Keywords
Contact for the resource
Provided by
Years
Formats
Representation types
Update frequencies
status
Scale
Resolution
-
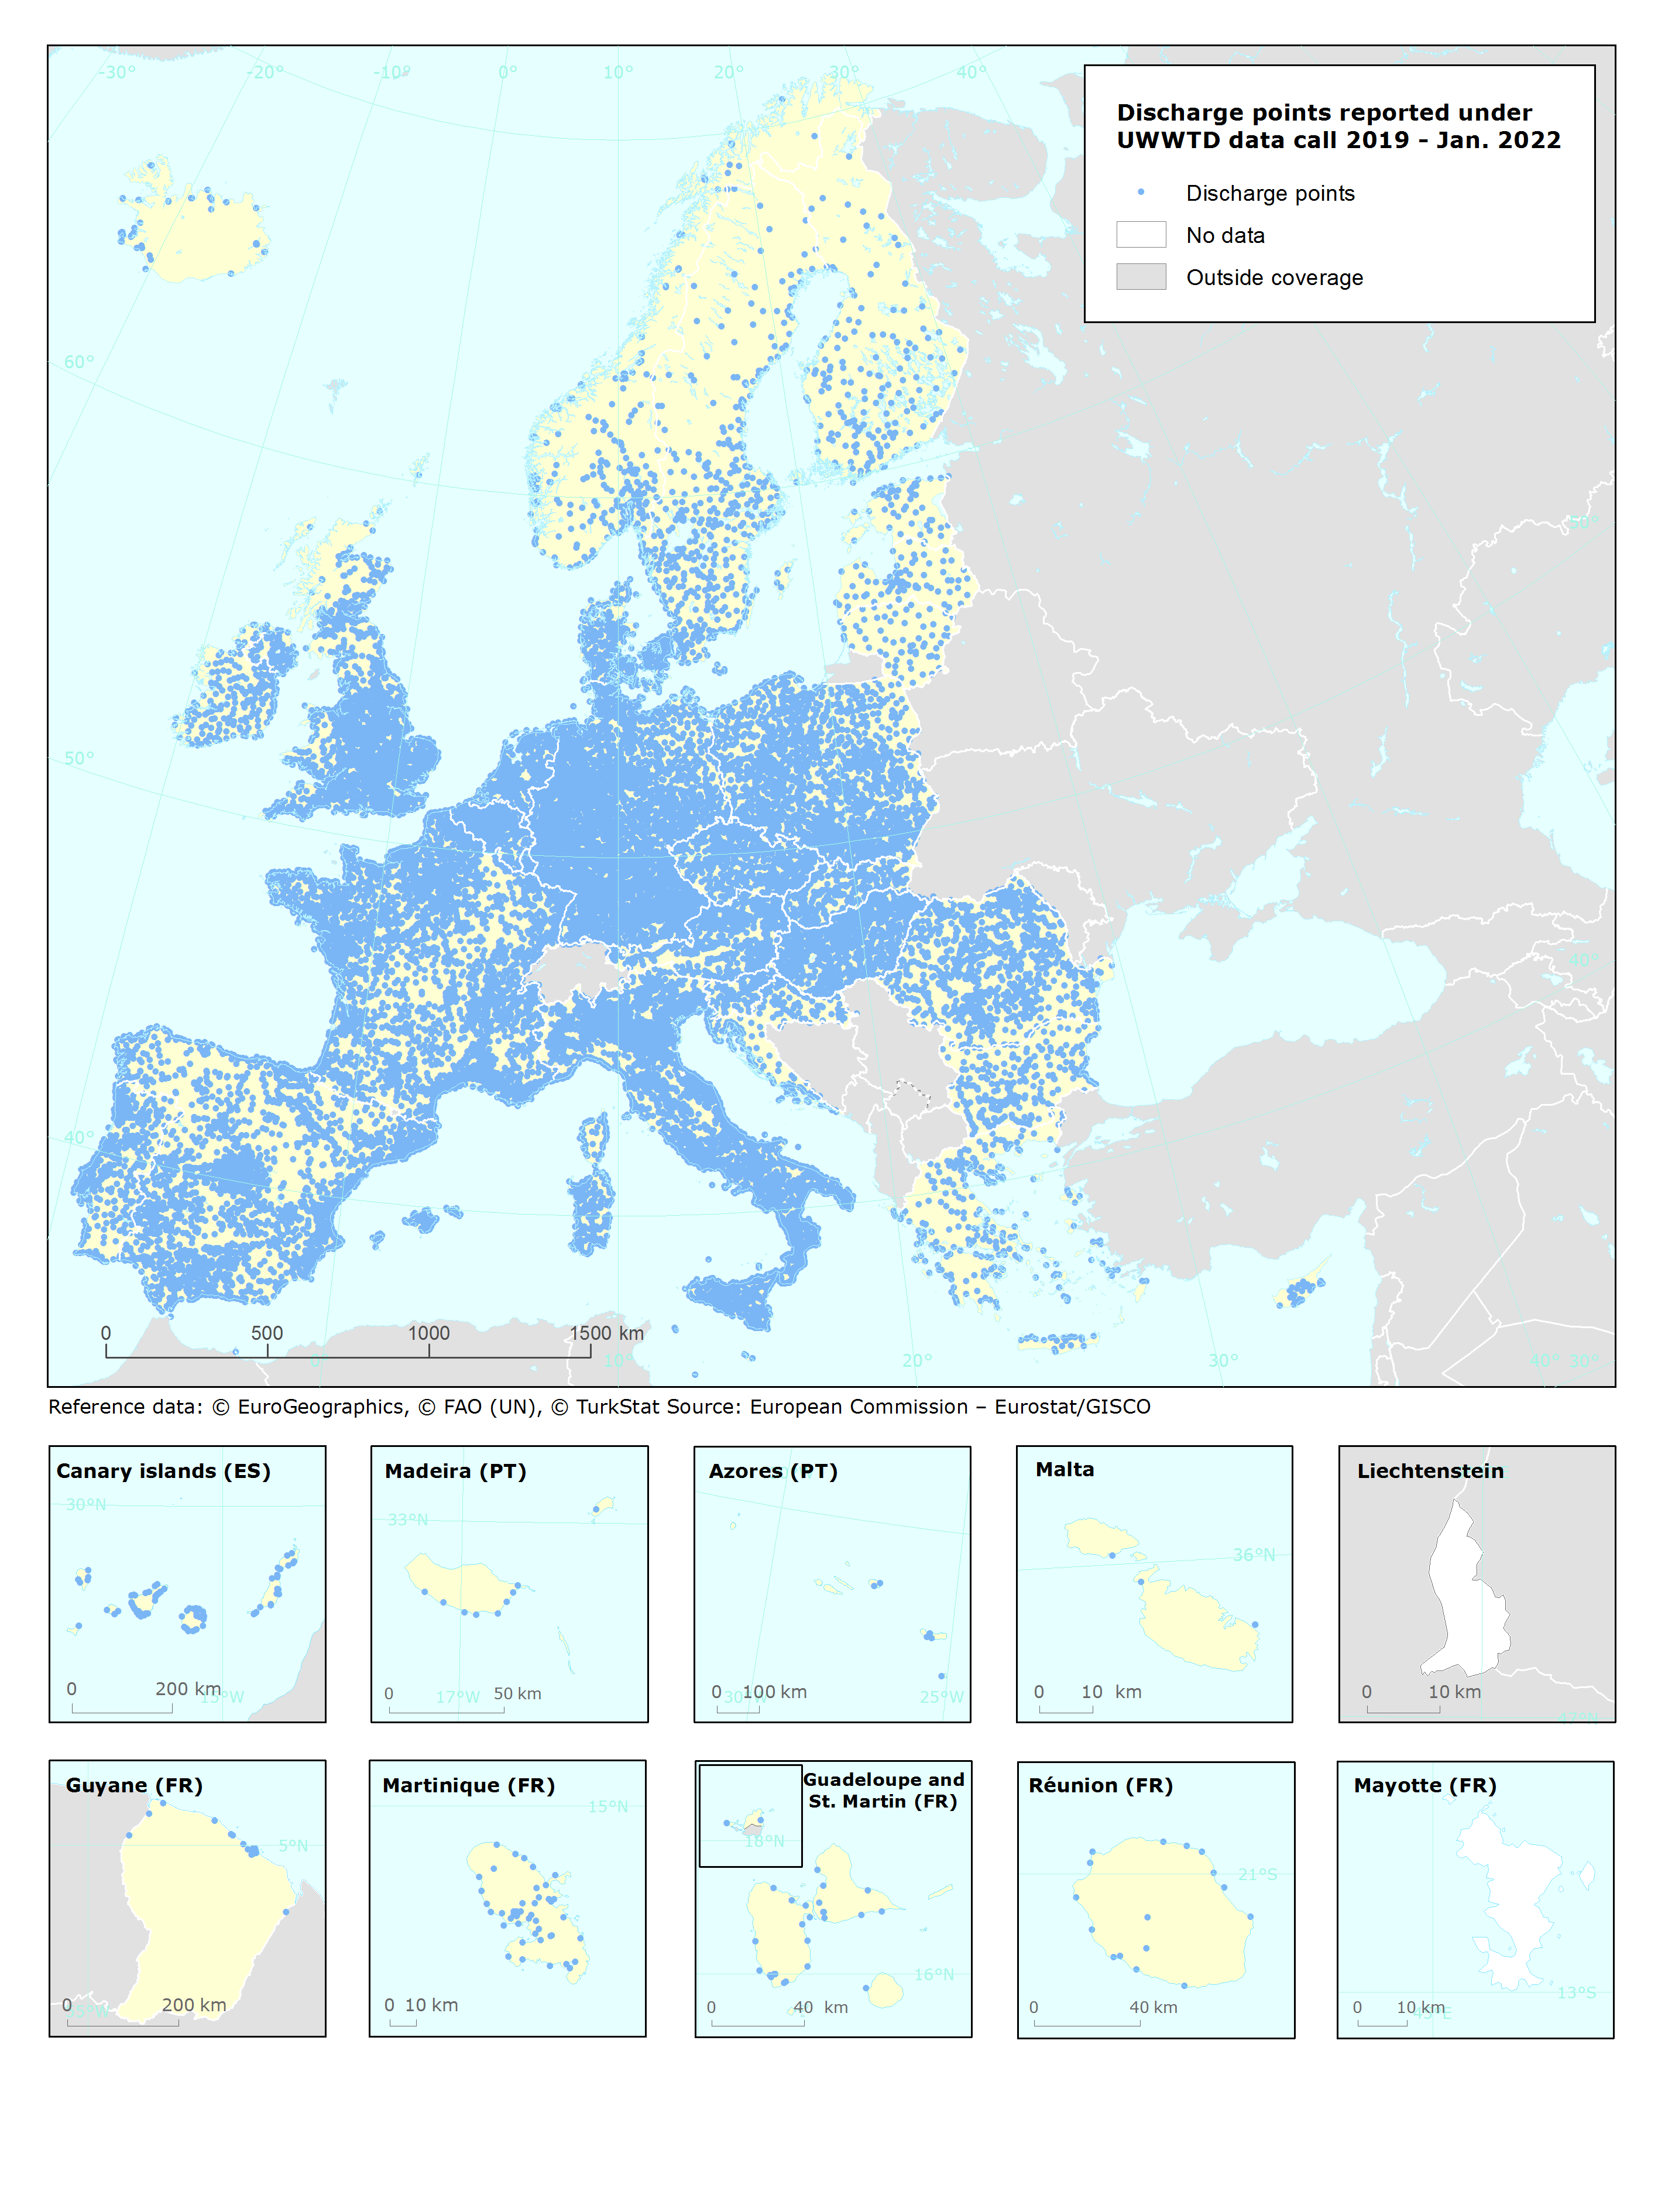
UWWTD Discharge Points, Jan. 2022 is one of the datasets produced within the frame of the reporting under 11th UWWTD Art.15 reporting period (UWWTD data call 2019). The Urban Waste Water Treatment Directive (UWWTD) (91/271/EEC) obliges Member States to report data on the implementation of the Directive upon request from the European Commission bi-annually. Reported data include receiving areas as designated under UWWTD, agglomerations, urban waste water treatment plants serving the agglomerations and points of discharges. Dataset UWWTD_DischargePoints contains information on individual points of discharge from urban waste water treatment plants or collecting systems, including their coordinates of discharge, link to specific treatment plant, type of receiving area into which the effluent / wastewater is discharged, related waterbody (or river basin), information on the discharge on land and potential reuse of the treated waste water. This dataset includes the reported discharge points which are displayed on the UWWTD maps (https://www.eea.europa.eu/themes/water/european-waters/water-use-and-environmental-pressures/uwwtd/interactive-maps/urban-waste-water-treatment-maps-3). The active discharge points with correct coordinates in the reported data were selected from the source European UWWTD tabular dataset, which is available on the download link https://www.eea.europa.eu/data-and-maps/data/waterbase-uwwtd-urban-waste-water-treatment-directive-7. The definition of the UWWTD Discharge Points dataset attributes (fields) is available on the link https://dd.eionet.europa.eu/datasets/latest/UWWTDArt15/tables/DischargePoints The full (internal) dataset including inactive discharge points is available under "Urban Waste Water Treatment Directive, Discharge points reported under UWWTD data call 2019 - INTERNAL VERSION, Jan. 2022". In comparison to the previous version (Nov. 2020), late redeliveries and corrections provided by several countries during 2021 are included in current revision. Next, the dataset is provided in GeoPackage and ESRI File geodatabase formats instead of shapefile used up to now, to avoid truncation of attribute names.
-
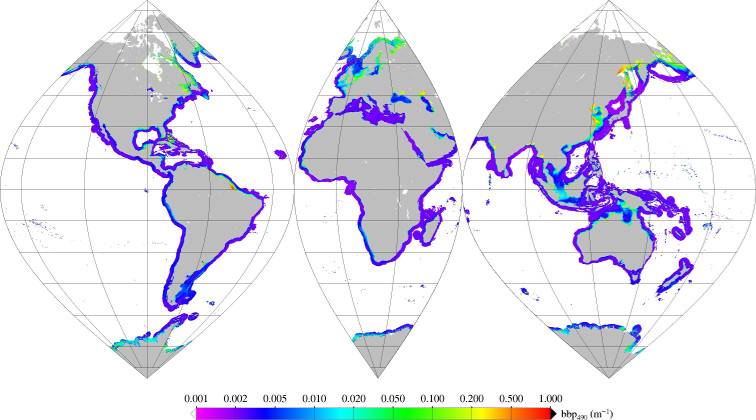
Moyenne mensuelle du coefficient de rétrodiffusion des particules (bbp) à 490nm(2002-2012), pour la zone côtière à l'échelle globale, à partir du capteur MERIS et avec les corrections atmosphérique POLYMER. Ref: Loisel en préparation
-
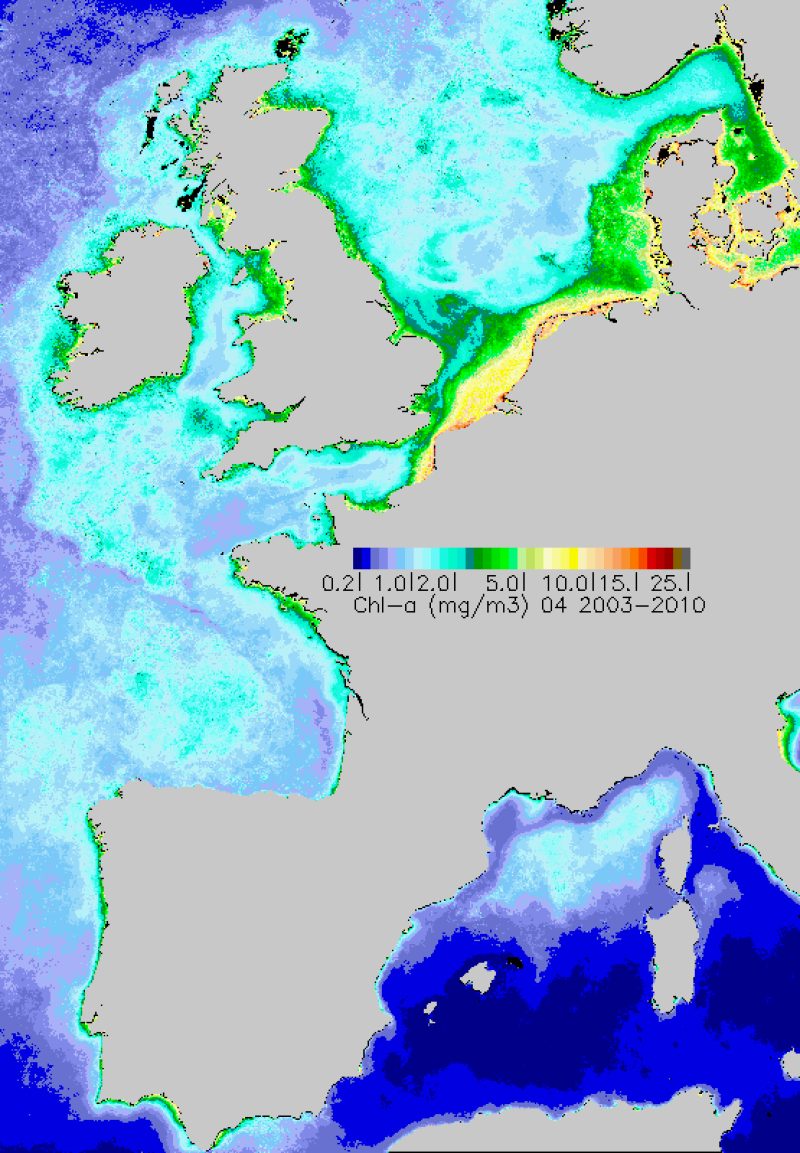
Percentile 90 calculé sur la période productive au sens DCE (mars-octobre) 2003-2009, à partir des Chl-a MODIS traitées par l'algorithme Ifremer OC5.
-
Moyenne mensuelle de l'absorption moins l'absorption de l'eau pure (anw) à 412nm (2002-2012), d'après Vantrepotte (2015), pour la zone côtière à l'échelle globale, à partir du capteur MERIS et avec les corrections atmosphérique POLYMER. Ref: Loisel (en préparation)
-
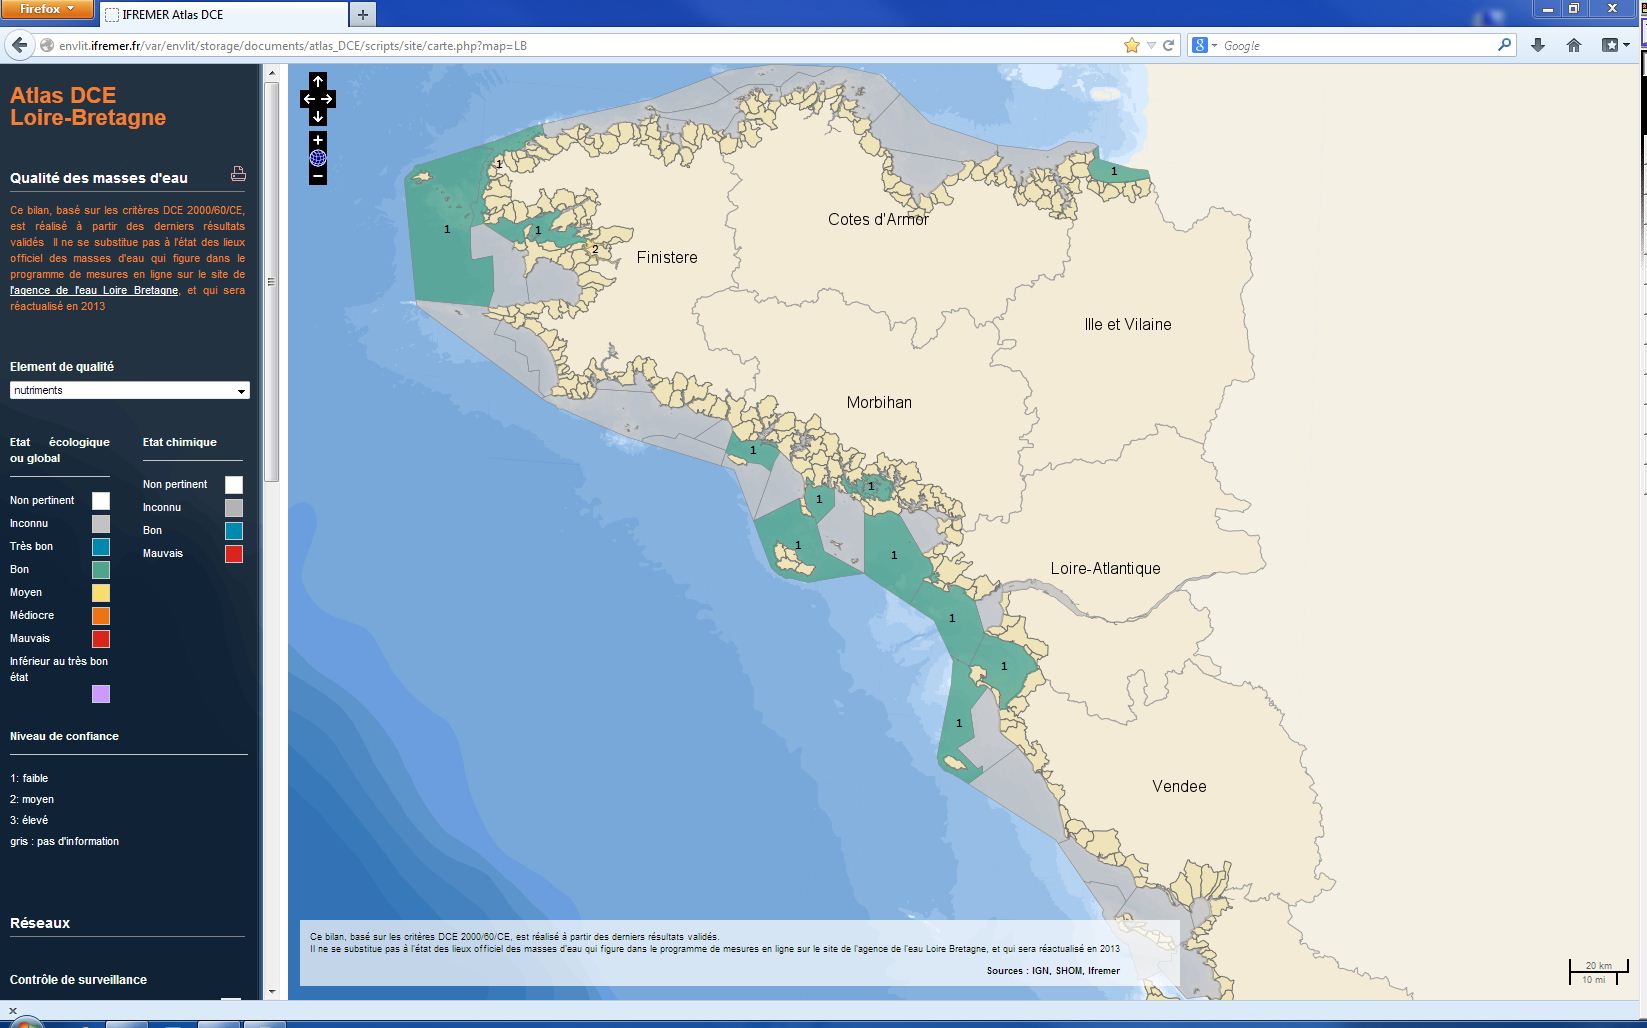
L’analyse porte sur le suivi des concentrations en nutriments des masses d'eaux côtières et de transition de la Manche ouest et du golfe de Gascogne. Le terme « nutriments » désigne l’ensemble des composés nécessaires à la nutrition du phytoplancton, dont les principaux sont le nitrate, le nitrite, l’ammonium, le phosphate et le silicate. Les nutriments ne sont pas directement toxiques pour le milieu marin, mais des flux excessifs déversés en zone côtière peuvent être considérés comme une pression à l’origine de nuisances indirectes pouvant conduire au phénomène d’eutrophisation. L’indicateur DCE nutriment est défini comme la combinaison des indices : ammonium, nitrate et nitrite. La métrique de l’indice est la concentration normalisée à 33 de salinité de l’ensemble des mesures effectuées, relativisée par rapport à un symptôme primaire d’eutrophisation : la chlorophylle-a. Les dosages de nutriments sont faits sur des échantillons prélevés mensuellement 4 à 12 fois par an. L’évaluation la plus récente de l’état de cet élément est présentée dans l’atlas DCE Loire-Bretagne. Les états antérieurs sont accessibles dans des archives annuelles.
-
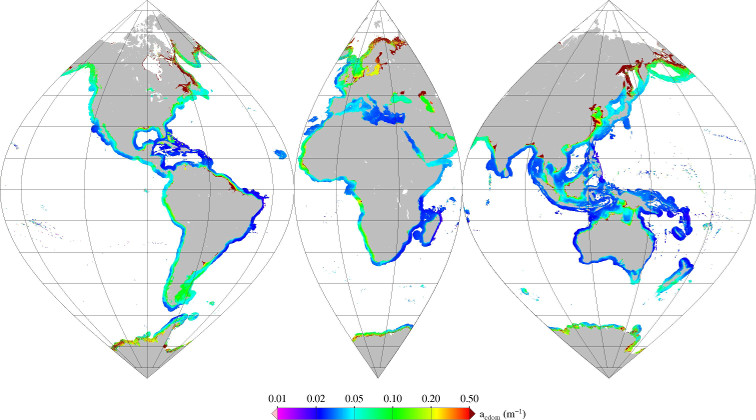
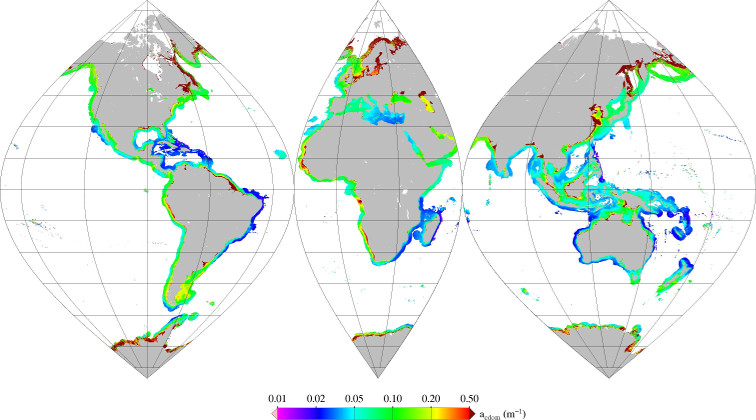
Moyenne mensuelle de l'absorption par les matières organiques colorées dissoutes (acdom) à 412nm (2002-2012)., d'après Vantrepotte (2015), pour la zone côtière à l'échelle globale, à partir du capteur MERIS et avec les corrections atmosphérique POLYMER. Ref: V Vantrepotte, F Danhiez, H Loisel, S Ouillon, X Mériaux, A Cauvin and D Dessailly. CDOM-DOC relationship in contrasted coastalwaters: implication for DOC retrieval from ocean color remote sensing observation. OPTICS EXPRESS 33 Vol. 23, No. 1 DOI:10.1364/OE.23.000033 2015
-
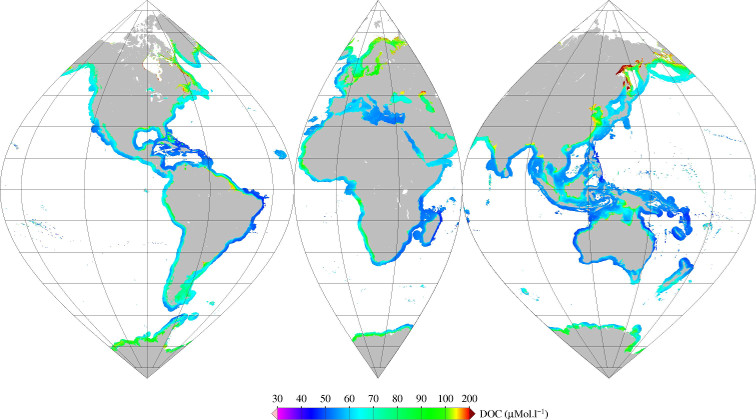
Moyenne mensuelle du Carbone Organic Dissous (COD) (2002-2012), d'après Vantrepotte (2015), pour la zone côtière à l'échelle globale, à partir du capteur MERIS et avec les corrections atmosphérique POLYMER. Ref: V Vantrepotte, F Danhiez, H Loisel, S Ouillon, X Mériaux, A Cauvin and D Dessailly. CDOM-DOC relationship in contrasted coastalwaters: implication for DOC retrieval from ocean color remote sensing observation. OPTICS EXPRESS 33 Vol. 23, No. 1 DOI:10.1364/OE.23.000033 2015
-
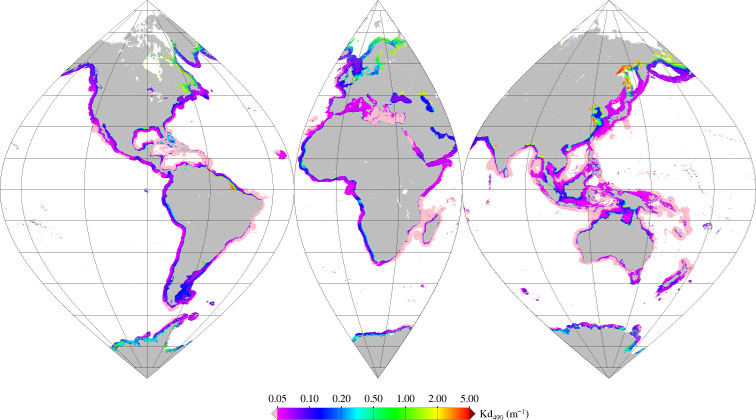
Moyenne mensuelle du coefficient d'atténuation diffus (Kd) à 490nm (2002-2012), d'après Vantrepotte (2015), pour la zone côtière à l'échelle globale, à partir du capteur MERIS et avec les corrections atmosphérique POLYMER. Ref: Jamet et al, Retrieval of the spectral diffuse attenuation coefficient Kd(l) in open and coastal ocean waters using a neural network inversion, J. Geophys. Res., 117, C10023, doi:10.1029/2012JC008076.
-

L’analyse porte sur le suivi des concentrations en oxygène dissous des masses d'eaux côtières et de transition de la Manche ouest et du golfe de Gascogne. Le bilan d’oxygène figure parmi les éléments retenus pour la classification de l'état écologique. La qualité est évaluée à partir du percentile 10 du bilan d’oxygène comparée à une valeur de référence. Les prélèvements d’eau pour la mesure de l’oxygène dissous sont réalisés avec une fréquence mensuelle en période estivale (de juin à septembre), au fond et en sub-surface de la colonne d’eau. L’évaluation la plus récente de l’état de cet élément est présentée dans l’atlas DCE Loire-Bretagne. Les états antérieurs sont accessibles dans des archives annuelles.
-
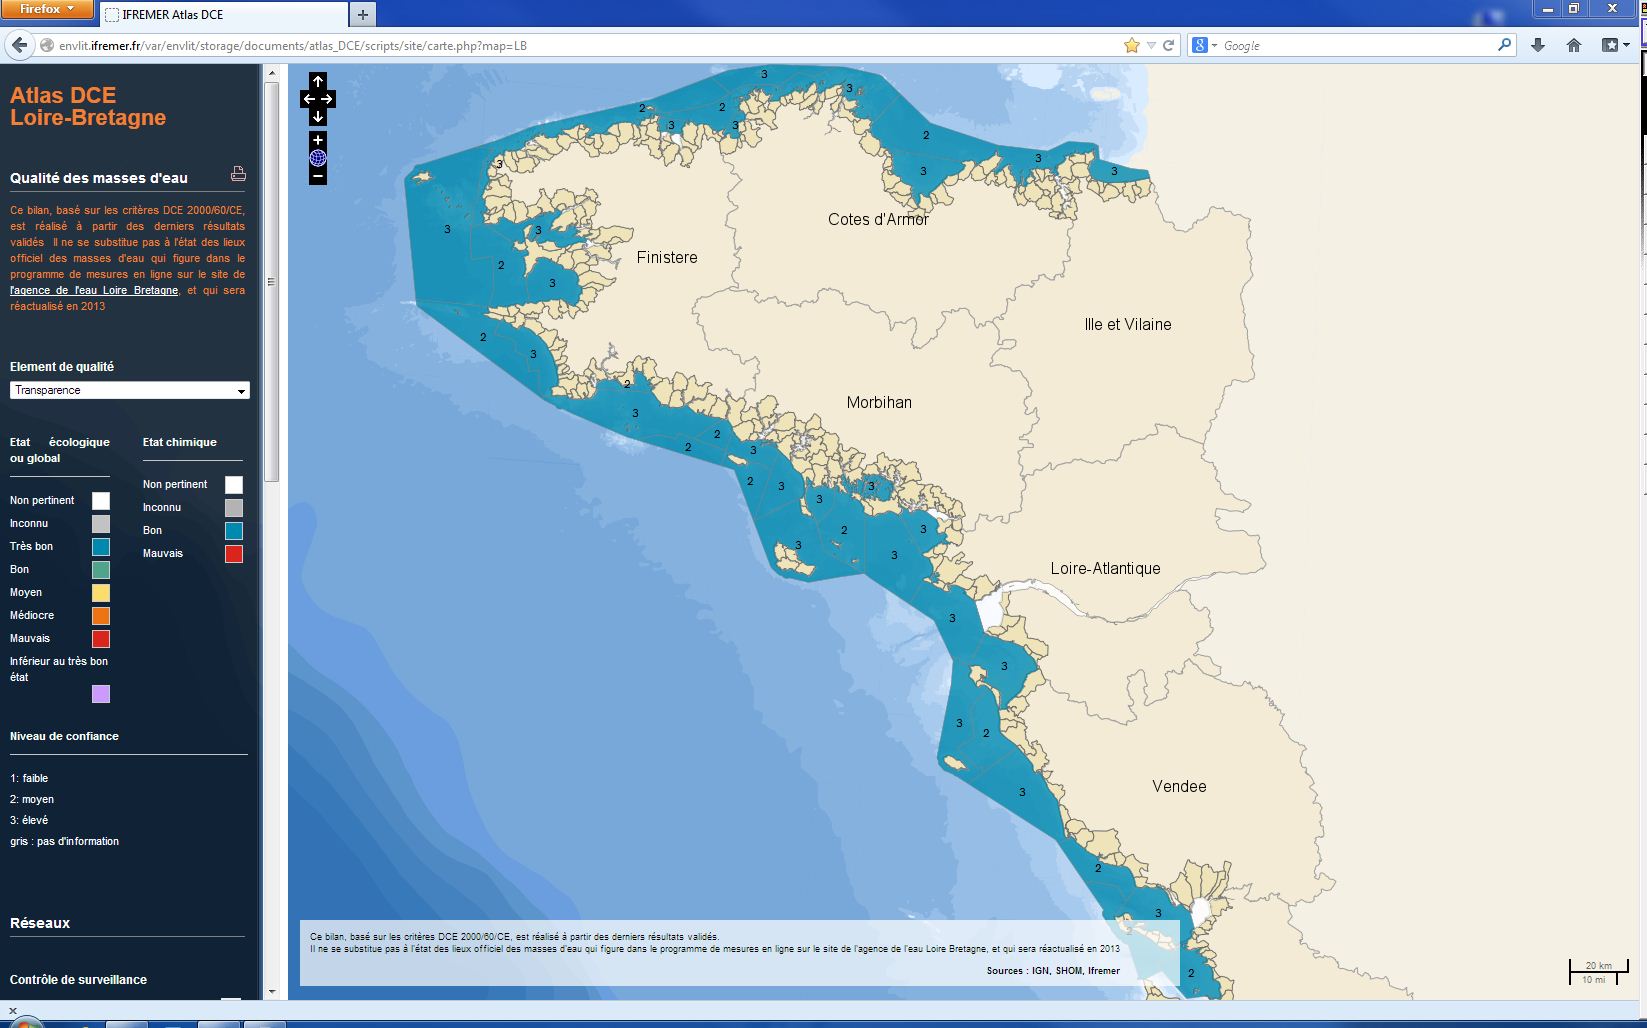
L’analyse porte sur les valeurs du paramètre turbidité (NTU) mesuré dans les eaux côtières et de transition de la Manche ouest et du golfe de Gascogne. Seule est considérée la période de plus forte production primaire (mars à octobre), à l'exclusion des épisodes turbides hivernaux provoqués par les conditions météorologiques (période de faible production primaire). L’indicateur de transparence est le percentile 90, qui correspond à la valeur telle que 90% des valeurs observées lui sont inférieures. Il est comparé à la valeur de référence pour le type de la masse d'eau. La transparence est un paramètre pour lequel les résultats n’ont pas entraîné jusqu'à présent de modification du classement DCE au cours des dernières années. C’est pourquoi, la mise à jour n'est faite pour chaque masse d'eau qu’une fois par plan de gestion de 6 ans, sauf si des observations nouvelles et marquantes venaient modifier l’évaluation.