 Catalogue PIGMA
/Observational data/in-situ
Type of resources
Available actions
Topics
Keywords
Contact for the resource
Provided by
Years
Formats
Representation types
Update frequencies
status
Scale
-
The network was initiated by IFREMER from 1993 to 2009 (under the acronym REMORA) to study the rearing performance of the Pacific oyster Crassostrea gigas at a national scale. To do so, the network monitored annually the mortality and growth of standardized batches of 18-month-old oysters. Starting in 1995, the monitoring of the rearing performance of 6-month-old oyster spat was integrated into this network. These sentinel batches were distributed simultaneously each year on 43 sites and were monitored quarterly. These sites were distributed over the main French oyster farming areas and allowed a national coverage of the multiannual evolution of oyster farming performances. Most of the sites were located on the foreshore at comparable levels of immersion. Field studies were carried out by the "Laboratoires Environnement Ressources" (LER) for the sites included in their geographical area of investigation. Following the increase in spat mortality in 2008, the network evolved in 2009 (under the acronym RESCO). From this date, the network selected 13 sites among the 43 sites previously monitored in order to increase the frequency of visits (twice a month) and the number of sentinel batches. More precisely, sentinel batches of oysters corresponding to different origins (wild or hatchery, diploid or triploid) and to two rearing age classes (spat or 18-month-old adults) were selected. The monitoring of environmental variables (temperature, salinity) associated with the 13 sites was also implemented. The actions of the network have thus contributed to disentangle the biotic and abiotic parameters involved in mortality phenomena, taking into account the different compartments (environment / host / infectious agents) likely to interact with the evolution of oyster rearing performance. Finally, since 2015, the network has merged the RESCO and VELYGER networks to adopt the acronym ECOSCOPA. The general objective of this current network is to analyze the causes of spatio-temporal variability of the main life traits (Larval stage - Recruitment - Reproduction - Growth - Survival - Cytogenetic abnormalities) of the cupped oyster in France and to follow their evolution on the long term in the context of climate change. To do this, the network proposes a regular spatio-temporal monitoring of the major proxies of the life cycle of the oyster, organized in three major thematic groups: (1) proxies related to growth, physiological tolerance and survival of experimental sentinel populations over 3 age classes: (2) proxies related to reproduction, larval phase and recruitment of the species throughout its natural range in France, and: (3) proxies related to environmental parameters essential to the species (weather conditions, temperature, salinity, pH, turbidity, chlorophyll a and phytoplankton) at daily or sub-hourly frequencies. Working in a geographical network associating several laboratories, ECOSCOPA provide these monitoring within 8 sites selected among the previous ones to ensure the continuity of the data acquisition. Today, these 8 sites are considered as ecosystems of common interest, contrasted, namely : - The Thau lagoon - The Arcachon basin - The Marennes Oléron basin - The Bourgneuf Bay - The bay of Vilaine - The bay of Brest - The bay of Mont Saint Michel - The bay of Veys The ECOSCOPA network is therefore one of the relevant monitoring tools on a national scale, allowing to objectively measure through different proxies the general state of health of cultivated and wild oyster populations, and this for the different sensitive phases of their life cycle. This network aims at allowing a better evaluation, on the long term, of the biological risks incurred by the sector but also by the ecosystems, in particular under the increasing constraint of climatic and anthropic changes. Figure : Sites monitored by the ECOSCOPA network
-
The European Union’s Copernicus-funded TRUSTED project (Towards Fiducial Reference Measurements of Sea-Surface Temperature by European Drifters) has deployed over 100 state of the art drifting buoys for improved validation of Sea Surface Temperature (SST) from the Sentinel-3 Sea and Land Surface Temperature Radiometers (SLSTR). These buoys are manufactured by NKE. The TRUSTED drifting buoys data and metadata are distributed in qualtity control NetCDF files, as a subset of DBCP drifting buoys GDAC (Global Data Assembly Centre). Coriolis DAC (Data Assembly Centre) routinely collects, decodes, quality controls, preserves and distributes data and metadata as NetCDF-CF files. The TRUSTED buoys have specific features managed by Coriolis DAC python data processing chain: a high resolution temperature sensor in addition to the classic drifting buoy temperature sensor. The high sampling and high resolution observations are distributed in specific variables TEMP_HR, TEMP_HR_SPOT, TEMP_HR_XX (XX is the percentile sample).
-
The Mytilobs network, carried out by IFREMER (French Research Institute for Exploitation of the Sea), is a national network dedicated to building long-term physiological variations time series of blue mussels (Mytilus edulis), across a large spatial scale. This observation network, initially designed to survey production yields, also provides valuable data to track environmental variations of coastal ecosystems. Mussels exhibit high phenotypic plasticity in response to environmental variations. Collection of data describing phenotypic variations, over an extended period, reveals small-scale climate and habitat variations. With its broad deployment across time and space, the data produced under Mytilobs will be useful for the establishment of a baseline condition when studying the effect of a perturbation affecting an ecosystem’s functioning. Finally, the monitoring of mussel biometric traits and mortality was coupled with high-frequency measurements of salinity, temperature, and sea level, complementing this multi-layer observational framework.
-
Survival was recorded at the endpoint for all batches of each group (2n-control, 2n-wild, 2n-commercial, 2nR, 3nR and 3n-commercial). Similarly, initial and final yield were recorded, corresponding to the total weight of the live oysters at deployment and at the endpoint. Finally, shell length and total weight for individually recorded at reception and at the endpoint.
-
Worldwide, shellfish aquaculture and fisheries in coastal ecosystems represent crucial activities for human feeding. But these biological productions are under the pressure of climate variability and global change. Anticipating the biological processes affected by climate hazards remains a vital objective for species conservation strategies and human activities that rely on. Within marine species, filter feeders like oysters are real key species in coastal ecosystems due to their economic and societal value (fishing and aquaculture) but also due to their ecological importance. Indeed oysters populations in good health play the role of ecosystem engineers that can give many ecosystem services at several scales: building reef habitats that contribute to biodiversity, benthic-pelagic coupling and phytoplankton bloom control through water filtration, living shorelines against coastal erosion… The Pacific oyster, Crassostrea gigas (Thunberg, 1793), which is currently widespread worldwide, was introduced into the Atlantic European coasts at the end of the 19th century for shellfish culture purposes and becomes the main marine species farmed in France (around 100 000 tons) despite severe mortalities crisis. But in the same time and because of warming, natural oysters beds has spread significantly along the French coast and are supposed to have reach approximately 500 000 tons. In that context, Pacific oyster populations (natural and cultivated) in France are the subjects of many scientific projects. Among them, a specific long-term biological monitoring focuses on the reproduction of these populations at a national scale: the VELYGER national program. With more than 8 years of weekly data at many stations in France, this field-monitoring program offers a valuable dataset for studying processes underpinning reproduction cycle of this key-species in relation to environmental parameters, water quality and climate change. Database content: Larval concentration (number of individuals per 1.5 m3) monitored, since 2008, at several stations in six bays of the French coast (from south to north): Thau Lagoon and bays of Arcachon, Marennes Oléron, Bourgneuf, Vilaine and Brest (see map below). Methods used to monitor larval concentration: An important volume of seawater (1.5 m3) is pumped twice a week throughout the spawning season (june-september), at one meter below the surface at high tide (+/- 2h) in several sites within each VELYGER ecosystem. Water is filtered trough plankton net fitted with 40 µm mesh. After a proper rinsing of the net, the retained material is transferred into a polyethylene bottle (1 liter) and fixed with alcohol. At laboratory, sample is then gently filtered and rinse again and transferred into eprouvette. Two sub-samples of 1 mL are then taken using a pipette and examined on a graticule slide for microscope. The microscopic examination is made with a conventional binocular optical microscope with micrometer stage at a magnification of 10 X (or above). During the counting, a special care is necessary as larvae of other bivalves are also collected and confusion is possible. Larvae of C. gigas are also classified into four stage of development: - Stage I = D-shaped straight hinge larvae (shell length <105 µm) - Stage II = Early umbo evolved larvae (shell length between 105 and 150 µm) - Stage III = Medium umbo larvae (shell length between 150 and 235 µm) - Stage IV*= Large umbo eyed pediveliger larvae (shell length > 235 µm) * Larvae that are very closed to settle are sometimes identified into a separated 5th stage, but generally this stage is included in stage IV. Illustrations: Location of the different Velyger sites along the French coast. From south to north: Thau Lagoon and bays of Arcachon, Marennes Oléron, Bourgneuf, Vilaine and Brest. Legend: Pacific Oyster Larvae (left side) and Natural oyster bed (right side). Photos : © S. Pouvreau/Ifremer
-
Ocean tide and loading altimetric corrections computed - with SIROCCO Tools : https://sirocco.obs-mip.fr/other-tools/prepost-processing/comodo-tools - from FES2014 atlases : https://doi.org/10.6096/3001 - for all altimetric missions. Validation available at ftp://ftp.legos.obs-mip.fr/pub/ecola/FES2014/CTOH/2021-02-diff-libfes-tools.pdf
-
Climatology of near-inertial currents. Global climatology of near-inertial current characteristics from satellite-tracked drifters. Data analysed : 8500 near-surface satellite-tracked drifter trajectories with drogues attached at 15 m depth.
-
The mean and time-varying position of the main Southern Ocean polar fronts has been calculated from a combination of gridded altimetric sea level anomalies and a new climatology of mean sea level constructed from historical data and ARGO T / S profiles.
-
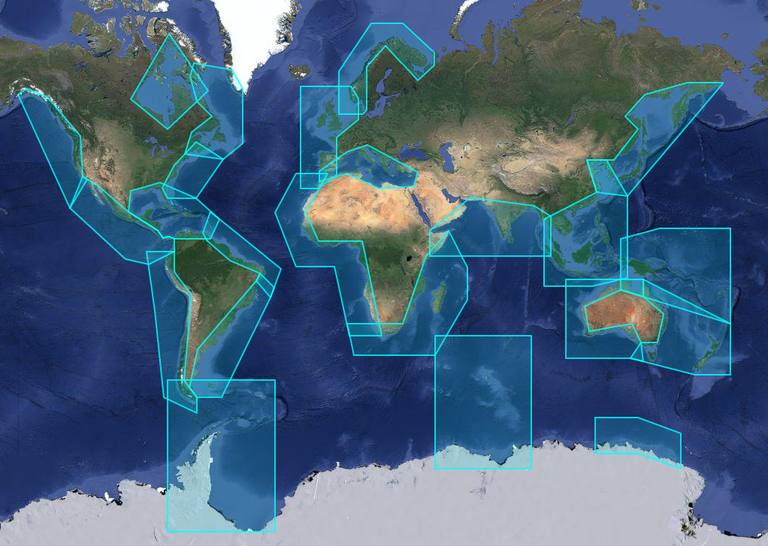
X-TRACK, is a regional altimeter products for coastal applications. It has been developed in order to optimize the completeness and the accuracy of the sea surface height information derived from satellite altimetry in coastal ocean areas. 1hz alongtrack SLA are available in 23 regions for different altimetric missions (Topex, Jason-1&2, Geosat, Ers2, Envisat). SLA is computed on a reference track. X-TRACK SLA files hold alongtrack SLA data together with MSSH, FES2012 tide, Dynamic Atmospheric Corrections and distance to coast parameters. Users can both retrieve filtered and non-filtered data. X-TRACK areas : | short name | long name | |:------------|:---------------------------------| | adelie | Adelie-Mertz | | amazon | Amazon | | asa | Atlantic South America | | chinasea | China Sea | | drake | Drake passage | | eaustralia | East Australia | | gom | Gulf of Mexico - Caribbean Sea | | gulfstream | Gulf Stream | | hudson | Hudson Bay | | humboldt | Humboldt current | | kerguelen | Kerguelen Islands | | labrador | Labrador Sea | | medsea | Mediterranean Sea | | nea | North East Atlantic | | nindian | North Indian Ocean | | norway | Norway | | nwa | North West America | | nwp | North West Pacific | | sea | South and East Africa | | wafrica | West Africa | | waustralia | West Australia | | wla | West Latin America - California | | wtp | West Tropical Pacific |
-
X-TRACK, is a regional altimeter products for coastal applications. Along-track tidal constants (amplitude, phase lags and associated estimation errors for 73 constituents) derived from the X-TRACK T/P and Jason 1&2 is available every 6-7 km along the satellite ground tracks. X-TRACK areas : | short name | long name | |:------------|:---------------------------------| | adelie | Adelie-Mertz | | amazon | Amazon | | asa | Atlantic South America | | chinasea | China Sea | | drake | Drake passage | | eaustralia | East Australia | | gom | Gulf of Mexico - Caribbean Sea | | gulfstream | Gulf Stream | | hudson | Hudson Bay | | humboldt | Humboldt current | | kerguelen | Kerguelen Islands | | labrador | Labrador Sea | | medsea | Mediterranean Sea | | nea | North East Atlantic | | nindian | North Indian Ocean | | norway | Norway | | nwa | North West America | | nwp | North West Pacific | | sea | South and East Africa | | wafrica | West Africa | | waustralia | West Australia | | wla | West Latin America - California | | wtp | West Tropical Pacific |