 Catalogue PIGMA
Water
Type of resources
Available actions
Topics
Keywords
Contact for the resource
Provided by
Years
Formats
Representation types
Update frequencies
status
Scale
Resolution
-
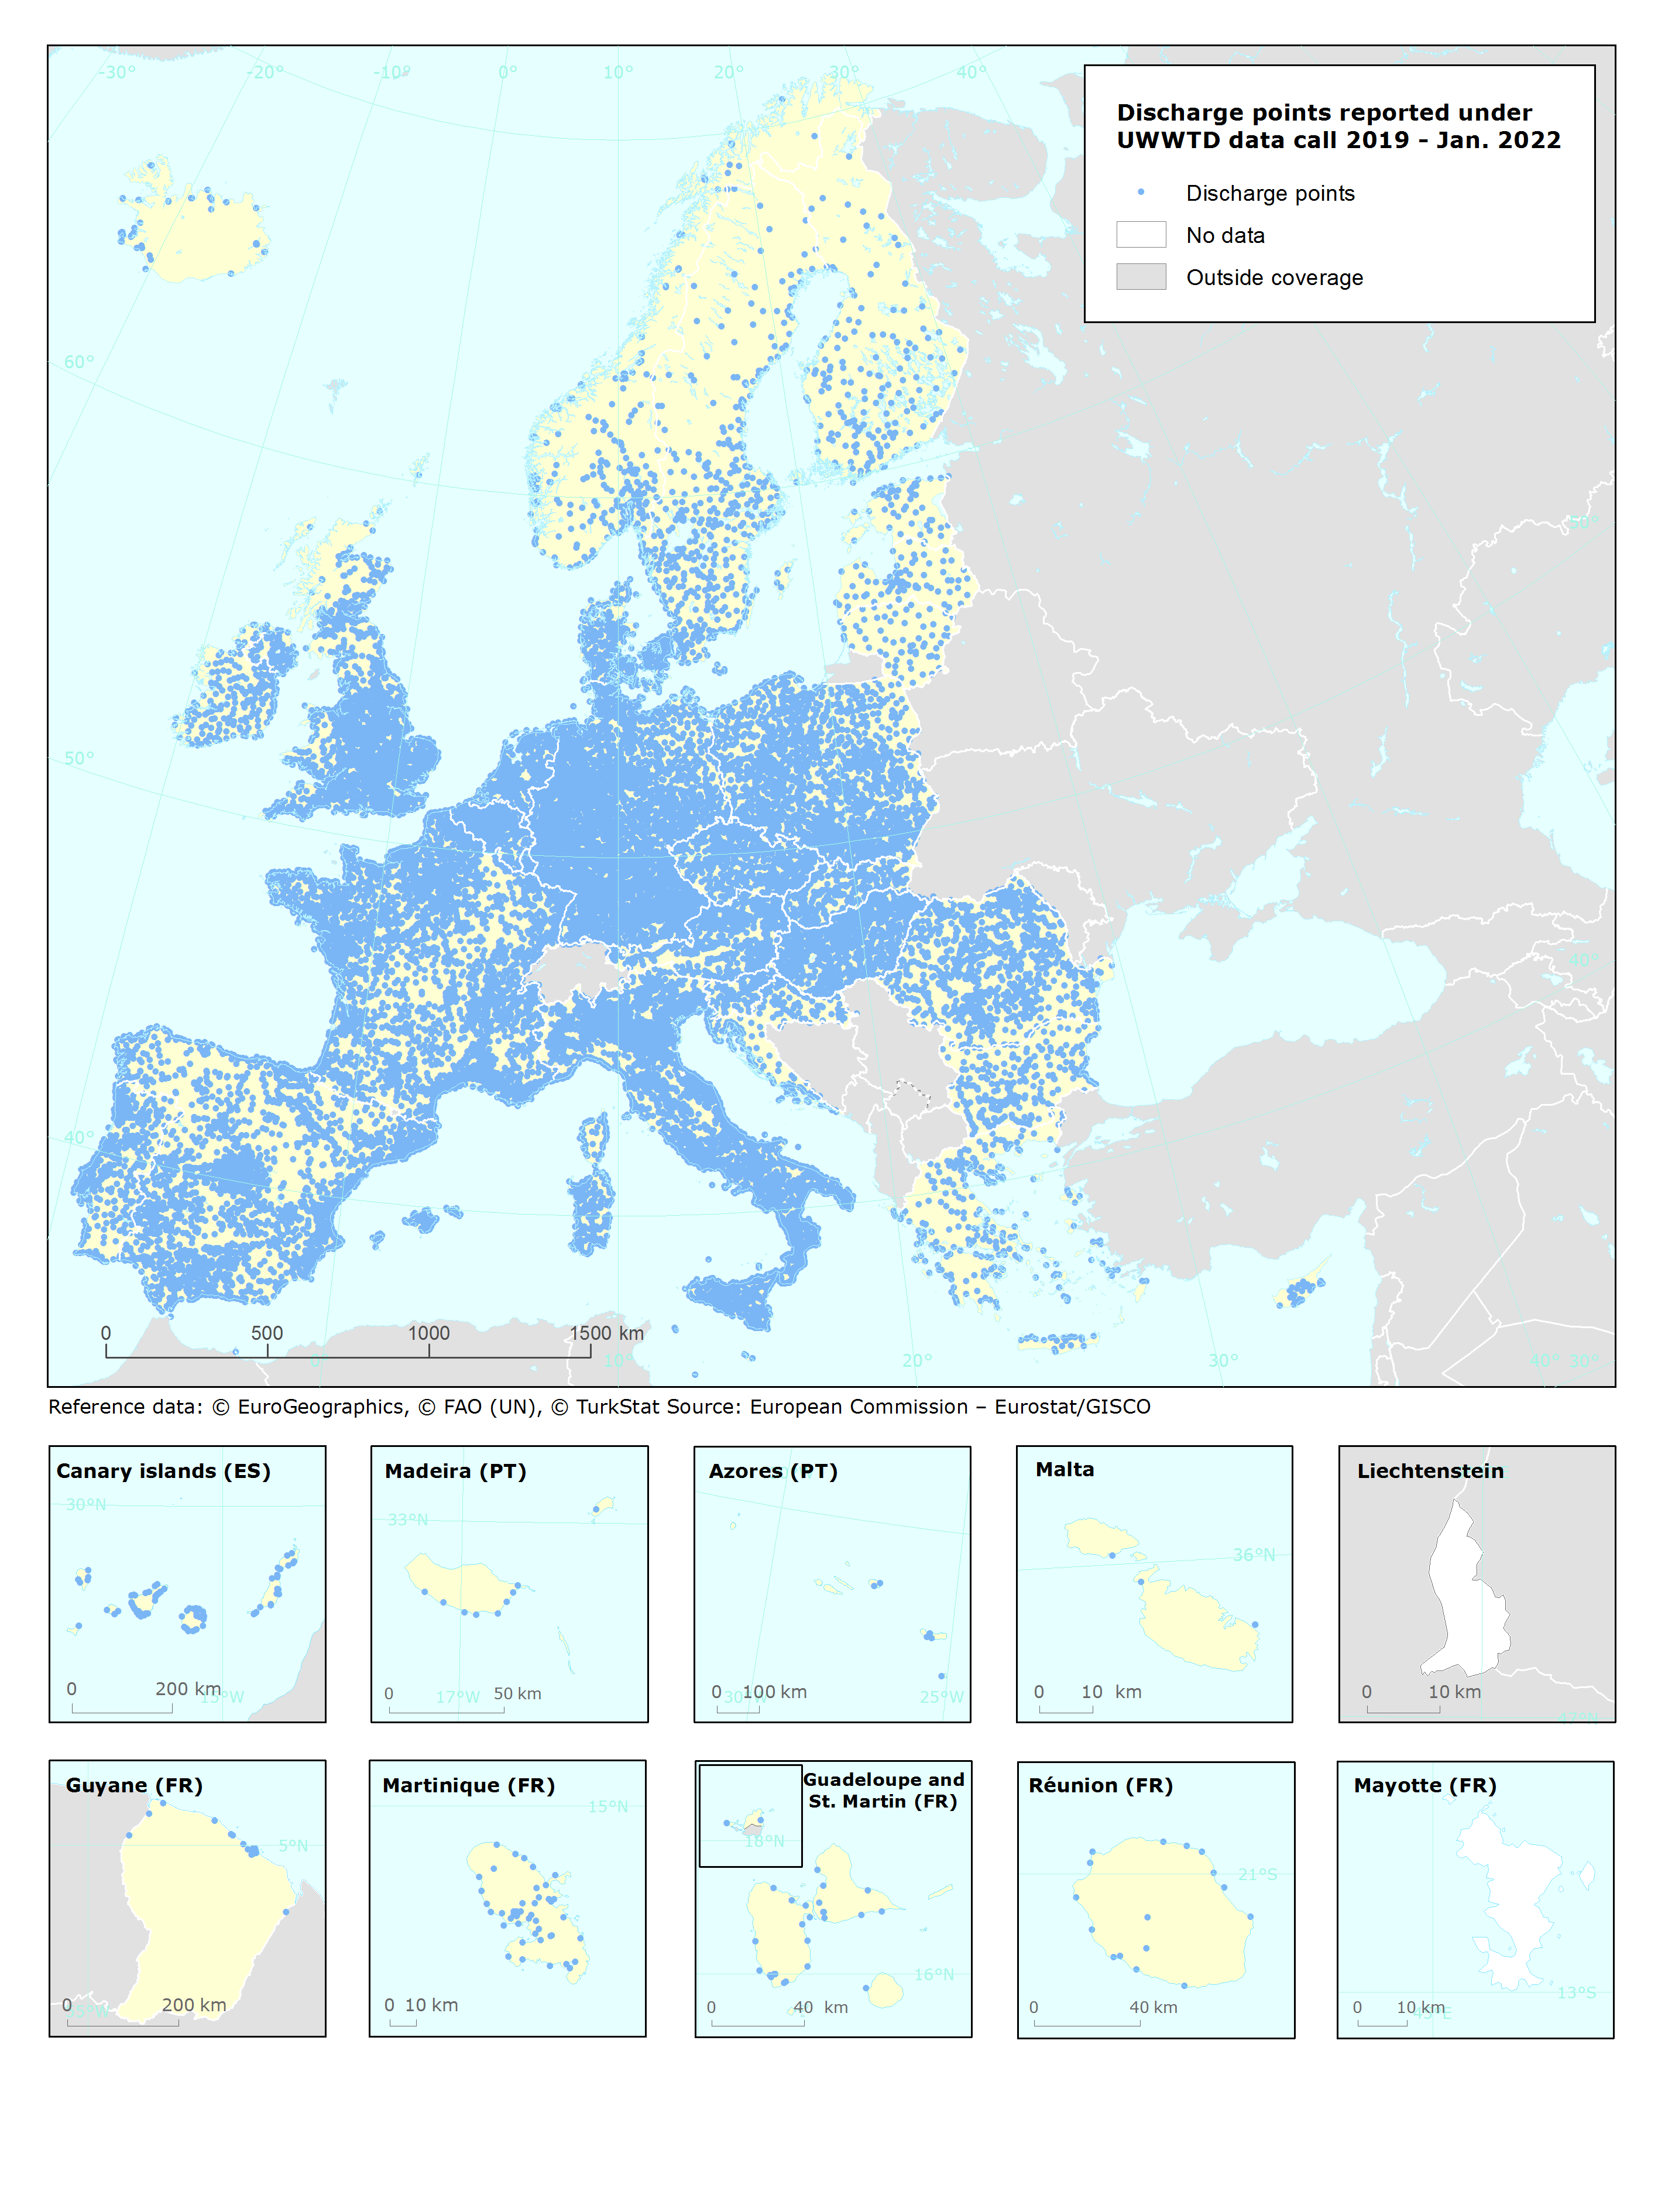
UWWTD Discharge Points, Jan. 2022 is one of the datasets produced within the frame of the reporting under 11th UWWTD Art.15 reporting period (UWWTD data call 2019). The Urban Waste Water Treatment Directive (UWWTD) (91/271/EEC) obliges Member States to report data on the implementation of the Directive upon request from the European Commission bi-annually. Reported data include receiving areas as designated under UWWTD, agglomerations, urban waste water treatment plants serving the agglomerations and points of discharges. Dataset UWWTD_DischargePoints contains information on individual points of discharge from urban waste water treatment plants or collecting systems, including their coordinates of discharge, link to specific treatment plant, type of receiving area into which the effluent / wastewater is discharged, related waterbody (or river basin), information on the discharge on land and potential reuse of the treated waste water. This dataset includes the reported discharge points which are displayed on the UWWTD maps (https://www.eea.europa.eu/themes/water/european-waters/water-use-and-environmental-pressures/uwwtd/interactive-maps/urban-waste-water-treatment-maps-3). The active discharge points with correct coordinates in the reported data were selected from the source European UWWTD tabular dataset, which is available on the download link https://www.eea.europa.eu/data-and-maps/data/waterbase-uwwtd-urban-waste-water-treatment-directive-7. The definition of the UWWTD Discharge Points dataset attributes (fields) is available on the link https://dd.eionet.europa.eu/datasets/latest/UWWTDArt15/tables/DischargePoints The full (internal) dataset including inactive discharge points is available under "Urban Waste Water Treatment Directive, Discharge points reported under UWWTD data call 2019 - INTERNAL VERSION, Jan. 2022". In comparison to the previous version (Nov. 2020), late redeliveries and corrections provided by several countries during 2021 are included in current revision. Next, the dataset is provided in GeoPackage and ESRI File geodatabase formats instead of shapefile used up to now, to avoid truncation of attribute names.
-
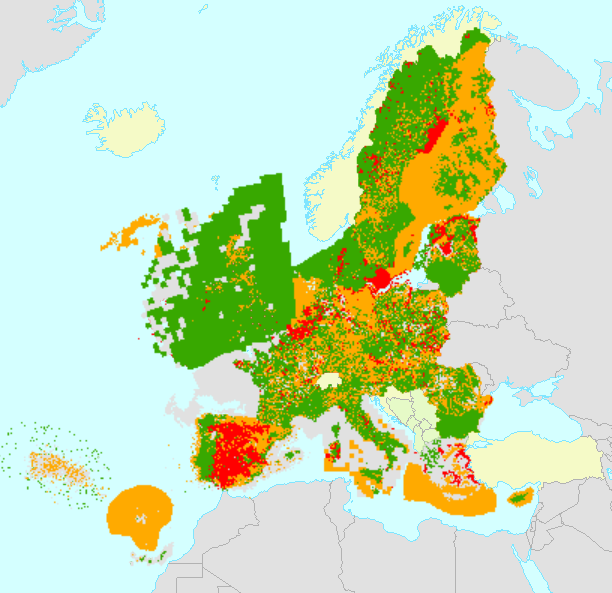
All Member States are requested by the Habitats Directive (92/43/EEC) to monitor habitat types and species listed in its annexes and send a report every 6 years following an agreed format. The assessment of conservation status is based on information about the status and trends of species populations and of habitats at the level of the biogeographical or marine region. The spatial dataset contains habitat and species distribution data (10km grid cells) as reported by EU 27 (2007-2013) Member States for the 2007-2012 period. This metadata refers to the public dataset, without sensitive species. The data sets are divided in two sets for species and two sets for habitat types. Habitats: Art17_habitats_distribution_2007_2012_EU (distribution by European Union aggregate) Art17_habitats_distribution_2007_2012_MS (distribution by Member State) Species: Art17_species_distribution_2007_2012_EU (distribution by European Union aggregate) Art17_species_distribution_2007_2012_MS (distribution by Member State) Furthermore, a series of tables are also provided with the assessments of conservation status of species and habitats at Member State biogeographical level (done by Member States) and at EU biogeographical level (done by the ETC/BD and the EEA). Both MS datasets are aggregated by habitat/species code, country and biogeographical /marine region [COMSRE]. Using this attribute [COMSRE] the tabular conservation status, which is available in the table, per biogeographical/marine region of the Member State level (MS) can be joined directly to the spatial dataset. Both EU datasets are aggregated by habitat/species code and biogeographical /marine region [CORE]. Using this attribute [CORE] the tabular conservation status, which is available in the table, of the biogeographical/marine region of the EU-27 (2007-2013) level (EU) can be directly joined to the spatial dataset. NOTE: The original datasets have been reviewed and re-published in February 2021, including delayed deliveries from Greece.
-
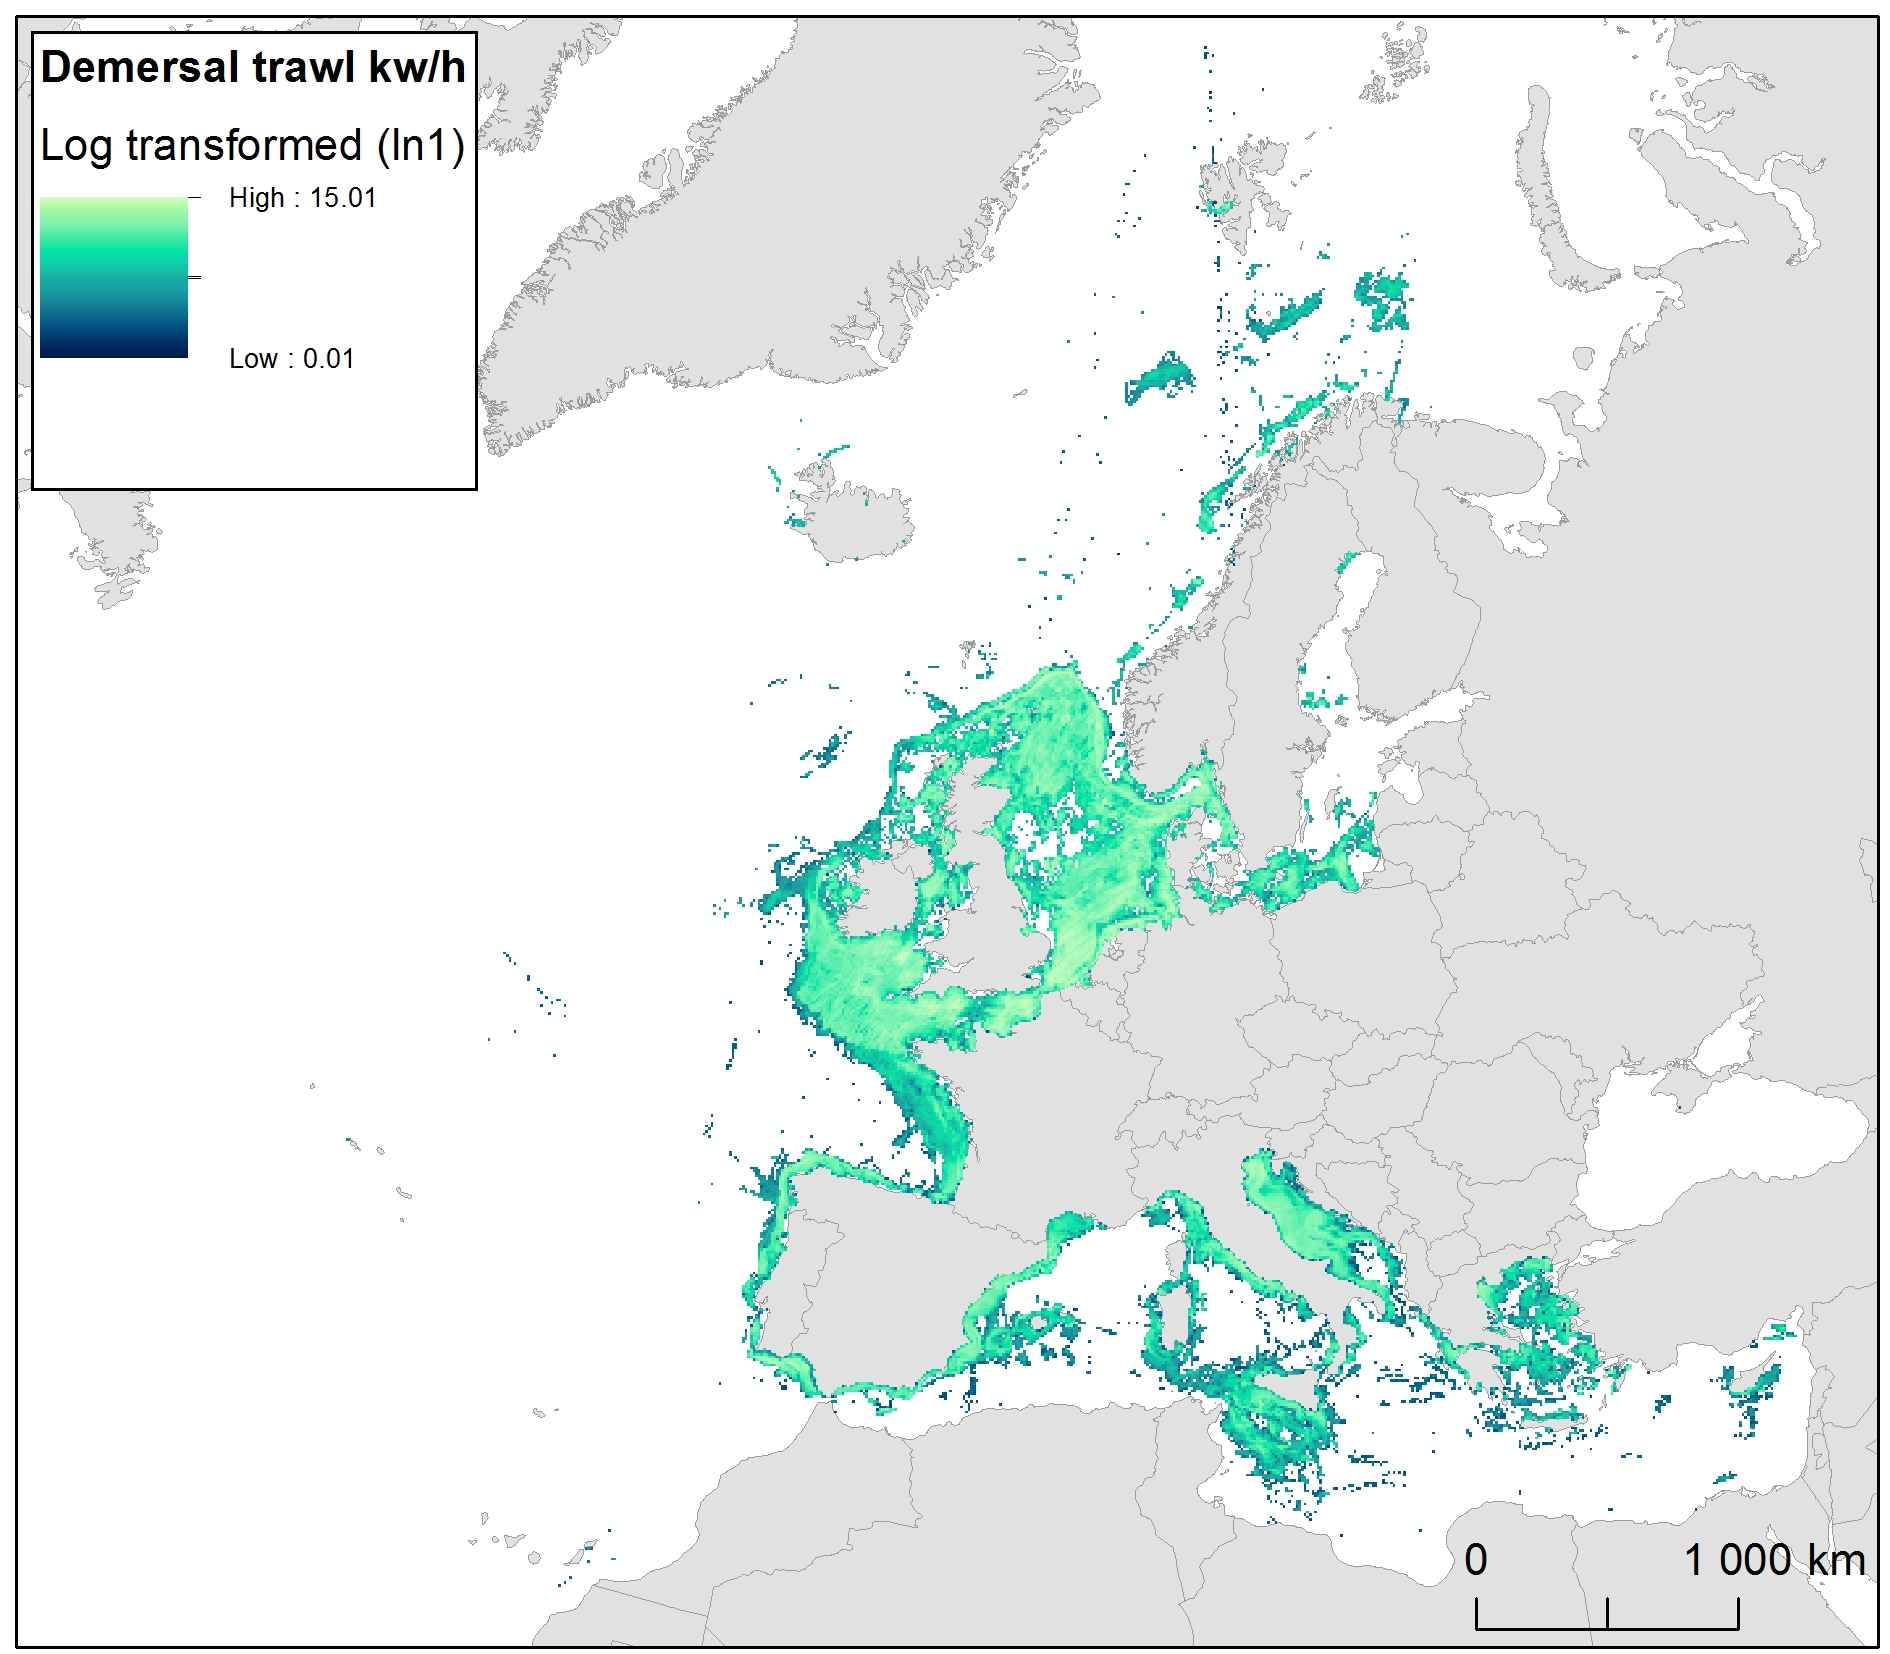
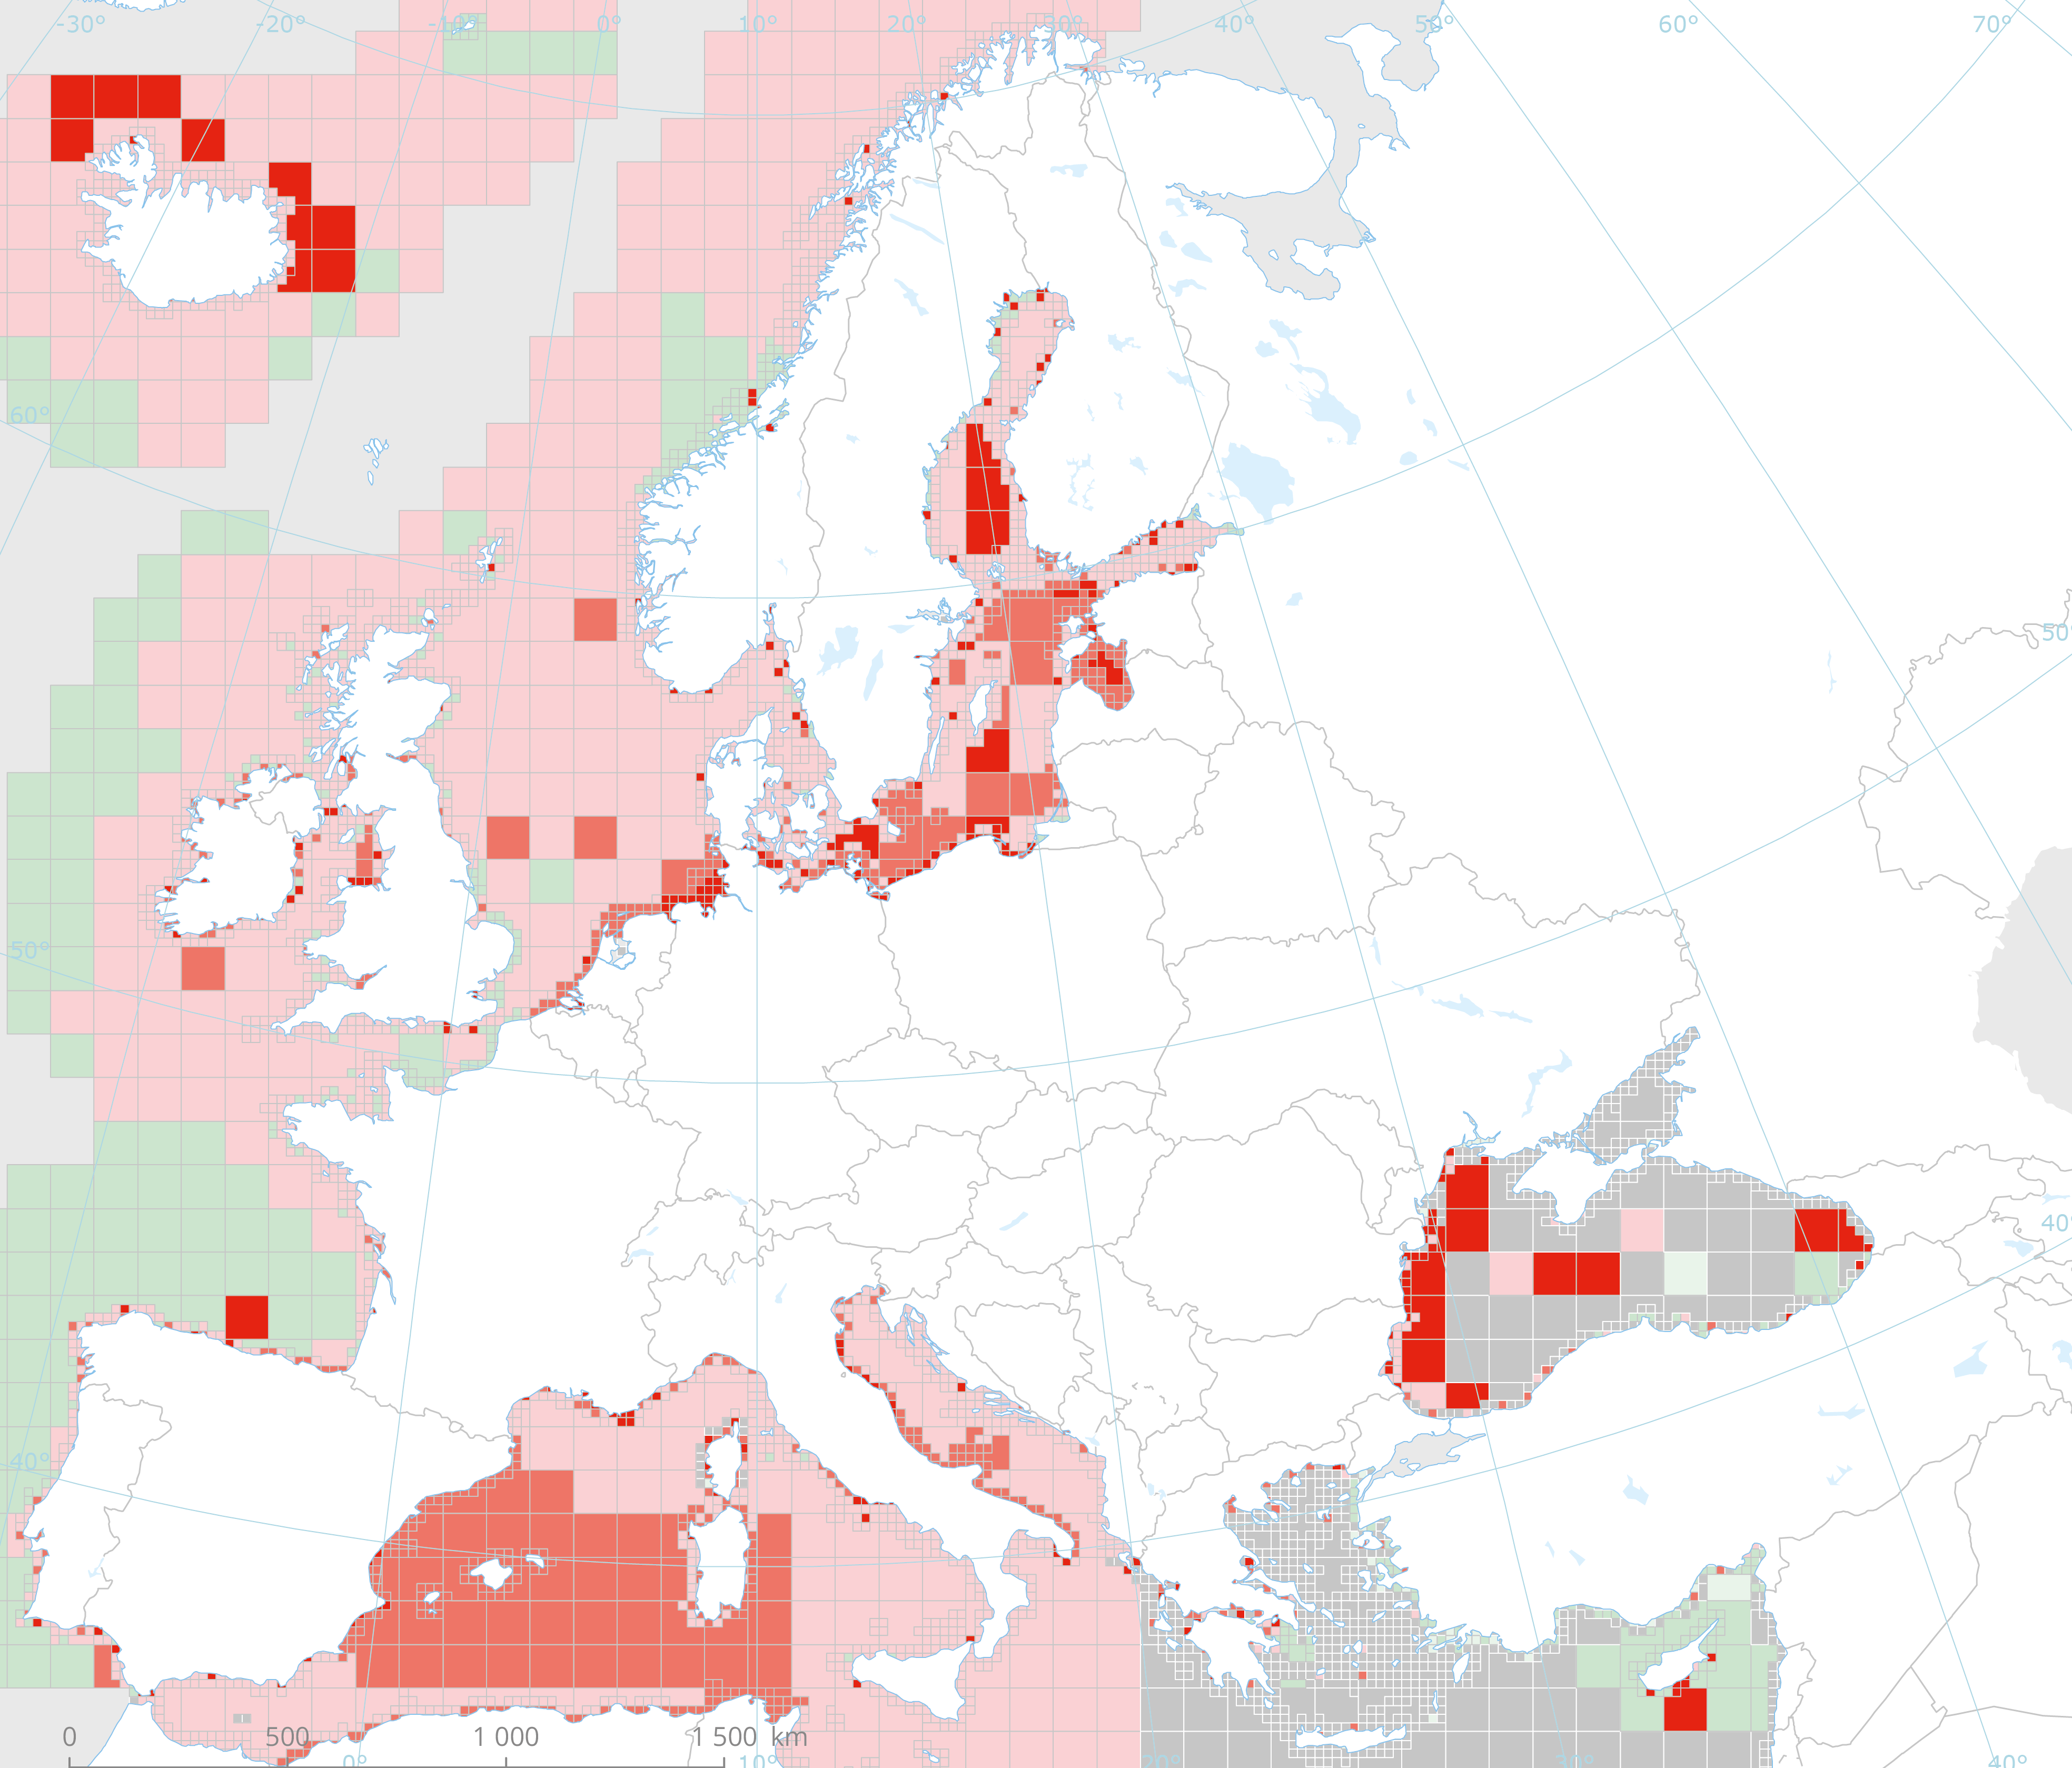
The raster dataset represents bycatch fishing intensity (kilowatt per fishing hour) from bottom touching mobile gears in the European seas. The dataset has been derived from Automatic Identification System (AIS) based demersal fishing intensity data received from the European Commission’s Joint Research Centre - Independent experts of the Scientific, Technical and Economic Committee for Fisheries (JRC STECF) as well as Vessel Monitoring System (VMS) and logbook based demersal fishing intensity data downloaded from from OSPAR and HELCOM Commissions. The temporal extent varies between the data sources (between 2014 and 2017). OSPAR and HELCOM data superseded the JRC STECF data where they overlapped spatially. The cell values have been transformed into a logarithmic scale (ln1). This dataset has been prepared for the calculation of the combined effect index, produced for the ETC/ICM Report 4/2019 "Multiple pressures and their combined effects in Europe's seas" available on: https://www.eionet.europa.eu/etcs/etc-icm/etc-icm-report-4-2019-multiple-pressures-and-their-combined-effects-in-europes-seas-1.
-
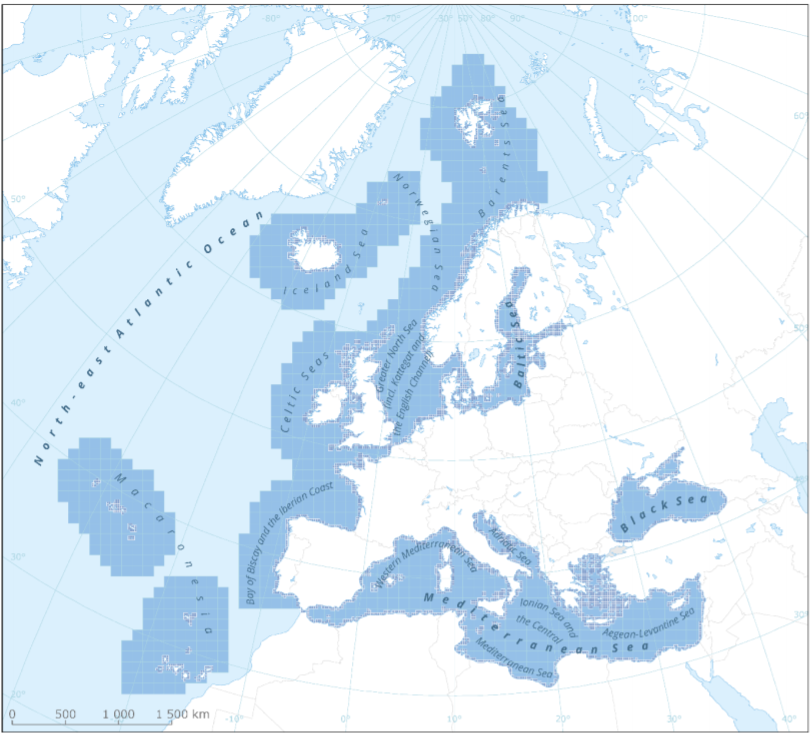
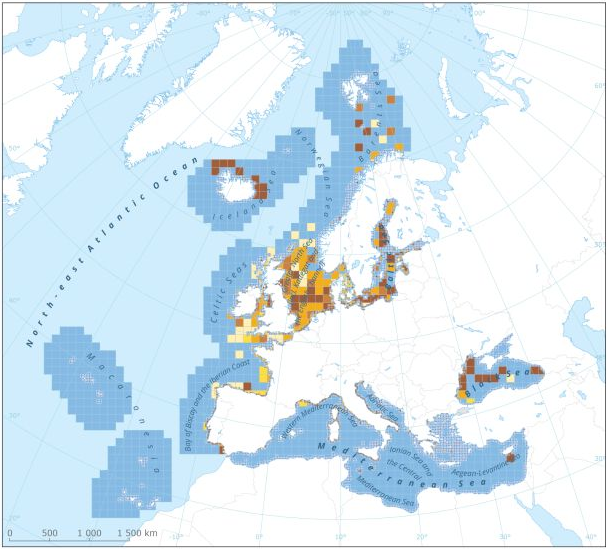
This metadata refers to the EEA marine assessment grid, to which all data and assessment results have been spatially mapped in order to ensure that data can be compared in a uniform way across the European regional seas. The marine assessment grid is based on the EEA reference grid system. The EEA reference grid is based on ERTS89 Lambert Azimuthal Equal Area projection with parameters: latitude of origin 52° N, longitude of origin 10° E, false northing 3 210 000.0 m, false easting 4 321 000.0 m. All grid cells are named with a unique identifier containing information on grid cell size and the distance from origin in meters (easting and northing). An important attribute of the EEA reference grid system is that by using an equal area projection all grid cells are having the same area for the same grid size. In this marine assessment grid, two grid sizes are used: * 100 x 100 km in offshore areas (> 20 km from the coastline) * 20 x 20 km in coastal areas (<= 20 km from the coastline) The grid sizes were choosen after an evaluation of data availability versus the need for sufficient detail in the resulting assessment. The resulting assessment grid is a combination of two grid sizes using the EEA reference grid system. The overall area of interest used in the grid is based on the marine regions and subregions under the Marine Strategy Framework Directive (MSFD). Additionally, Norwegian (Barent Sea and Norwegian Sea) and Icelandic waters (’Iceland Sea’) have been added (see Surrounding seas of Europe). Note that, within the North East Atlantic region, only the subregions within EEZ boundaries (~200 nm) have been included.
-
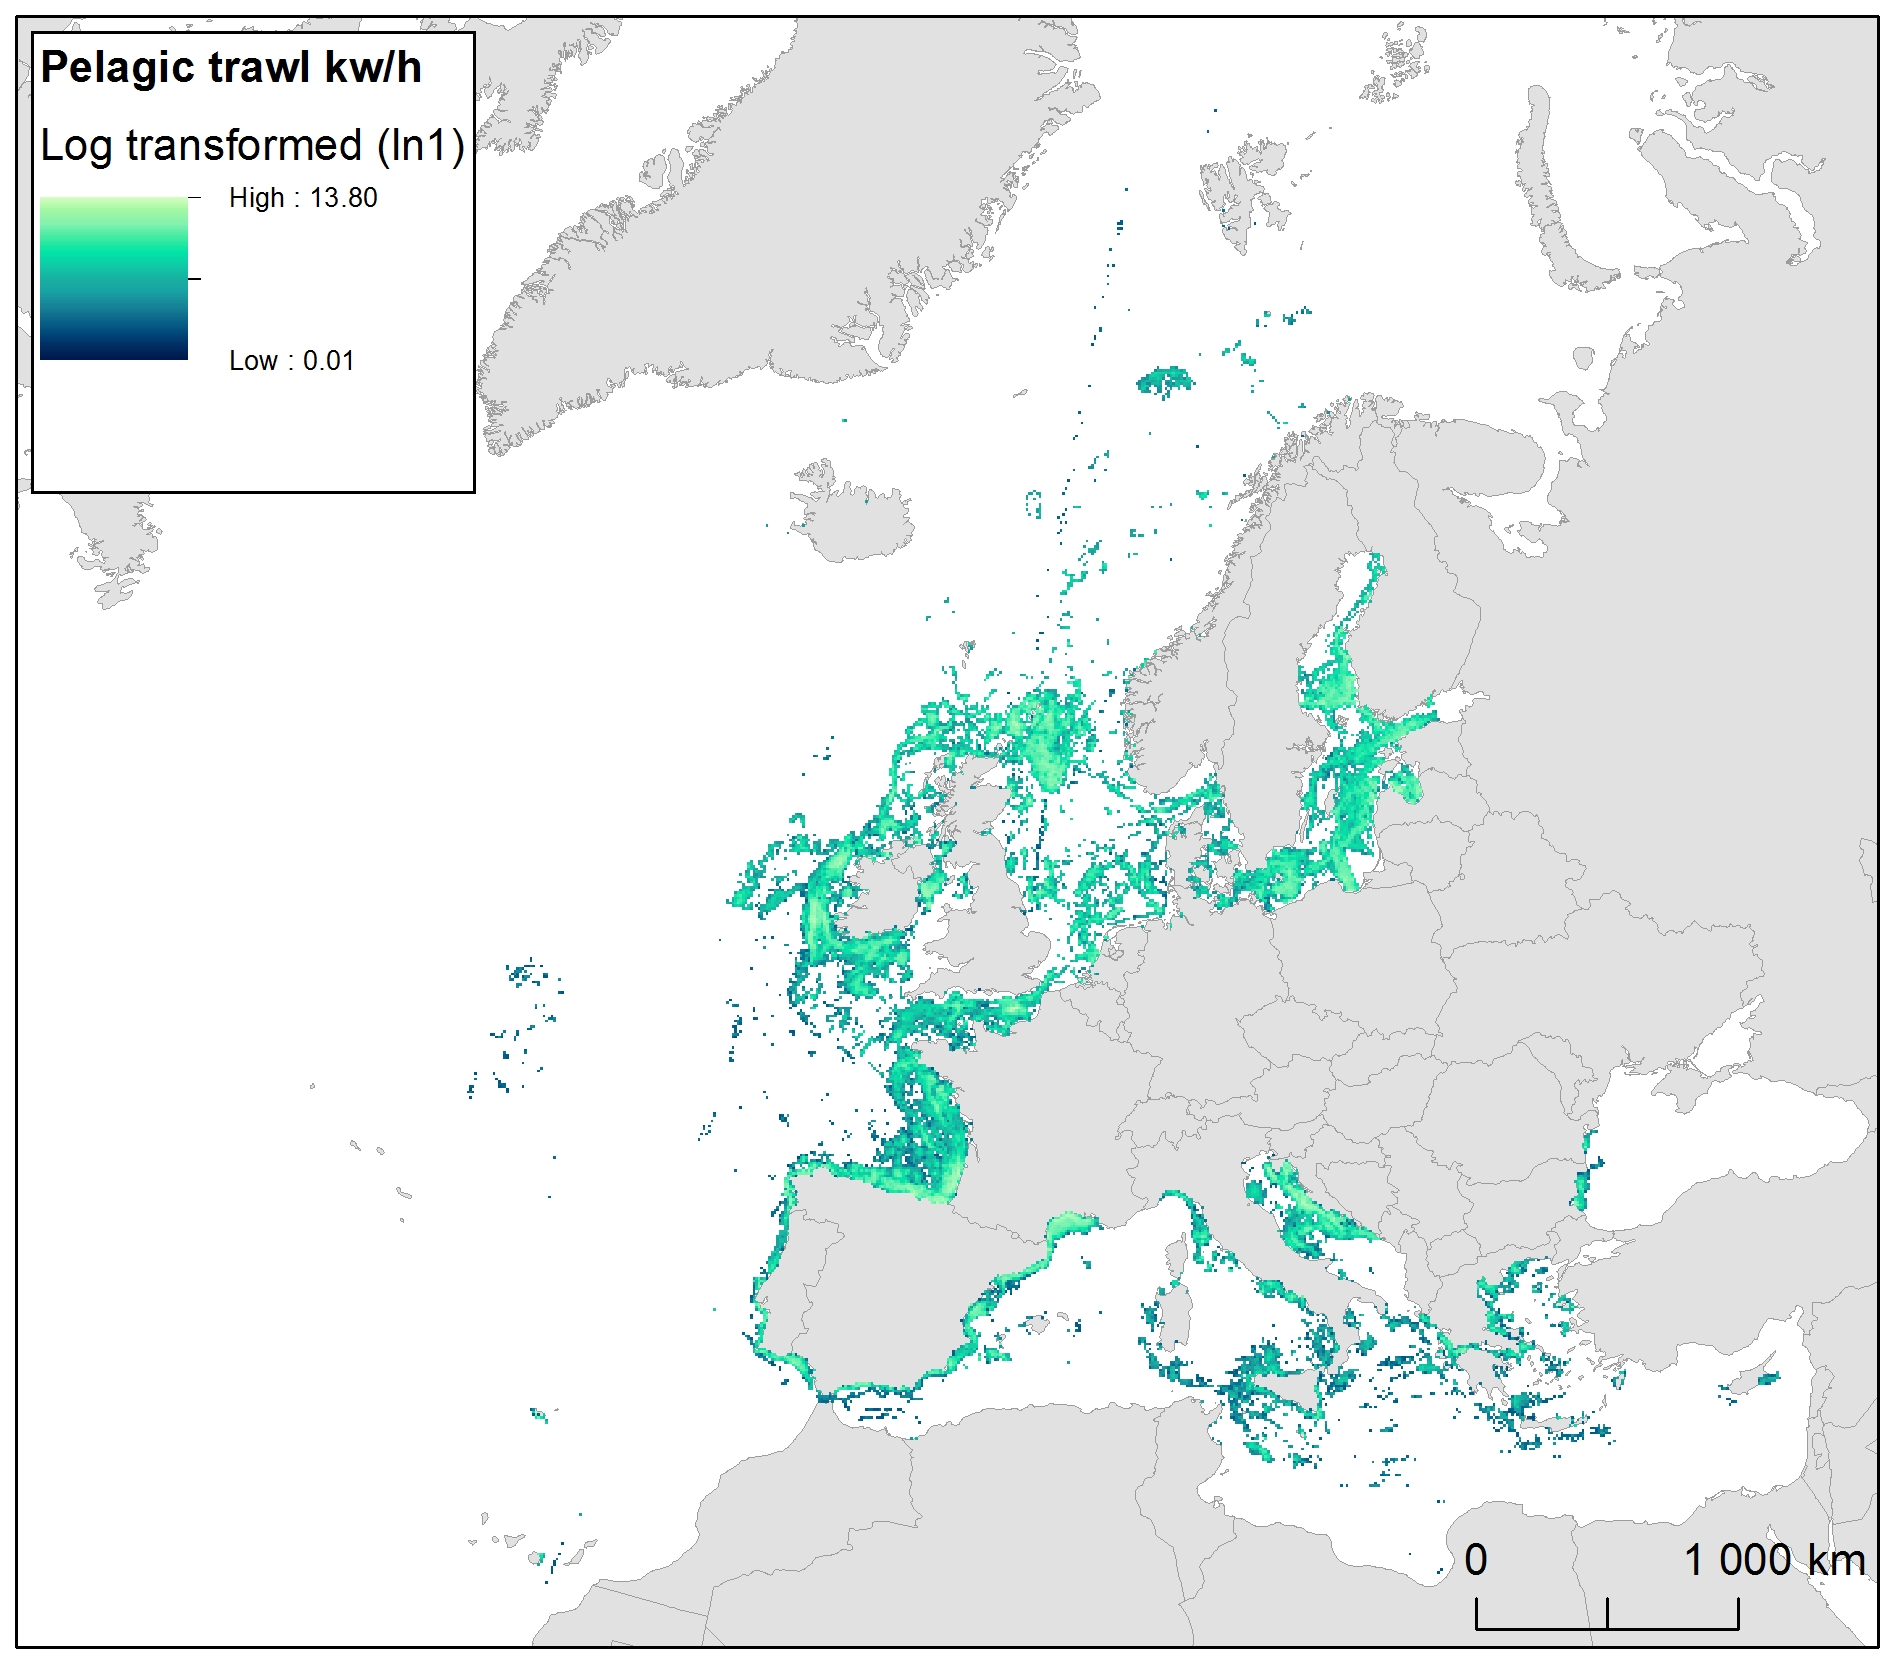
The raster dataset represents fishing intensity (kilowatt per fishing hour) by pelagic towed gears in the European seas. The dataset has been derived from Automatic Identification System (AIS) based pelagic fishing intensity data received from the European Commission’s Joint Research Centre - Independent experts of the Scientific, Technical and Economic Committee for Fisheries (JRC STECF), as well as from Vessel Monitoring System (VMS) and logbook based pelagic fishing effort data from HELCOM Commission. The temporal extent varies between the data sources (between 2013 and 2015). The dataset has been transformed to a logarithmic scale (ln1). This dataset has been prepared for the calculation of the combined effect index, produced for the ETC/ICM Report 4/2019 "Multiple pressures and their combined effects in Europe's seas" available on: https://www.eionet.europa.eu/etcs/etc-icm/etc-icm-report-4-2019-multiple-pressures-and-their-combined-effects-in-europes-seas-1.
-
This dataset presents the resulting assessment grid (based on the EEA reference grid) with the classification of chemical status of the transitional, coastal and marine waters in the context of the Water Framework Directive (WFD) and the Marine Strategy Framework Directive (MSFD). This classification has been performed using the CHASE+ tool, with classifications of the matrices ‘water’, ‘sediment’ and ‘biota’ and indicators of ‘biological effects’, as well as an integrated classification of chemical status, combining results of all matrices. The chemical status is evaluated in five classes, where NPAhigh and NPAgood are recognised as ‘non-problem areas’ and PAmoderate, PApoor and PAbad are recognised as ‘problem areas’. This is the assessment made excluding concentrations of mercury (Hg). The overall area of interest used is based on the marine regions and subregions under the Marine Strategy Framework Directive. Additionally, Norwegian (Barent Sea and Norwegian Sea) and Icelandic waters (’Iceland Sea’) have been added (see Surrounding seas of Europe). Note that within the North East Atlantic region only the subregions within EEZ boundaries (~200 nm) have been included. This dataset underpins the findings and cartographic representations published in the report "Contaminants in Europe's Seas" (EEA, 2019).
-
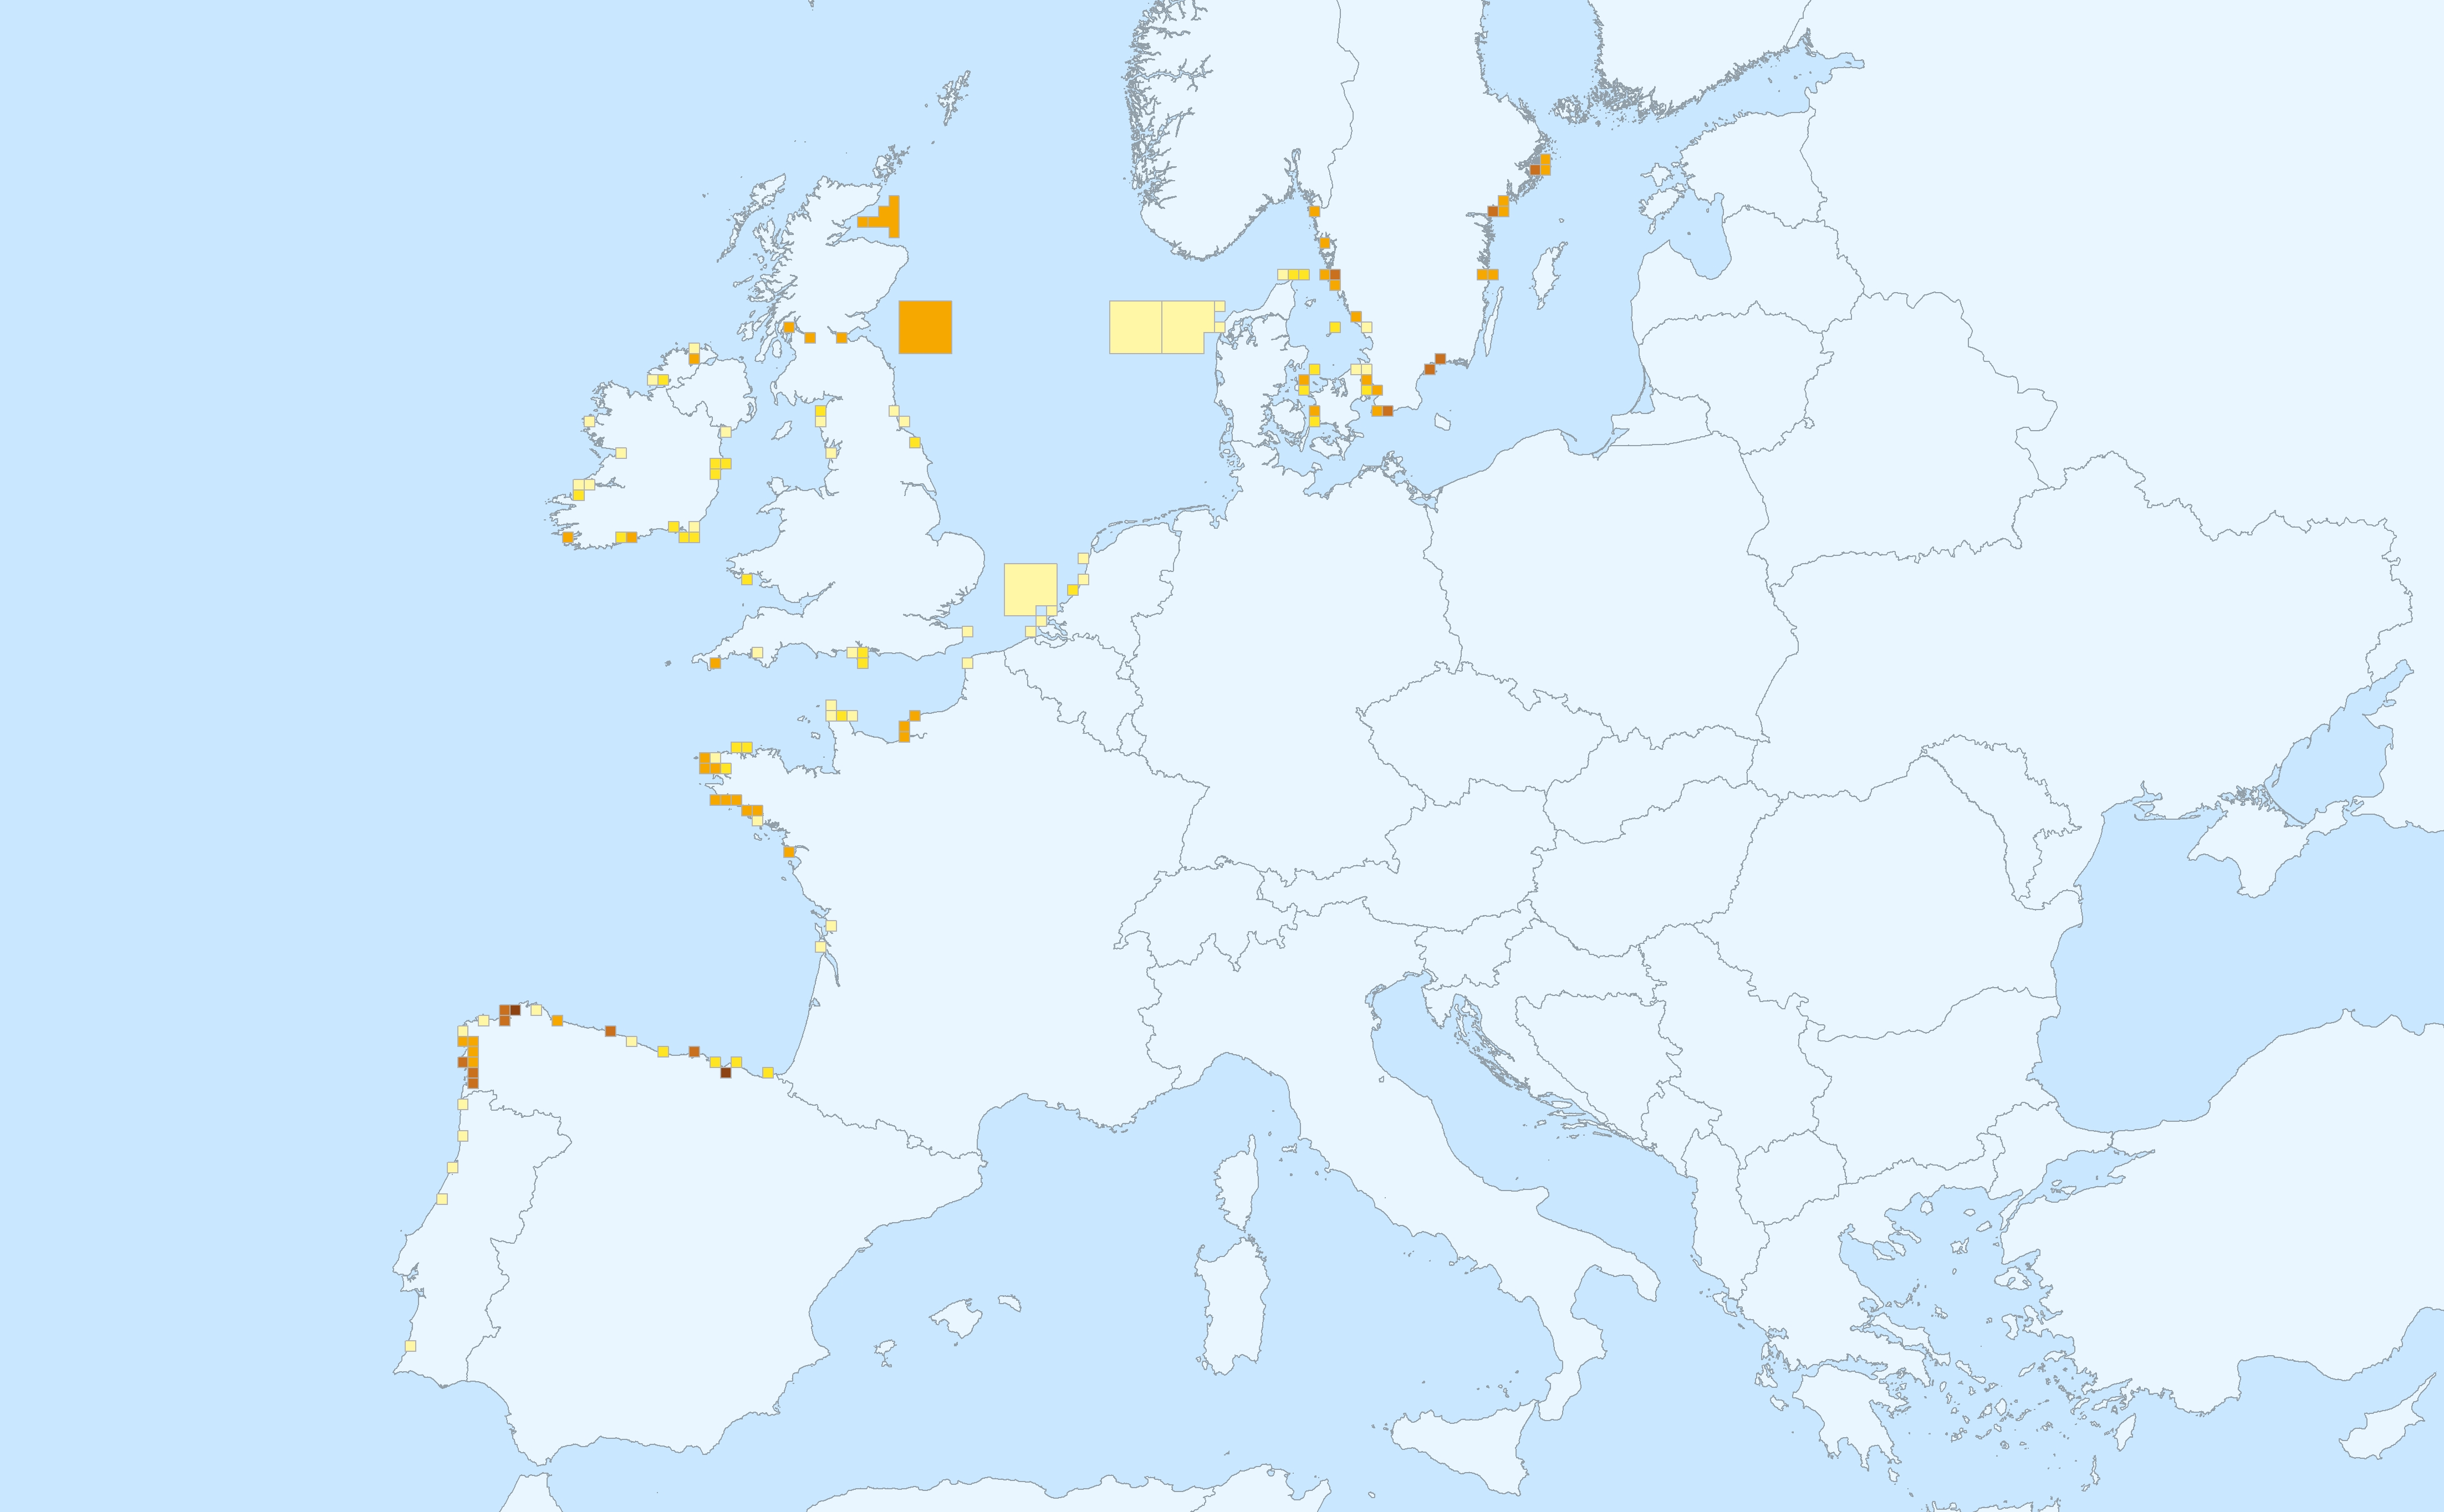
This data set presents the resulting assessment grid (based on the EEA reference grid) with the classification of chemical status of the transitional, coastal and marine waters in the context of the Water Framework Directive (WFD) and the Marine Strategy Framework Directive (MSFD), providing a mapping of contamination 'problem areas' and 'non-problem areas' based on measurements of biological effects. This classification has been performed using the CHASE+ tool, with classifications of the of contaminant status of indicators of biological effects. The status is evaluated in five classes, where NPAhigh and NPAgood are recognised as ‘non-problem areas’ and PAmoderate, PApoor and PAbad are recognised as ‘problem areas’. Monitoring biological effects is restricted to a few indicators (e.g. imposex) and data coverage is currently limited. Biological effects have thus been addressed in only 134 assessment units, mostly in the Baltic Sea, the North Sea and the North-East Atlantic Ocean. This data set underpins the findings and cartographic representations published in the EEA report “Contaminants in Europe’s seas” (No 25/2018). See the mentioned report for further information.
-
The bathing water quality data services include all coastal and inland bathing waters reported and assessed in the European Union Member States, Albania, Switzerland and the United Kingdom. The data is reported annually in the scope of the Bathing Water Directive (Directive 2006/7/EC of the European Parliament and of the Council of 15 February 2006, BWD) reporting obligations. The map services in https://water.discomap.eea.europa.eu/arcgis/rest/services/BathingWater show the location of the bathing waters and the assessment of bathing water quality for the last reported bathing season, as well as for the ten previous bathing seasons. Each bathing water is assessed for three statuses: 1) monitoring calendar status, 2) management status, 3) bathing water quality status. The monitoring calendar status evaluates the implementation of the monitoring calendar in the last reported season (as defined in Annex IV of the Bathing Water Directive). The management status evaluates the management in the last assessment period, whether the bathing water was continuously monitored or not. The bathing quality status evaluates the quality of bathing waters according to the two microbiological parameters: Escherichia coli and Intestinal enterococci (as defined in Annexes I and II of the Bathing Water Directive). The bathing water quality is classified in one of four classes: “Excellent”, “Good”, “Sufficient” or “Poor”. The status “Not classified” is applied if there are not enough available samples to evaluate the water quality. The data service in https://discodata.eea.europa.eu/ contains the results of the bathing water status since 1990: [WISE_BWD].[latest].[assessment_BathingWaterStatus] It also contains the reported data in the following tables: [WISE_BWD].[latest].[timeseries_Characterisation] [WISE_BWD].[latest].[timeseries_SeasonalPeriod] [WISE_BWD].[latest].[timeseries_MonitoringResult] [WISE_BWD].[latest].[spatial_SpatialProtected]
-
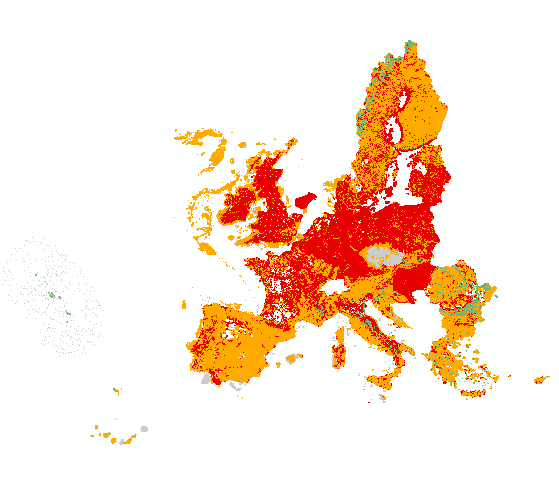
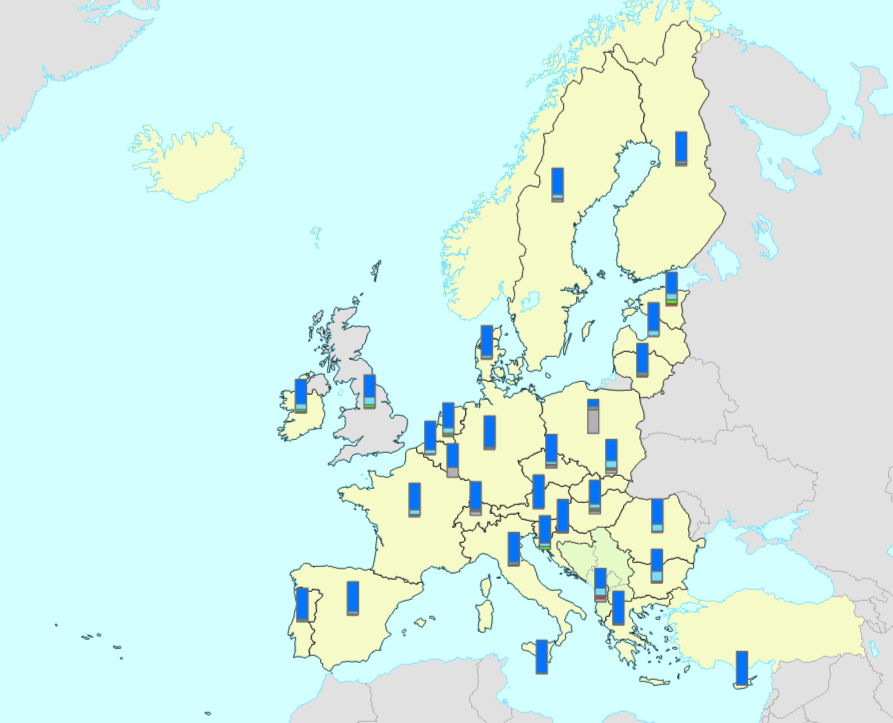
All Member States are requested by the Habitats Directive (92/43/EEC) to monitor habitat types and species listed in its annexes and send a report every 6 years following an agreed format. The assessment of conservation status is based on information about the status and trends of species populations and of habitats at the level of the biogeographical or marine region. The spatial dataset contains habitat and species distribution data (10km grid cells) as reported by Member States for the 2013-2018 period. This metadata refers to the public dataset, without sensitive species. The data sets are divided in two sets for species and two sets for habitat types. Species: ART17 species distribution MS (by Member State) ART17 species distribution EU (European Union aggregate) Habitats: ART17 habitats distribution MS (by Member State) ART17 habitats distribution EU (European Union aggregate) Both MS datasets are aggregated by habitat/species code, country and biogeographical /marine region [CO_MS_RE]. Using this attribute [CO_MS_RE] the tabular conservation status, which is available in the table, per biogeographical/marine region of the Member State level (MS) can be joined directly to the spatial dataset. Both EU datasets are aggregated by habitat/species code and biogeographical /marine region [CO_RE]. Using this attribute [CO_RE] the tabular conservation status, which is available in the table, of the biogeographical/marine region of the EU-28 level (EU) can be directly joined to the spatial dataset. Further description of the Article 17 tabular and spatial dataset and a Article 17 web tool can be accessed with the download data.
-
This dataset presents the resulting assessment grid (based on the EEA reference grid) with the classification of ecosystem health of the transitional, coastal and marine waters in the context of the Water Framework Directive (WFD) and the Marine Strategy Framework Directive (MSFD). This classification has been performed using the MESH+ (Marine EcoSystem Health) tool. The MESH+ tool builds on the EEA assessment tools developed and applied in the context of assessing the degree of contamination (CHASE+), eutrophication (HEAT+) and biodiversity (BEAT+) in Europe's seas (EEA, 2018a, 2019c; Vaughan et al., 2019). MESH+ makes use of the same data sets and threshold values used in these assessments but recombines these in a new framework that addresses 'ecosystem condition'. The overall area of interest used is based on the marine regions and subregions under the MSFD. Additionally, Norwegian (Barents Sea and Norwegian Sea) and Icelandic waters (’Iceland Sea’) have been added (see Surrounding seas of Europe). Note that within the North East Atlantic region only the subregions within EEZ boundaries (~200 nm) have been included. The spatial resolution of the assessment grid is 20 km x 20 km in coastal areas and 100 km x 100 km in offshore areas. This dataset underpins the findings and cartographic representations published in the report "Marine Messages II" (EEA, 2020): https://www.eea.europa.eu/publications/marine-messages-2