 Catalogue PIGMA
Sea surface height
Type of resources
Available actions
Topics
Keywords
Contact for the resource
Provided by
Years
Formats
Representation types
Update frequencies
status
Resolution
-

The mean sea surface (MSS) is an important field in physical oceanography, geophysics, and geodesy. In principle, it corresponds to the time-averaged height of the ocean surface. Auxiliary product : mean sea profile above a reference ellipsoid (T/P or WSG84). This surface is available on a regular grid (1/60°x1/60°, 1 minute). The mean sea surface MSS_CNES_CLS2025 (Charayon et al., in prep) has been computed using a 29-year [1993-2021] period of altimetric data. It was built exploring the use of SWOT KaRIn data to propose a new generation MSS able to better represent small wavelengths gapping state-of-the-art nadir-based MSS. Long wavelengths come from a MSS draft chosen to be the Hybrid 23 MSS (https://doi.org/10.24400/527896/a01-2024.002 ) low pass filtered at 20km since this nadir-based MSS model already captured well long wavelengths. The wavelengths shorter than 100km are improved thanks to a SWOT-KaRIn mean profile anomaly to the MSS draft. This mean profile anomaly is built with: - The SWOT-KaRIn science (L3 v3.0 Expert, cycles 1 to 31 included except cycle 17, https://doi.org/10.24400/527896/a01-2023.018) dataset - The experimental multimission gridded L4 sea level heights and velocities with SWOT using MIOST (https://doi.org/10.24400/527896/a01-2025.001 ). - In SWOT diamonds, since KaRIn data are not available, we used another innovation only based on DT2024 1Hz CryoSat2 and AltiKa SSHA data (https://doi.org/10.48670/moi-00146), period from 2010 to 2025, SSHA data relative to MSS Hybrid 23 low pass filtered at 5km. To build this nadir-based innovation, we used the static part of the mapping from MIOST method.
-
Along-track altimetric GDR (Geophysical Data Record) products , geophysical and environmental corrections to apply. Available missions are: GFO, Topex/Poseidon, Envisat, Cryosat-2, Jason-1, Jason-2, Jason-3, Saral/AltiKa. Missions with several successive orbital types are treated in their entirety. Compared to the original version of the GDR files distributed by the CNES, ESA, NASA and ISRO agencies, the CTOH proposes new corrections and parameters in these files, which are to be applied to the initial altimetry measurement, according to user needs. Children metadata files are available for each mission.
-
The SIROCCO ocean circulation climate simulations cover the western Mediterranean Sea ( 33°N - 44.5°N / 1.2°W - 16.3°E ) and the periods from 2000 to 2020, from 2030 to 2049, and form 2080 to 2099. It is based on the BlueLion configuration of the Symphonie hydrodynamic model (Marsaleix et al., 2008, 2019). The horizontal resolution of the model bipolar grid (1230 x 1308) varies from 340 m in the northwestern Mediterranean to 4.5 km in the Ionian Sea. The vertical grid has vanishing quasi-sigma 50 levels. This dataset includes daily files of sea surface height, temperature, salinity and current velocities. This simulations were developed in the framework of the ANR POPNCO and the PPR RIOMAR. The initial and open boundary conditions, the atmospheric forcing and the rivers discharge were provided by the CNRM-RCSM6B, regional climate system model (atmosphere, ocean, land surface hydrology) developed at CNRM (Météo-France) over the Mediterranean CORDEX domain (Med-CORDEX). This coupled simulation is based on the NEMO model at 1/12° for the ocean, the Aladin-Climat model at 12 km for the atmosphere and the ISBA-CTRIP land surface hydrology model.
-

Barystatic and manometric sea level changes represent the mass component of sea level changes at global and regional scales, respectively. Barystatic sea level changes are estimated using the sea level budget (SLB) approach combining satellite altimetry with in-situ measurements of the seawater temperature and salinity. This SLB approach is adapted from Barnoud et al., (2023; https://doi.org/10.5194/os-19-321-2023). Manometric sea level variations and their uncertainties are not provided for the SLB approach, due to the high uncertainties associated with the drift of the halosteric component (e.g., Bouih et al., 2025; https://doi.org/10.5194/egusphere-egu24-16813).
-
The SIROCCO ocean circulation simulation covers the western Mediterranean Sea ( 33°N - 44.5°N / 1.2°W - 16.3°E ) and the period from 1990 to 2023. It is based on the BlueLion configuration of the Symphonie hydrodynamic model (Marsaleix et al., 2008, 2019). The horizontal resolution of the model bipolar grid (1230 x 1308) varies from 340 m in the northwestern Mediterranean to 4.5 km in the Ionian Sea. The vertical grid has vanishing quasi-sigma 50 levels. This dataset includes daily files of sea surface height, temperature, salinity and current velocities. This simulation was developed in the framework of the PPR RIOMAR. The initial and open boundary conditions, the atmospheric forcing and the rivers discharge (except from the Gulf of Lion) were provided by the CNRM-RCSM6B, regional climate system model (atmosphere, ocean, land surface hydrology) developed at CNRM (Météo-France) over the Mediterranean CORDEX domain (Med-CORDEX). This coupled simulation is based on the NEMO model at 1/12° for the ocean, the Aladin-Climat model at 12 km for the atmosphere and the ISBA-CTRIP land surface hydrology model. The Gulf of Lion rivers were considered using the hydrology database HydroPortail (http ://www.hydro.eaufrance.fr).
-
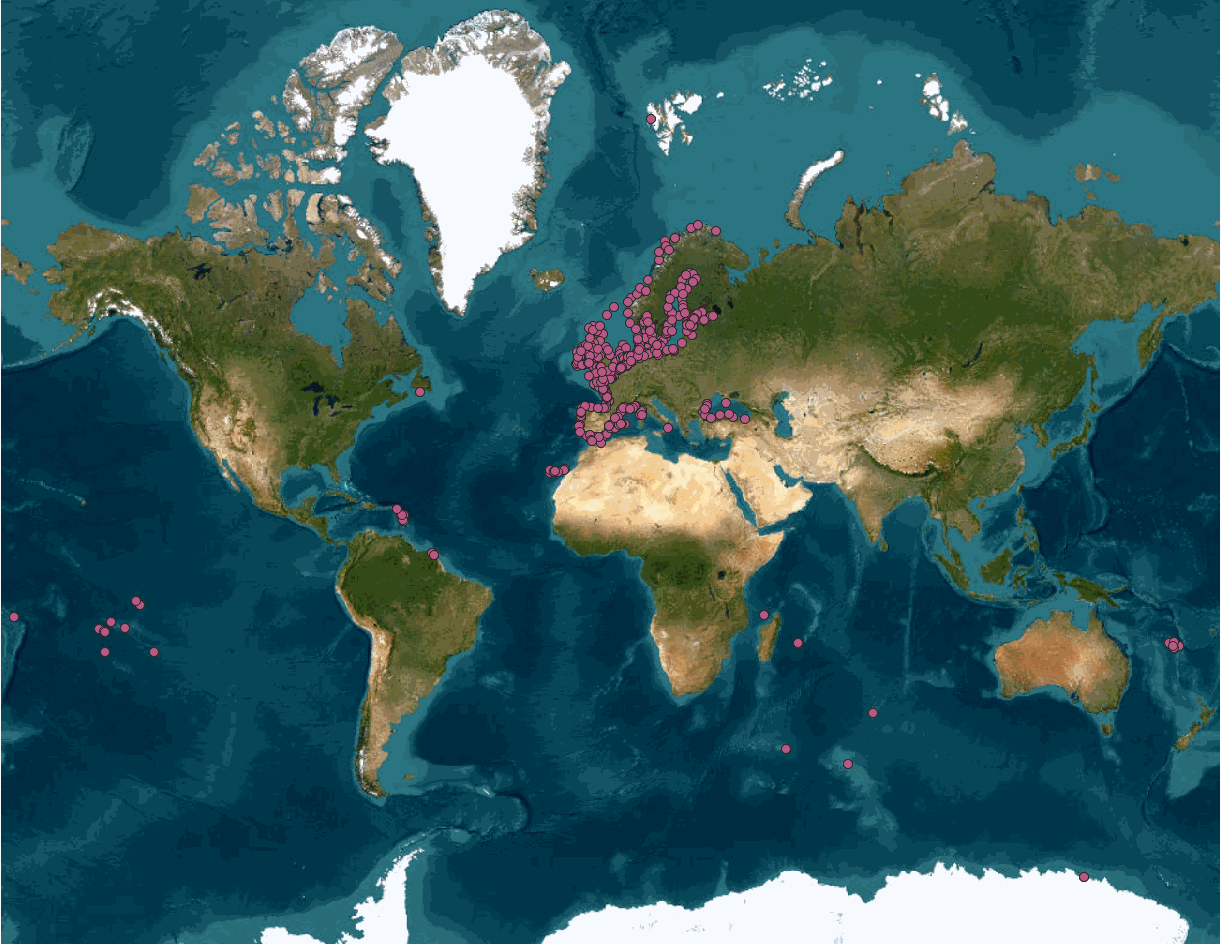
This product integrates sea level observations aggregated and validated from the Regional EuroGOOS consortium (Arctic-ROOS, BOOS, NOOS, IBI-ROOS, MONGOOS) and Black Sea GOOS as well as from the Global telecommunication system (GTS) used by the Met Offices. The latest version of Copernicus delayed-mode Sea level product is also distributed from Copernicus Marine catalogue.
-
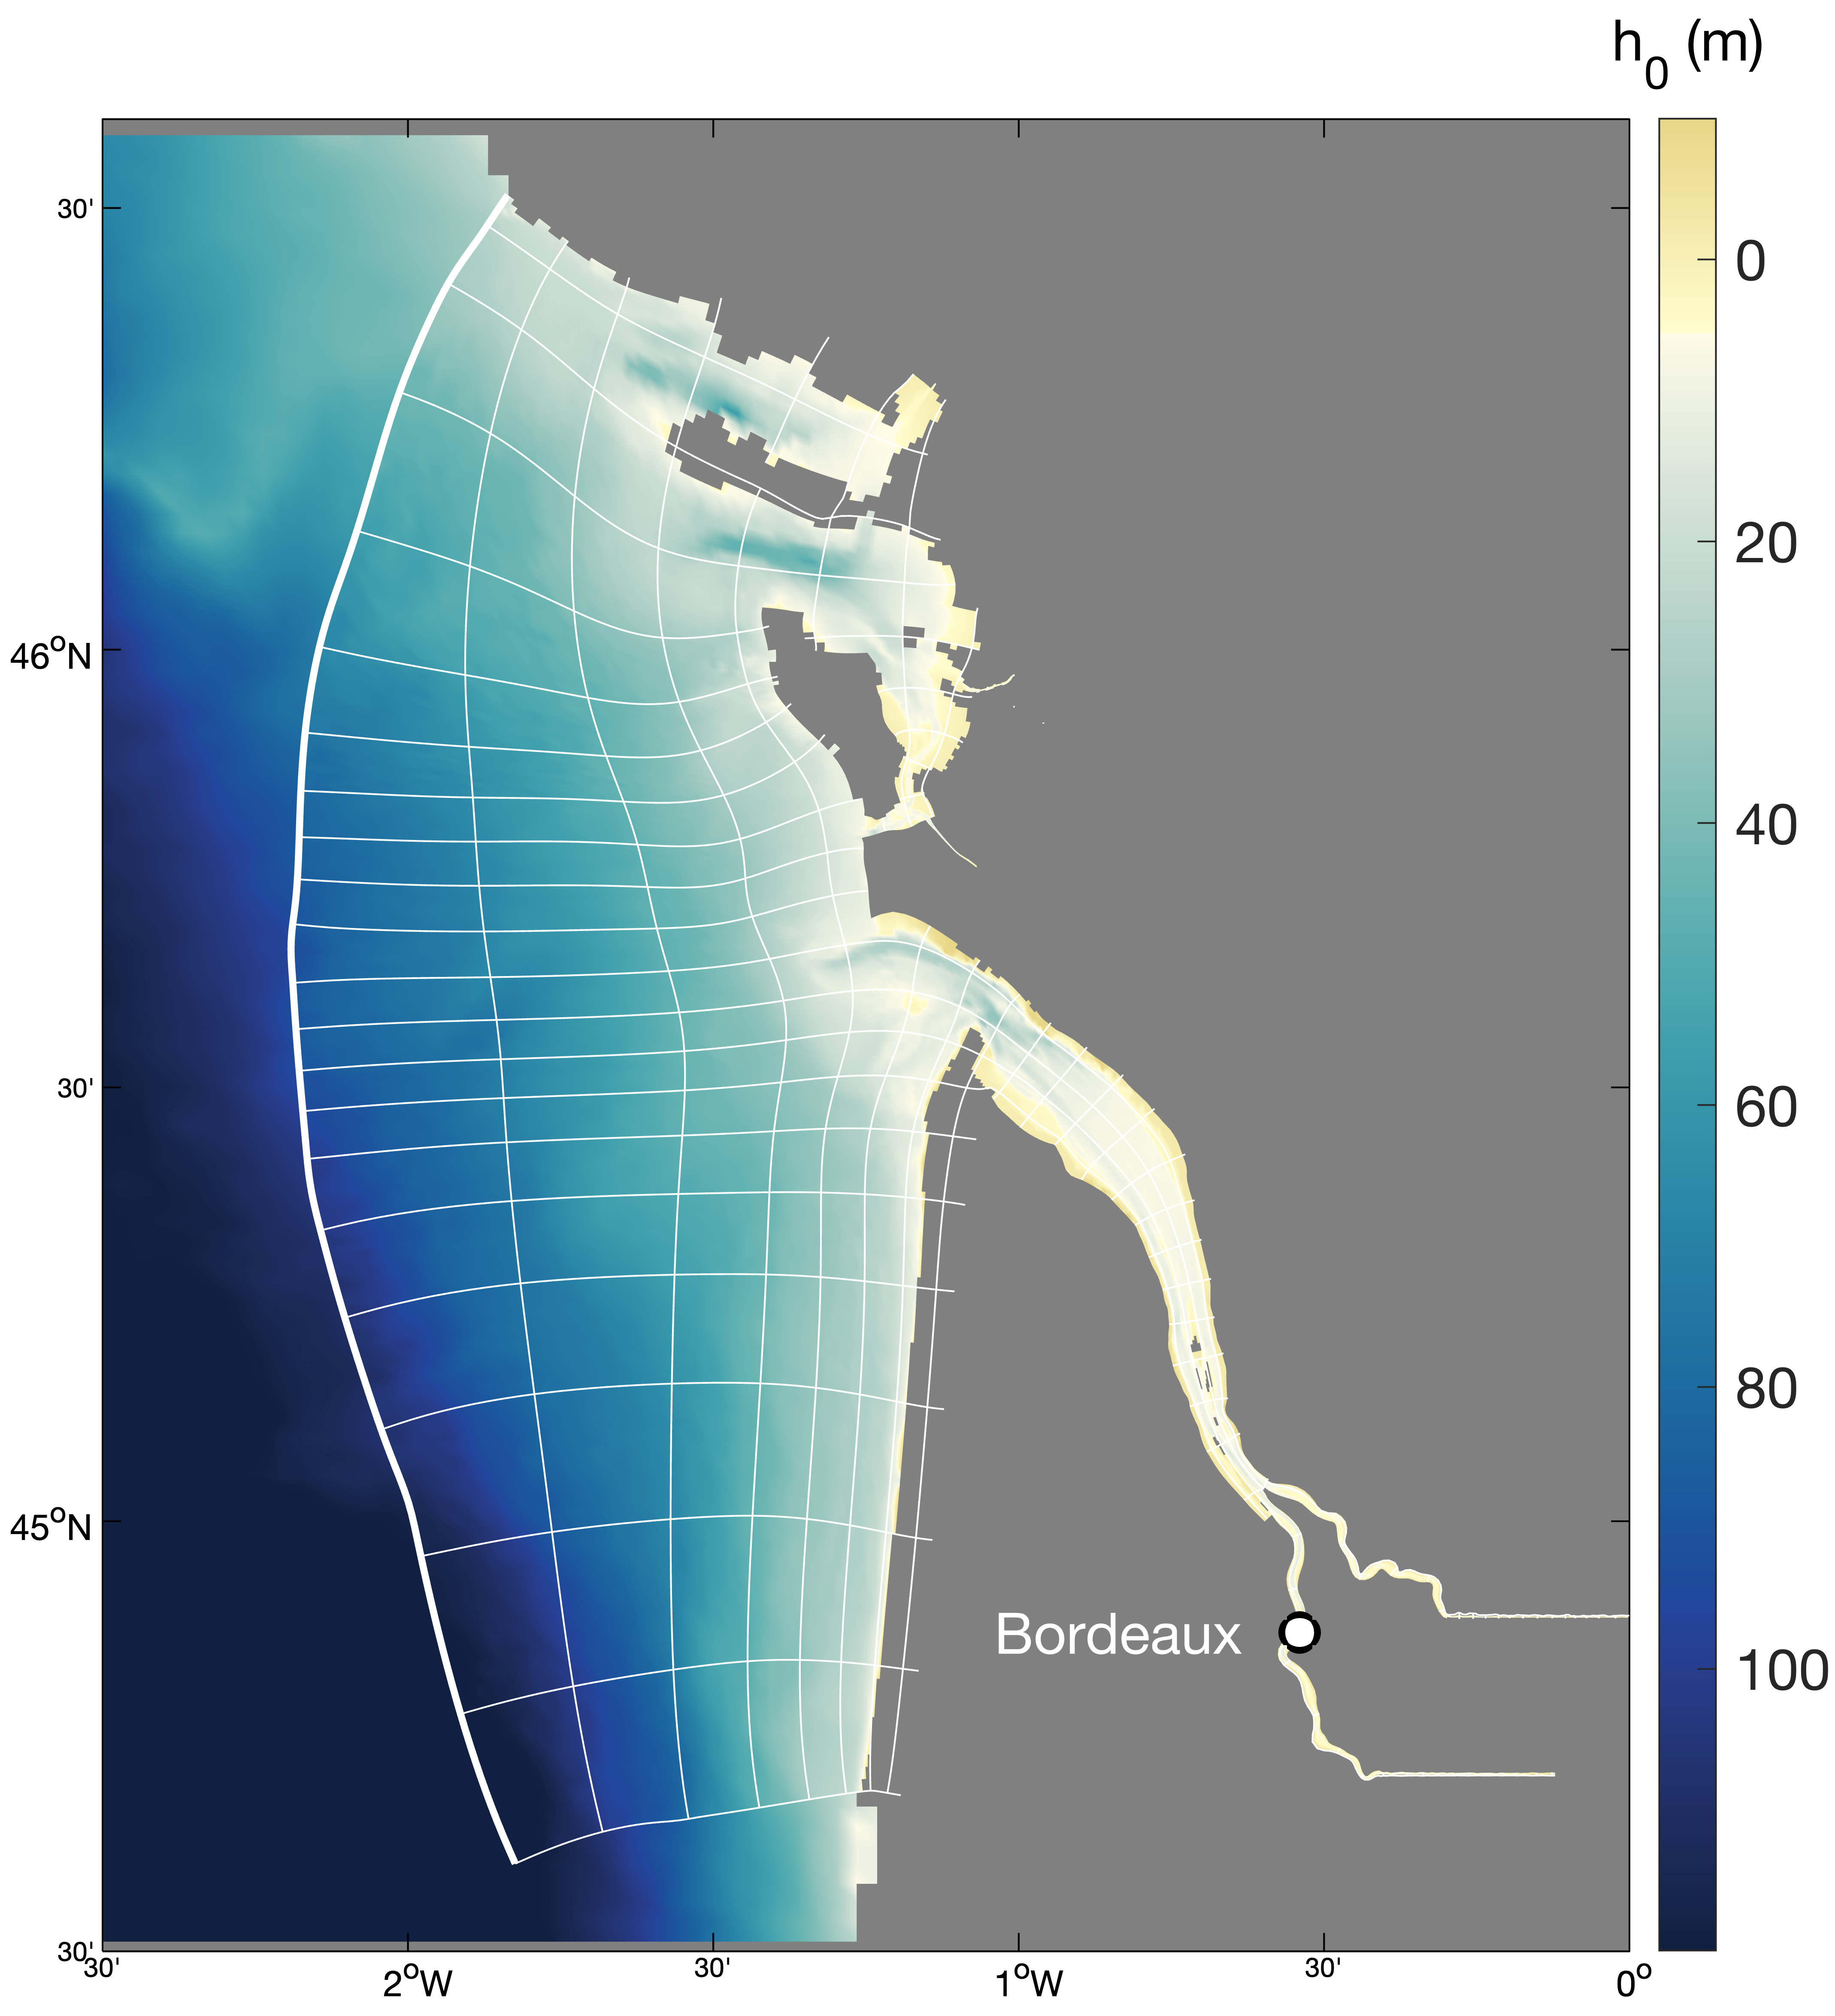
Hydrodynamics and sediment dynamics hindcast in the Gironde Estuary (France), produced by coupling the hydrodynamics model MARS3D (with sediment dynamics module MUSTANG) and wave spectral model WAVEWATCH III®.
-
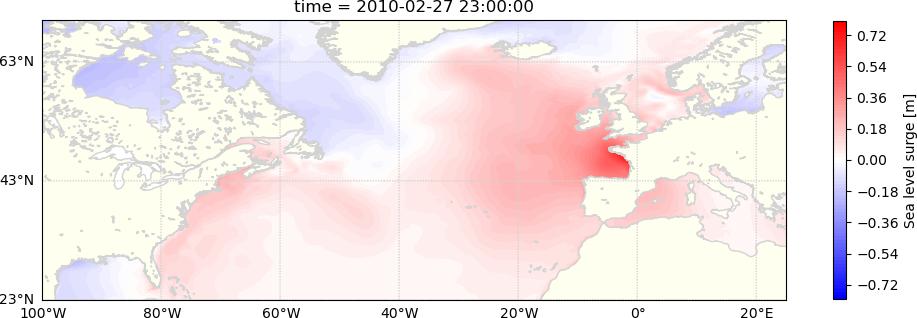
The dataset consists of hourly sea levels and surges over 1900-2015 in the North Atlantic, on a 0.1° grid (directory "HINDCAST" ) and extracted at 34 stations (directory “STATIONS”).
-
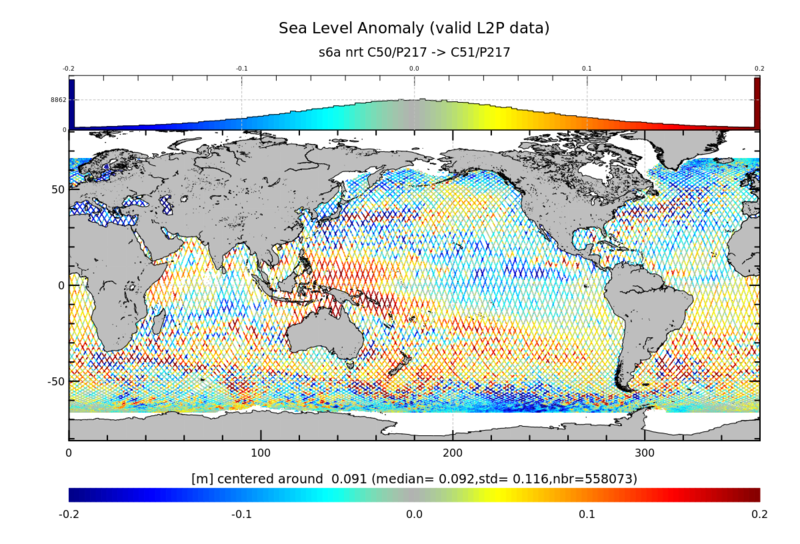
The Level-2P (L2P) products are pre-operational homogenized, mono-mission satellite altimetry datasets generated by the DUACS production system. They provide 1‑Hz along‑track SLA data together with the full set of standardised geophysical and environmental corrections (e.g., tide‑free sea level, inverse barometer, sea‑state bias, atmospheric corrections). The L2P SLA datasets are the primary input for the higher‑order DUACS processing chain that yields the operational sea‑level (Level-3 and Level-4) products distributed by the Copernicus Marine Service (CMS) and the Copernicus Climate Change Service (C3S). **Processing Timeliness:** - **Near-Real-Time (NRT)**: Rapid delivery windows (under 3h – up to 24h for the newest passes) for operational marine forecasting. - **Short Time Critical (STC)**: Intermediate latency (24h – 3 days) streams optimized for quick-turnaround cal/val and monitoring. - **Non-Time Critical (NTC)**: Science‑quality dataset (30 days – up to 90 days) with the most stable baseline corrections; foundation for long‑term climate analyses. The L2P SLA NRT/STC 20Hz data products version 3.0 (DUACS DT 2021 baseline) are available for the following missions: Jason-3, Sentinel‑3A, Sentinel‑3B and Sentinel‑6 Michael Freilich (MF). The L2P SLA NTC 1Hz data products version 3.0 (DUACS DT 2021 baseline) are available for the following missions: ERS‑1, TOPEX/Poseidon, ERS‑2, Geosat‑Follow‑On, Jason‑1, Envisat, Jason‑2, CryoSat‑2, Haiyang‑2A, SARAL/AltiKa, Jason‑3, Sentinel‑3A, Sentinel‑3B and Sentinel‑6 Michael Freilich (MF).
-
The CORE-II simulations provide a framework to evaluate ocean model performance, to study mechanisms of ocean phenomena and their variability from seasonal to decadal timescales, to identify forced variability changes, and to develop mechanistic descriptions of observed climate variability and change.