NetCDF
Type of resources
Available actions
Topics
Keywords
Contact for the resource
Provided by
Years
Formats
Representation types
Update frequencies
status
Scale
Resolution
-
In recent years, large datasets of in situ marine carbonate system parameters (partial pressure of CO2 (pCO2), total alkalinity, dissolved inorganic carbon and pH) have been collated. These carbonate system datasets have highly variable data density in both space and time, especially in the case of pCO2, which is routinely measured at high frequency using underway measuring systems. This variation in data density can create biases when the data are used, for example for algorithm assessment, favouring datasets or regions with high data density. A common way to overcome data density issues is to bin the data into cells of equal latitude and longitude extent. This leads to bins with spatial areas that are latitude and projection dependent (eg become smaller and more elongated as the poles are approached). Additionally, as bin boundaries are defined without reference to the spatial distribution of the data or to geographical features, data clusters may be divided sub-optimally (eg a bin covering a region with a strong gradient). To overcome these problems and to provide a tool for matching in situ data with satellite, model and climatological data, which often have very different spatiotemporal scales both from the in situ data and from each other, a methodology has been created to group in situ data into ‘regions of interest’, spatiotemporal cylinders consisting of circles on the Earth’s surface extending over a period of time. These regions of interest are optimally adjusted to contain as many in situ measurements as possible. All in situ measurements of the same parameter contained in a region of interest are collated, including estimated uncertainties and regional summary statistics. The same grouping is done for each of the other datasets, producing a dataset of matchups. About 35 million in situ datapoints were then matched with data from five satellite sources and five model and re-analysis datasets to produce a global matchup dataset of carbonate system data, consisting of 287,000 regions of interest spanning 54 years from 1957 to 2020. Each region of interest is 100 km in diameter and 10 days in duration. An example application, the reparameterisation of a global total alkalinity algorithm, is shown. This matchup dataset can be updated as and when in situ and other datasets are updated, and similar datasets at finer spatiotemporal scale can be constructed, for example to enable regional studies. This dataset was funded by ESA Satellite Oceanographic Datasets for Acidification (OceanSODA) project which aims at developing the use of satellite Earth Observation for studying and monitoring marine carbonate chemistry.
-
This product contains weekly salinity field, based on SMOS satellite data, and ISAS (In-Situ Analysis System). The L4OS SMOS-OI product contains global Level 4 analyses of the of the Sea Surface Salinity (SSS), Sea Surface Density (SSD) and Sea Surface Spiciness (SSSp), along with Sea Surface Absolute Salinity (SSA), Conservative Temperature (SCT), surface thermal expansion coefficient (alpha) and haline contraction coefficient (beta). The SSS product is obtained using an optimal interpolation (OI) algorithm, that combines ISAS in situ SSS OI analyses and Soil Moisture Ocean Salinity (SMOS) satellite image to reduce large scale and temporally varying bias. The SSS L4 product outcome is then combined with satellite SST products to compute thermodynamic sea water parameters using TEOS-10 (Kolodziejczyk et al., 2021). Products from reprocessing RE07 are available for the period 01/2011 - 05/2021. Products from operational (OPER) processing are available since 06/2021. Reprocessed products and operational products are derived using the same algorithm and configuration, hence ensuring the temporal continuity. The base products, for all the CATDS-PDC (Centre Aval de Traitement des Données SMOS - Production & Dissemination Center) processing chains, are the SMOS L1B products from ESA (European Space Agency). From these, brightness temperatures at various incidence angles are reconstructed. The Sea Surface Salinity (SSS) are retrieved from multi-angular brightness temperatures through a maximum likehood Bayesian approach in which measured Tb and Tb simulated using a forward direct model are compared (see Zine et al. 2008 for a general description of the retrieval method, and pro_con table for a summary of the similarities/differences with respect to ESA level 2 ocean salinity processing).
-
The Level-2 Ka-band Radar Interferometer (KaRIn) low rate (LR, ocean) sea surface height (SSH) data product from the Surface Water and Ocean Topography (SWOT) mission, also referenced by the short name L2_LR_SSH, provides ocean topography measurements from the low rate ocean data stream of the KaRIn instrument, spanning 60 km on either side of the nadir altimeter with a nadir gap. The L2_LR_SSH product is available continuously and globally, although different versions of the product may be produced at different latencies and/or through different reprocessing with refined input data. Note that L2_LR_SSH does not include SSH data from the SWOT nadir altimeter. The SWOT L2_LR_SSH product is organized in four files, the L2_LR_SSH ['WindWave'] is described in this metadata sheet. The 3 other file types (['Basic'], ['Expert'], ['Unsmoothed']) are described by 3 different metadata sheets that can be accessed via the links below. The ['WindWave'] file is intended for users interested in wind and wave information. The ['Basic'] file is intended for users who are interested in SSH measurements and who will use the KaRIn measurements as provided. The ['Expert'] file is intended for expert users who are interested in the details of how the KaRIn measurements were derived and who may use detailed information for their own custom processing. The ['Unsmoothed'] file, also intended for expert users, is provided on a finer 'native' grid of 250-m (with minimal smoothing applied), and has a significantly larger data volume than the other files. The ['WindWave'] L2_LR_SSH includes measured significant wave height (SWH), normalized radar cross section (NRCS or backscatter cross section or sigma0), wind speed derived from sigma0 and SWH, wind and wave model information, and quality flags on a 2 km geographically fixed grid. May 2025: v3.0 (version D) Production and distribution of the L2_LR_SSH version D products: - PID0 for forward-processed version D products: from May 6, 2025 onward, - PGD0 for reprocessed version D products: from March 30 to July 10, 2023 (phase CalVal) and from July 26, 2023 to May 19, 2025 (phase Science) is ongoing. August 2024: v2.0 (version D) L2_LR_SSH version C products declared as validated by the SWOT project. March 2024: v2.0 (version C) Production and distribution of the pre-validated L2_LR_SSH version C products: - PIC0 for forward-processed version C products: November 23, 2023 to present, - PGC0 for reprocessed version C products: from March 30 to July 10, 2023 (phase CalVal) and from July 26, 2023 to January 25, 2024 (phase Science) November 2023: v1.0 The beta pre-validated L2_LR_SSH version 1.0 product (summer 2023 reprocessing release) is available only for the 1-day CalVal orbit phase, from March 29 to July 10, 2023, and the 21-day Science orbit phase from September 7 to November 21, 2023.
-
-
-
This product is an intermediate product, that provides, in daily files, SSS corrected from land-sea contamination and latitudinal bias. Ascending and descending orbits are processed separately
-
-
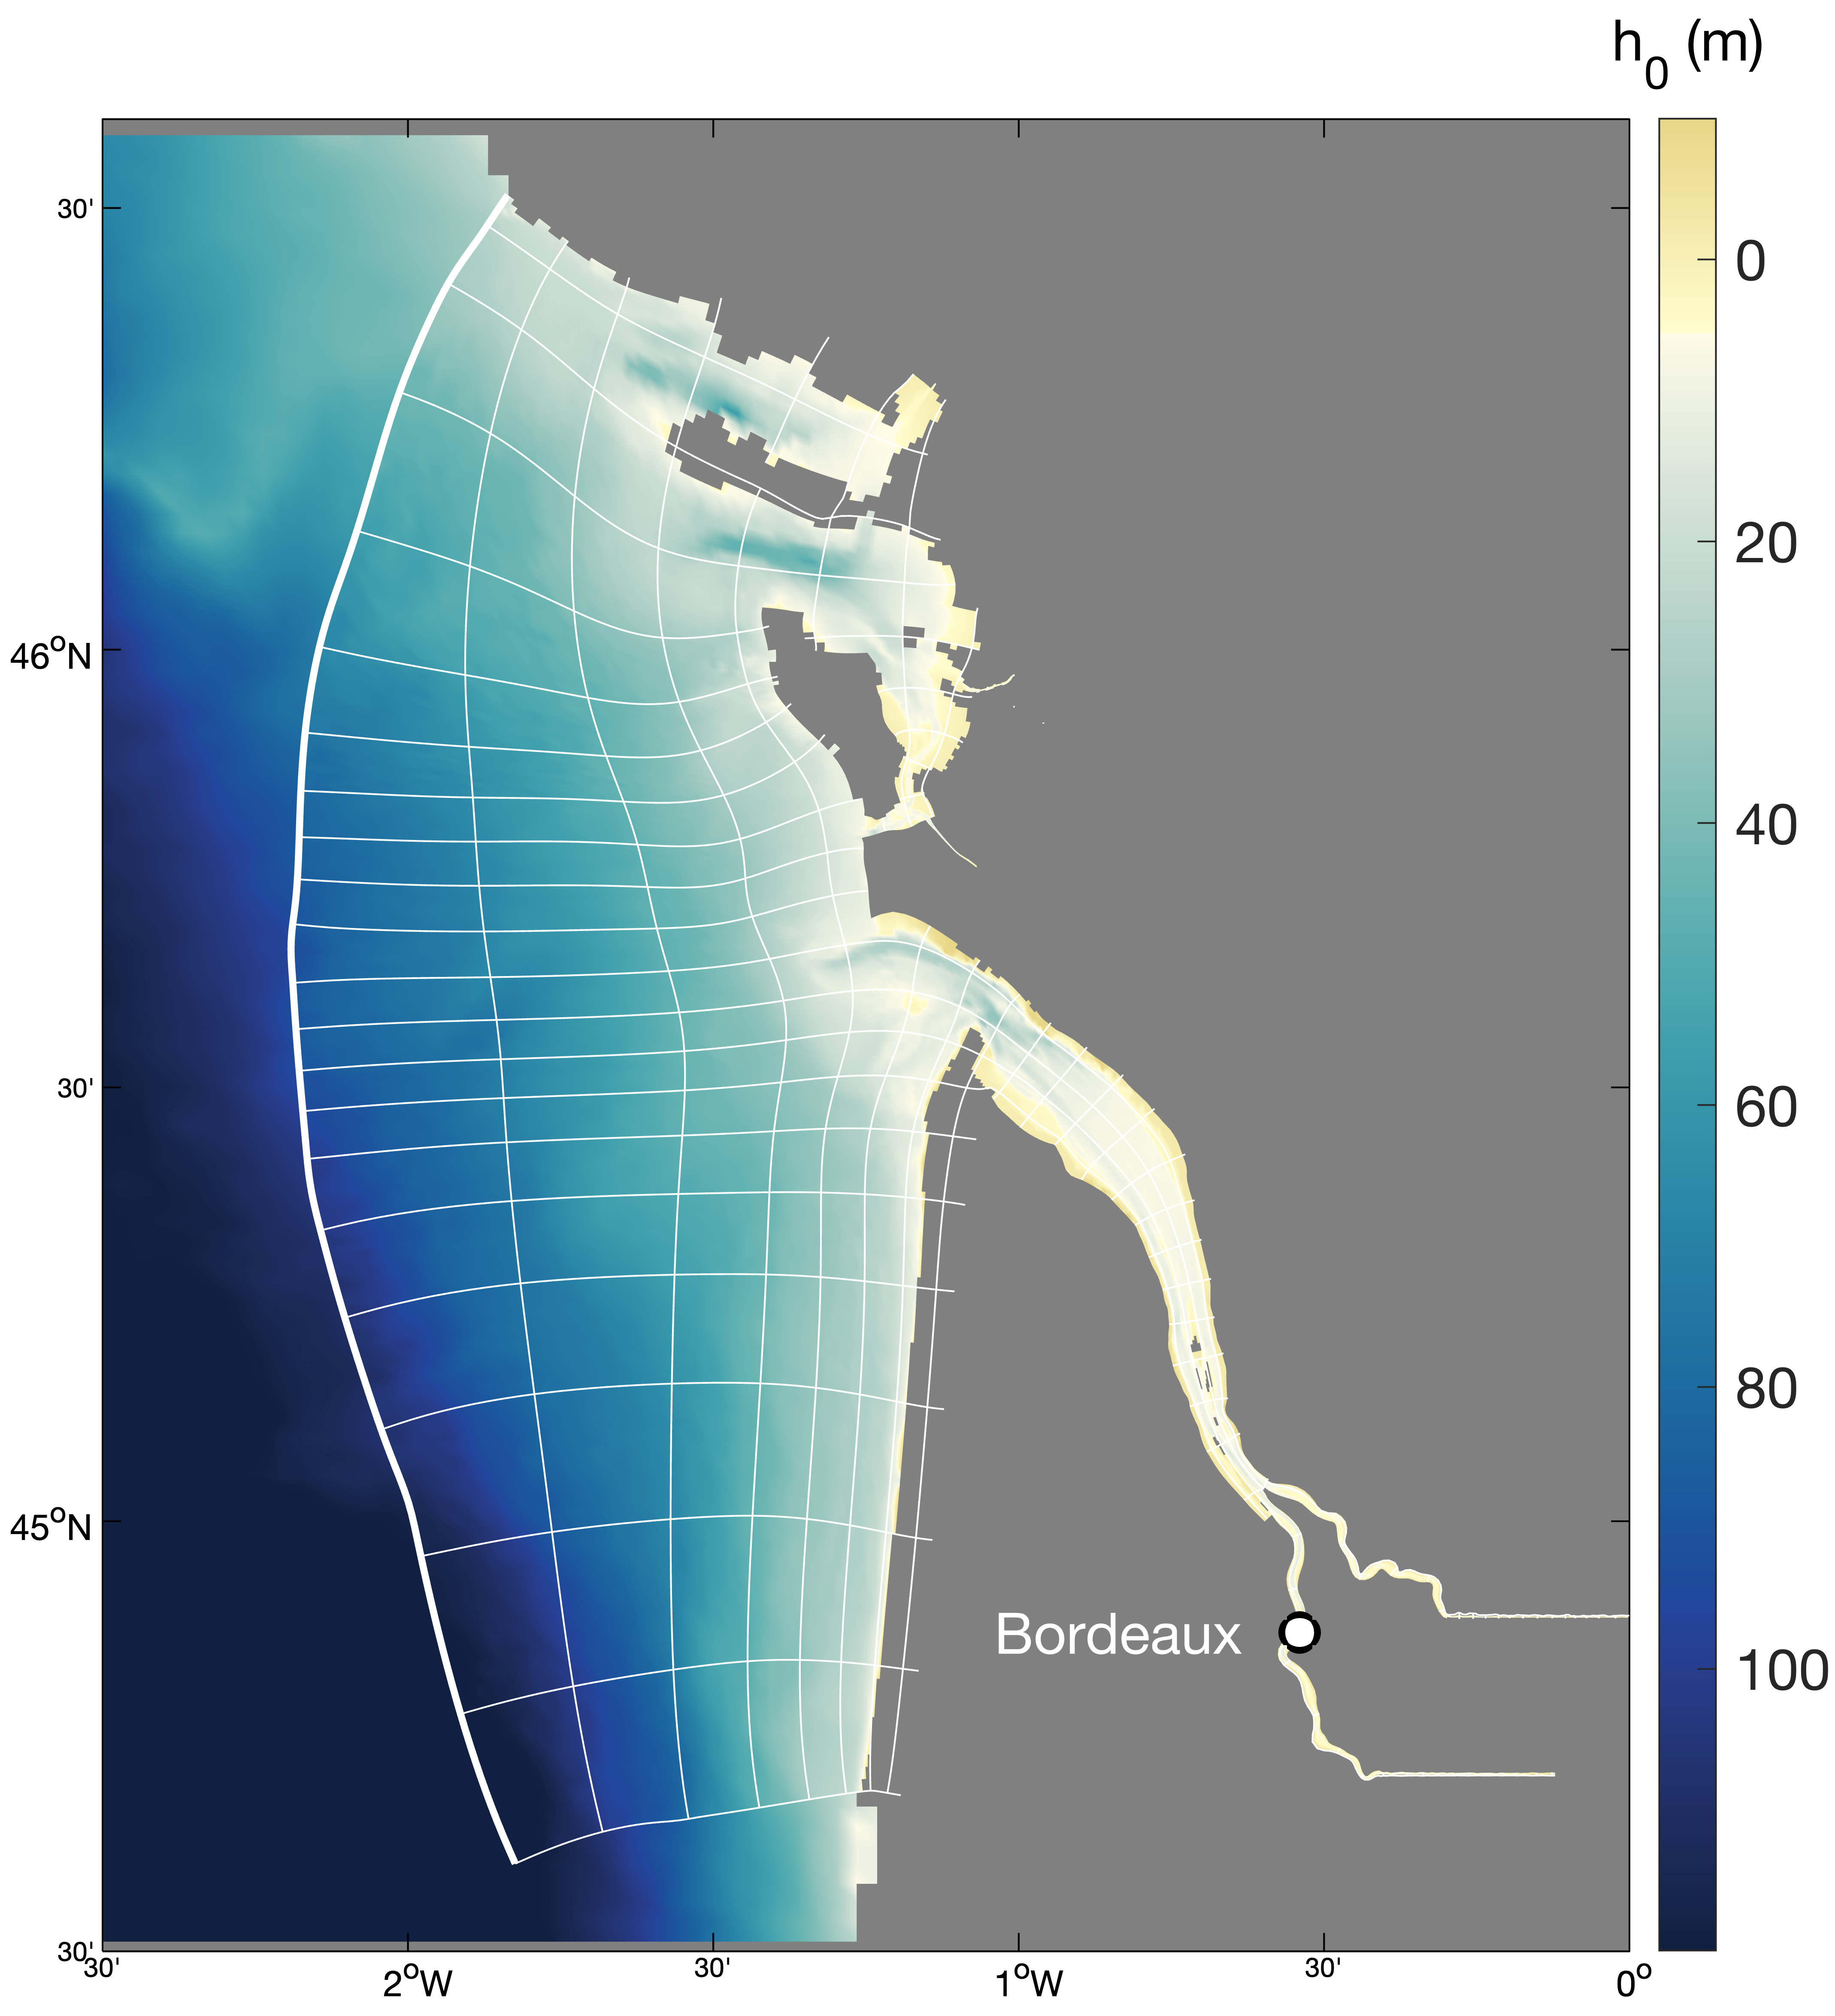
Hydrodynamics and sediment dynamics hindcast in the Gironde Estuary (France), produced by coupling the hydrodynamics model MARS3D (with sediment dynamics module MUSTANG) and wave spectral model WAVEWATCH III®.
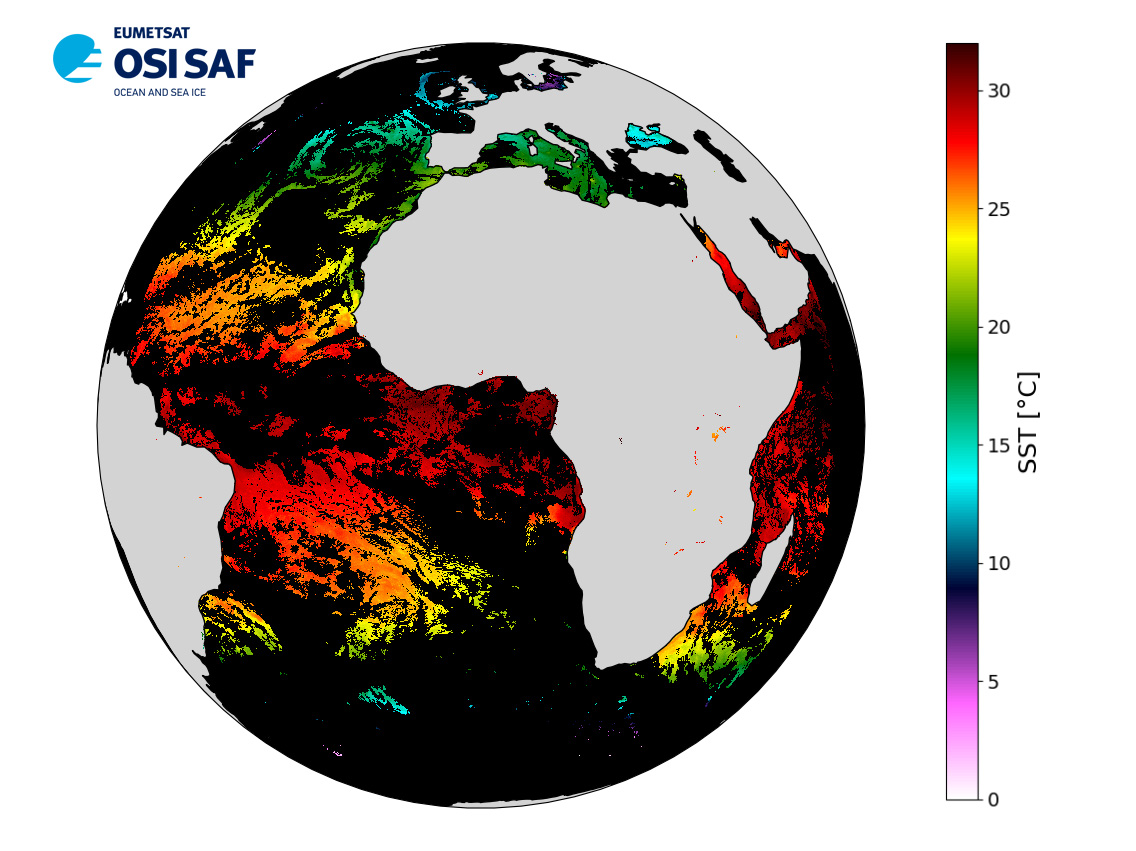
-
-
Conversion into the EMODnet format of the published grid for the Capbreton Canyon in 2007: http://dx.doi.org/10.12770/72e2f750-c255-11df-a9b6-005056987263