 Catalogue PIGMA
South Brazilian Shelf
Type of resources
Available actions
Topics
Keywords
Contact for the resource
Provided by
Years
Formats
Representation types
Update frequencies
status
Resolution
-
The availability of user-friendly, high-resolution global environmental datasets is crucial for bioclimatic modelling. For terrestrial environments, WorldClim has served this purpose since 2005, but equivalent marine data only became available in 2012, with pioneer initiatives like Bio-ORACLE providing data layers for several ecologically relevant variables. Currently, the available marine data packages have not yet been updated to the most recent Intergovernmental Panel on Climate Change (IPCC) predictions nor to present times, and are mostly restricted to the top surface layer of the oceans, precluding the modelling of a large fraction of the benthic diversity that inhabits deeper habitats. To address this gap, we present a significant update of Bio-ORACLE for new future climate scenarios, present-day conditions and benthic layers (near sea bottom). The reliability of data layers was assessed using a cross-validation framework against in situ quality-controlled data. This test showed a generally good agreement between our data layers and the global climatic patterns. We also provide a package of functions in the R software environment (sdmpredictors) to facilitate listing, extraction and management of data layers and allow easy integration with the available pipelines for bioclimatic modelling.
-
NASA's OceanColor Web is supported by the Ocean Biology Processing Group (OBPG) at NASA's Goddard Space Flight Center. Our responsibilities include the collection, processing, calibration, validation, archive and distribution of ocean-related products from a large number of operational, satellite-based remote-sensing missions providing ocean color, sea surface temperature and sea surface salinity data to the international research community since 1996. As a Distributed Active Archive Center (DAAC), known as the Ocean Biology DAAC (OB.DAAC), we are responsible for the archive and distribution of satellite ocean biology data produced or collected under NASA EOSDIS, including those from historical missions and partner space organizations.
-

The code and files contained in this repository support replication of a broad-scale benthic habitat classification of the South Atlantic produced by McQuaid et al. (2023). We used statistical clustering algorithms to classify broad-scale (10km2) environmental data into distinct habitat classes, which reflect variation in physical conditions and we assume support distinct biological communities. We request that any use of the input data is referenced as per the table below, and that classification outputs are referenced as: McQuaid K. A. Bridges A. E. H., Howell K. L., Gandra T. B. R., de Souza V., Currie J. C., Hogg O. T., Pearman T. R. R., Bell J. B. B., Atkinson L. J., Baum D., Bonetti J., Carranza A., Defeo O., Furey T., Gasalla M. A., Golding N, Hampton S. L., Horta S., Jones D. O. B., Lombard A. T., Manca E., Marin Y., Martin S., Mortensen P., Passdore C., Piechaud N., Sink K. J. & Yool A. 2023. Broad-scale benthic habitat classification of the South Atlantic. Progress in Oceanography. DOI: https://doi.org/10.1016/j.pocean.2023.103016
-

MISSION ATLANTIC assesses the whole Atlantic, and ecosystem components at risk from natural hazards and the consequences of human activities, including individual regional Case Studies, and their interconnectivity. To do this, Mission Atlantic develops IEAs for seven regional Case Studies, in sub-Arctic and Tropical regions of the Atlantic Ocean, ranging from shelf seas to the mid-Atlantic Ridge: 1) Norwegian Sea 2) Celtic Sea 3) Canary Current 4) North Mid Atlantic Ridge 5) South Mid Atlantic Ridge 6) Benguela Current 7) South Brazilian Shelf
-
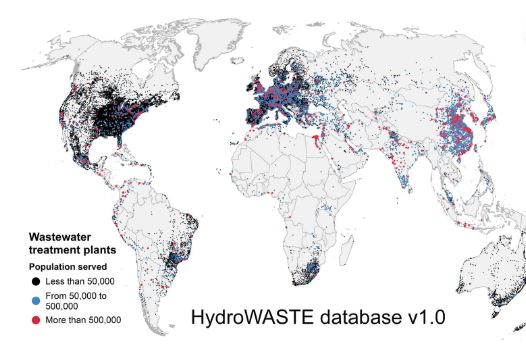
HydroWASTE is a spatially explicit global database of 58,502 wastewater treatment plants (WWTPs) and their characteristics. This database was developed by combining national and regional datasets with auxiliary information to derive or complete missing characteristics, including the amount of people served, the flow rate of effluents, and the level of treatment of processed wastewater. The HydroSHEDS river network with streamflow estimates was used to geo-reference plant outfall locations and to assess the distribution of wastewaters at a global scale. All wastewater treatment plants are co-registered to the global river network of the HydroRIVERS database via their estimated outfall locations.
-
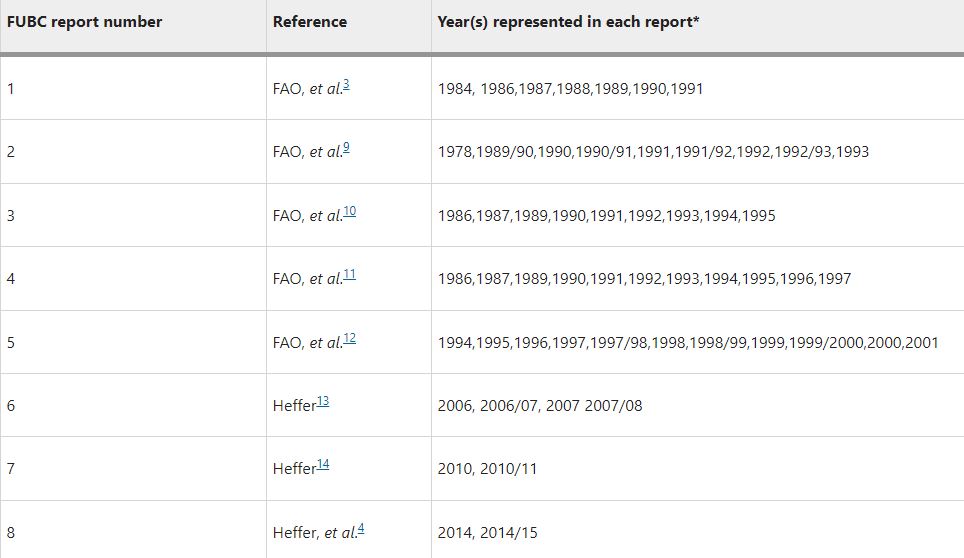
Understanding how much inorganic fertilizer (referred to as fertilizer) is applied to different crops at national, regional and global levels is an essential component of fertilizer consumption analysis and demand projection. Good information on fertilizer use by crop (FUBC) is rarely available because it is difficult to collect and time-consuming to process and validate. To fill this gap, a first global FUBC report was published in 1992 for the 1990/1991 period, based on an expert survey conducted jointly by the Food and Agriculture Organization (FAO) of the UN, the International Fertilizer Development Center (IFDC) and the International Fertilizer Association (IFA). Since then, similar expert surveys have been carried out and published every two to four years in the main fertilizer-consuming countries. Since 2008 IFA has led these efforts and, to our knowledge, remains the only globally available data set on FUBC. This dataset includes data (in CSV format) from a survey carried out by IFA to represent the 2017–18 period as well as a collation of all historic FUBC data.
-

Finding suitable ecological state indicators is challenging and cumbersome in stochastic and complex ecological systems. INDperform is an R package for validating the performance of ecological state indicators and assessing the ecological status based on a suite of indicators. The performance evaluation addresses the sensitivity and robustness of indicators.
-

The Copernicus Marine Service (or Copernicus Marine Environment Monitoring Service) is the marine component of the Copernicus Programme of the European Union. It provides free, regular and systematic authoritative information on the state of the Blue (physical), White (sea ice) and Green (biogeochemical) ocean, on a global and regional scale. It is funded by the European Commission (EC) and implemented by Mercator Ocean International. It is designed to serve EU policies and International legal Commitments related to Ocean Governance, to cater for the needs of society at large for global ocean knowledge and to boost the Blue Economy across all maritime sectors by providing free-of-charge state-of-the-art ocean data and information. It provides key inputs that support major EU and international policies and initiatives and can contribute to: combating pollution, marine protection, maritime safety and routing, sustainable use of ocean resources, developing marine energy resources, blue growth, climate monitoring, weather forecasting, and more. It also aims to increase awareness amongst the general public by providing European and global citizens with information about ocean-related issues.
-

An R Package that provides supporting functions for conducting Integrated Ecosystem Assessments (IEA), developed in the framework of Mission Atlantic. The package includes methods for data exploration and assessment of the current ecosystem status. Forked repository in Mission Atlantic. For latest version, check the original repository.
-
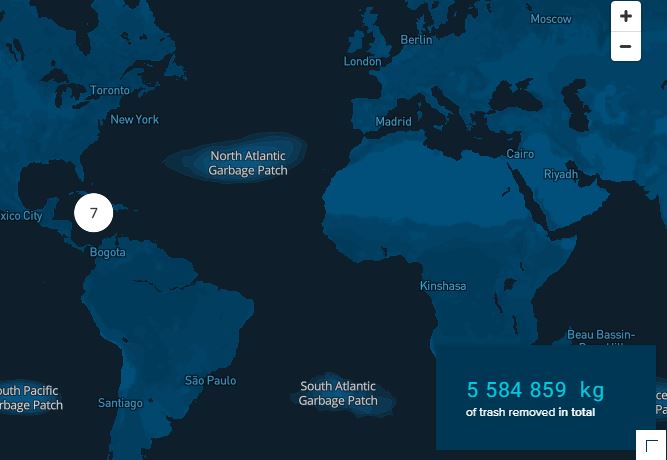
Every year, millions of tons of plastic enter the oceans, of which the majority spills out from rivers. A portion of this plastic travels to ocean garbage patches, where it gets caught in a vortex of circulating currents alongside plastic from other sources (e.g. offshore fishing activities). If no action is taken, plastic will increasingly impact our ecosystems, health, and economies. The Ocean Cleanup is a non-profit organization developing and scaling technologies to rid the oceans of plastic. To achieve this objective, we have to work on a combination of closing the sources of plastic pollution and cleaning up what has already accumulated in the ocean and doesn’t go away by itself. This goal means we plan to put ourselves out of business – once we have completed this project, our work is done. To rid the oceans of plastic, we need not only to clean up what is already out there but also stop new plastic from entering the ocean – we need to close the tap. Working together with government leaders, individuals, and private corporations, our goal is to tackle these 1000 most polluting rivers all over the world Every single year, marine plastic costs the economy (6 to 19) billions of dollars – impacting tourism, fisheries and aquaculture, and (governmental) cleanups. And that doesn’t include the impact on our health and on the marine ecosystem. Intercepting plastic in rivers is much more cost-effective than dealing with the consequences downstream.