 Catalogue PIGMA
GeoTIFF
Type of resources
Available actions
Topics
Keywords
Contact for the resource
Provided by
Years
Formats
Representation types
Update frequencies
status
Scale
Resolution
-
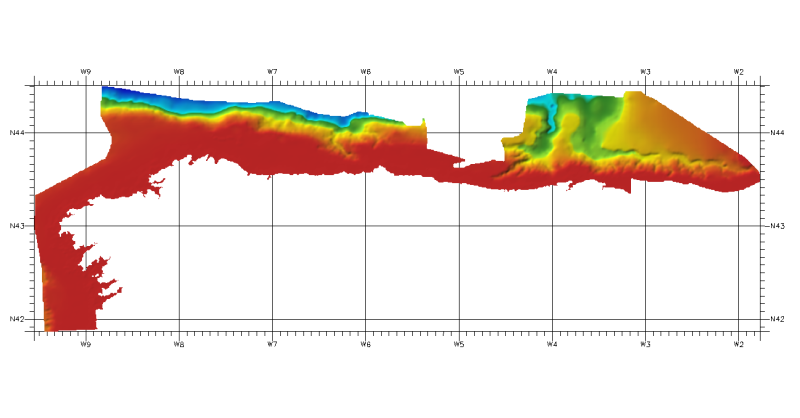
DTM of continental margin of Cantabric Sea, resolution 100 meters. This DTM includes the whole area from coast line to deepest level (5544,23 m).
-
Maps of seasonal p90 (percentile 90) of Chla on the North Atlantic basin for the past ten years (2005-2014) using the Global Copernicus chla level 4 (L4) products (resolution of 4 km). Method as Gohin Francis, Saulquin Bertrand, Bryere Philippe (2010) Atlas de la Température, de la concentration en Chlorophylle et de la Turbidité de surface du plateau continental français et de ses abords de l’Ouest européen. Ifremer. http://archimer.ifremer.fr/doc/00057/16840/
-
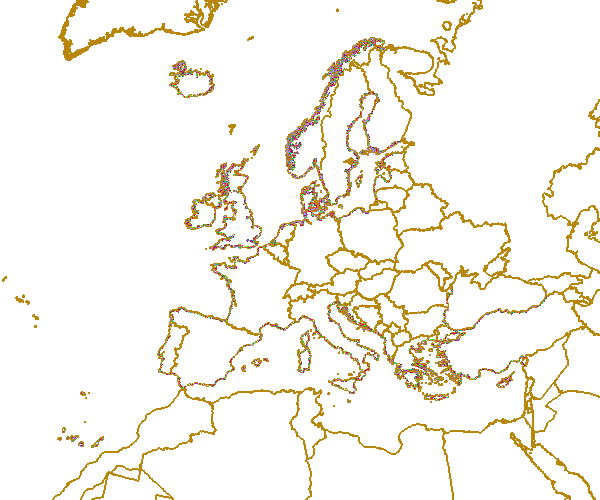
Coastal zones are presented as a series of 10 consecutive buffers of 1km width each (towards inland). For this dataset, were treated as sea data all areas with a class value of 523 (sea and ocean) in Corine Land Cover (details in lineage).
-
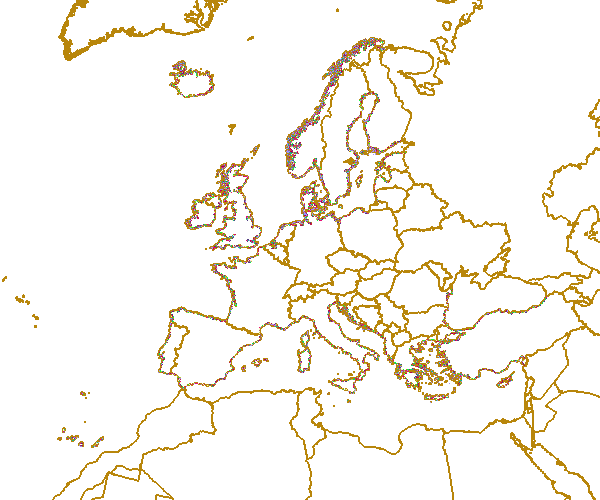
This dataset is the coastal zone land surface region from Europe, derived from the coastline towards inland, as a series of 10 consecutive buffers of 1km width each. The coastline is defined by the extent of the Corine Land Cover 2018 (raster 100m) version 20 accounting layer. In this version all Corine Land Cover pixels with a value of 523, corresponding to sea and oceans, were considered as non-land surface and thus were excluded from the buffer zone.
-
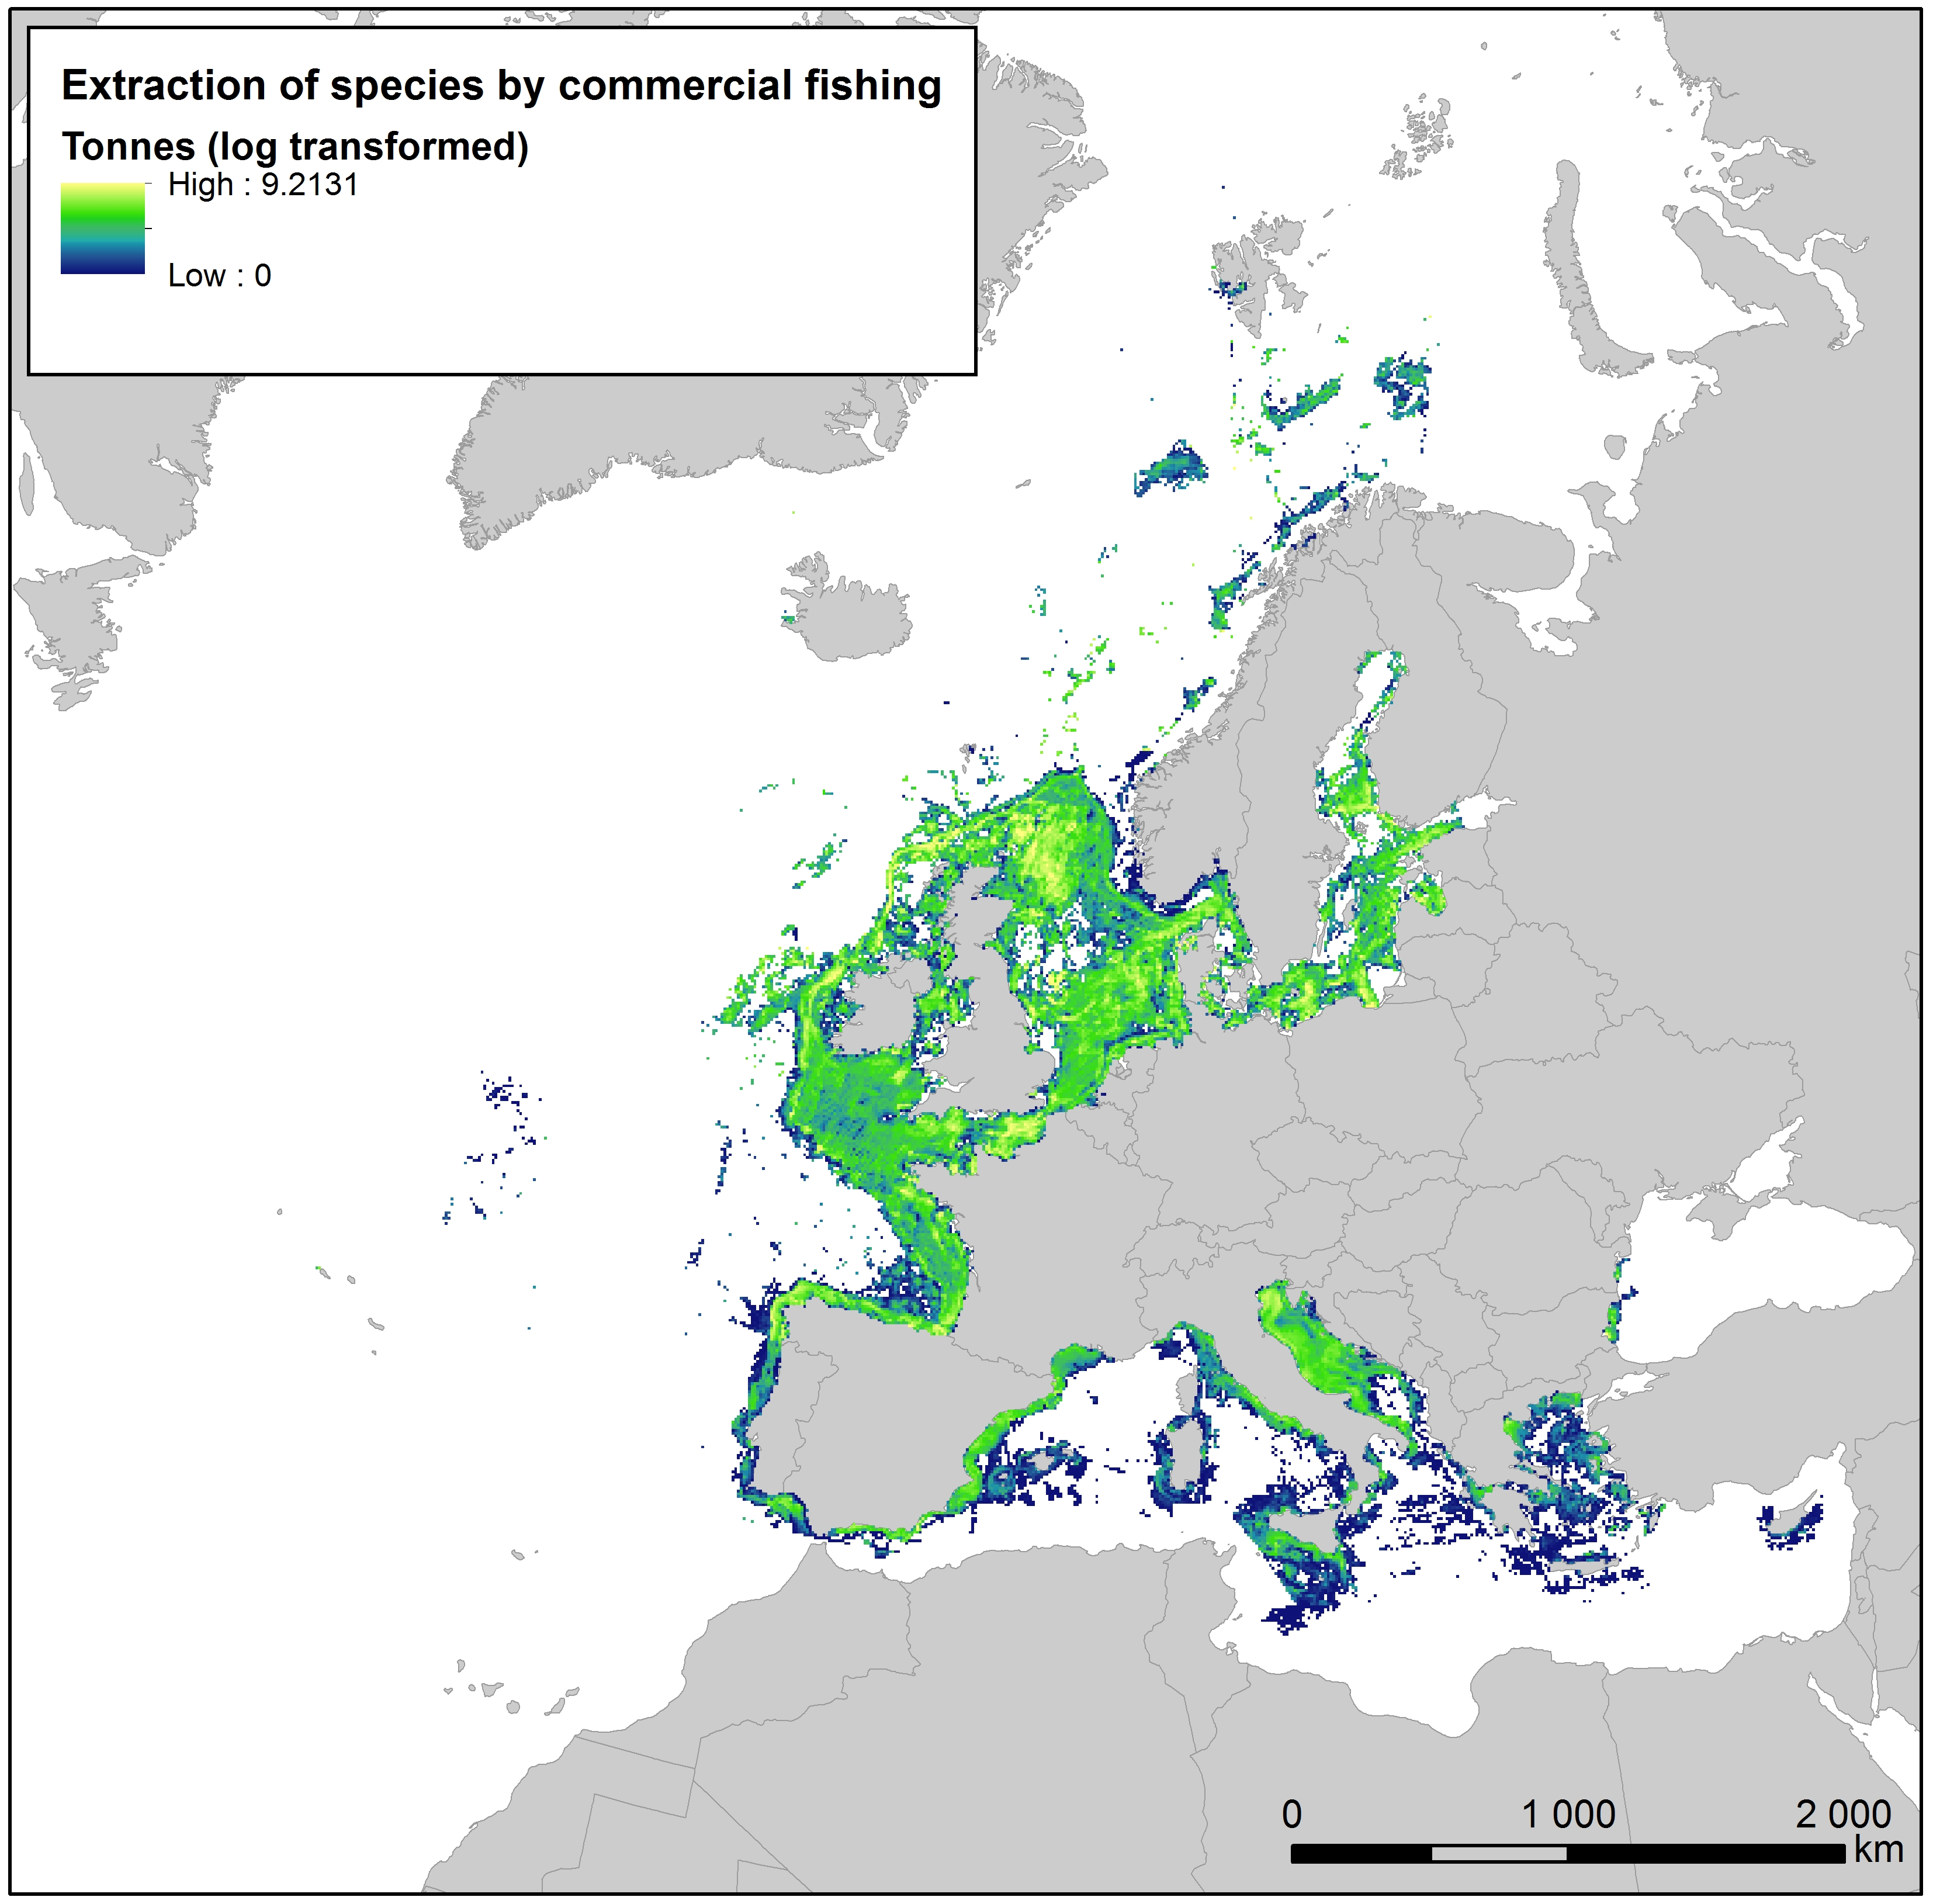
This raster dataset provides the estimation of the extracted tonnes of fish by commercial fishing per 10 km grid cell in the European seas. The dataset has been derived from the combination of demersal and pelagic fishing data, together with fish landings data (2011-2016) from the European Commission’s Joint Research Centre - Independent experts of the Scientific, Technical and Economic Committee for Fisheries (JRC STECF). The temporal extent varies between the data sources. The cell values have been transformed to a logarithmic scale (ln1). This dataset has been prepared for the calculation of the combined effect index, produced for the ETC/ICM Report 4/2019 "Multiple pressures and their combined effects in Europe's seas" available on: https://www.eionet.europa.eu/etcs/etc-icm/etc-icm-report-4-2019-multiple-pressures-and-their-combined-effects-in-europes-seas-1.
-
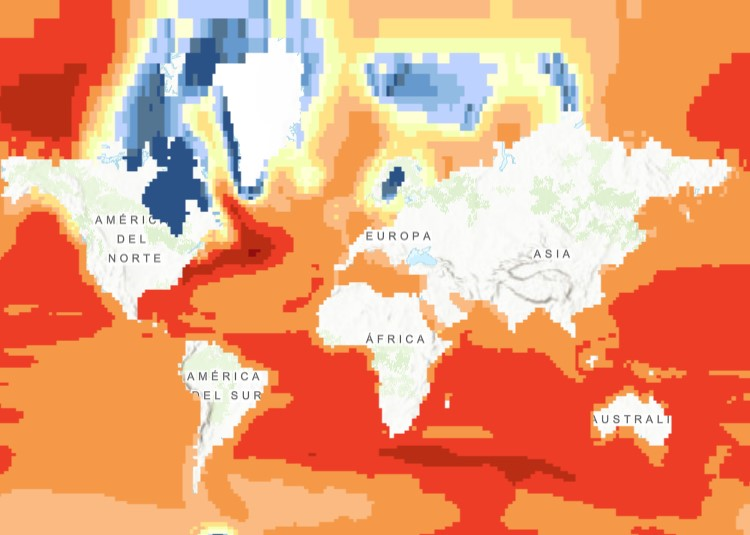
The raster dataset (1ºx1º) shows the projected change in relative sea level (in metres) in 2081-2100 compared to 1986-2005 for the medium-low emission scenario RCP4.5, based on an ensemble of Coupled Model Intercomparison Project Phase 5 (CMIP5) climate models. Projections consider land movement due to glacial isostatic adjustment but not land subsidence due to human activities. No projections are available for the Black Sea. The dataset has been used as a source for an earlier version of the EEA indicator “Global and European Sea Level”: https://www.eea.europa.eu/data-and-maps/indicators/sea-level-rise-5/assessment.
-
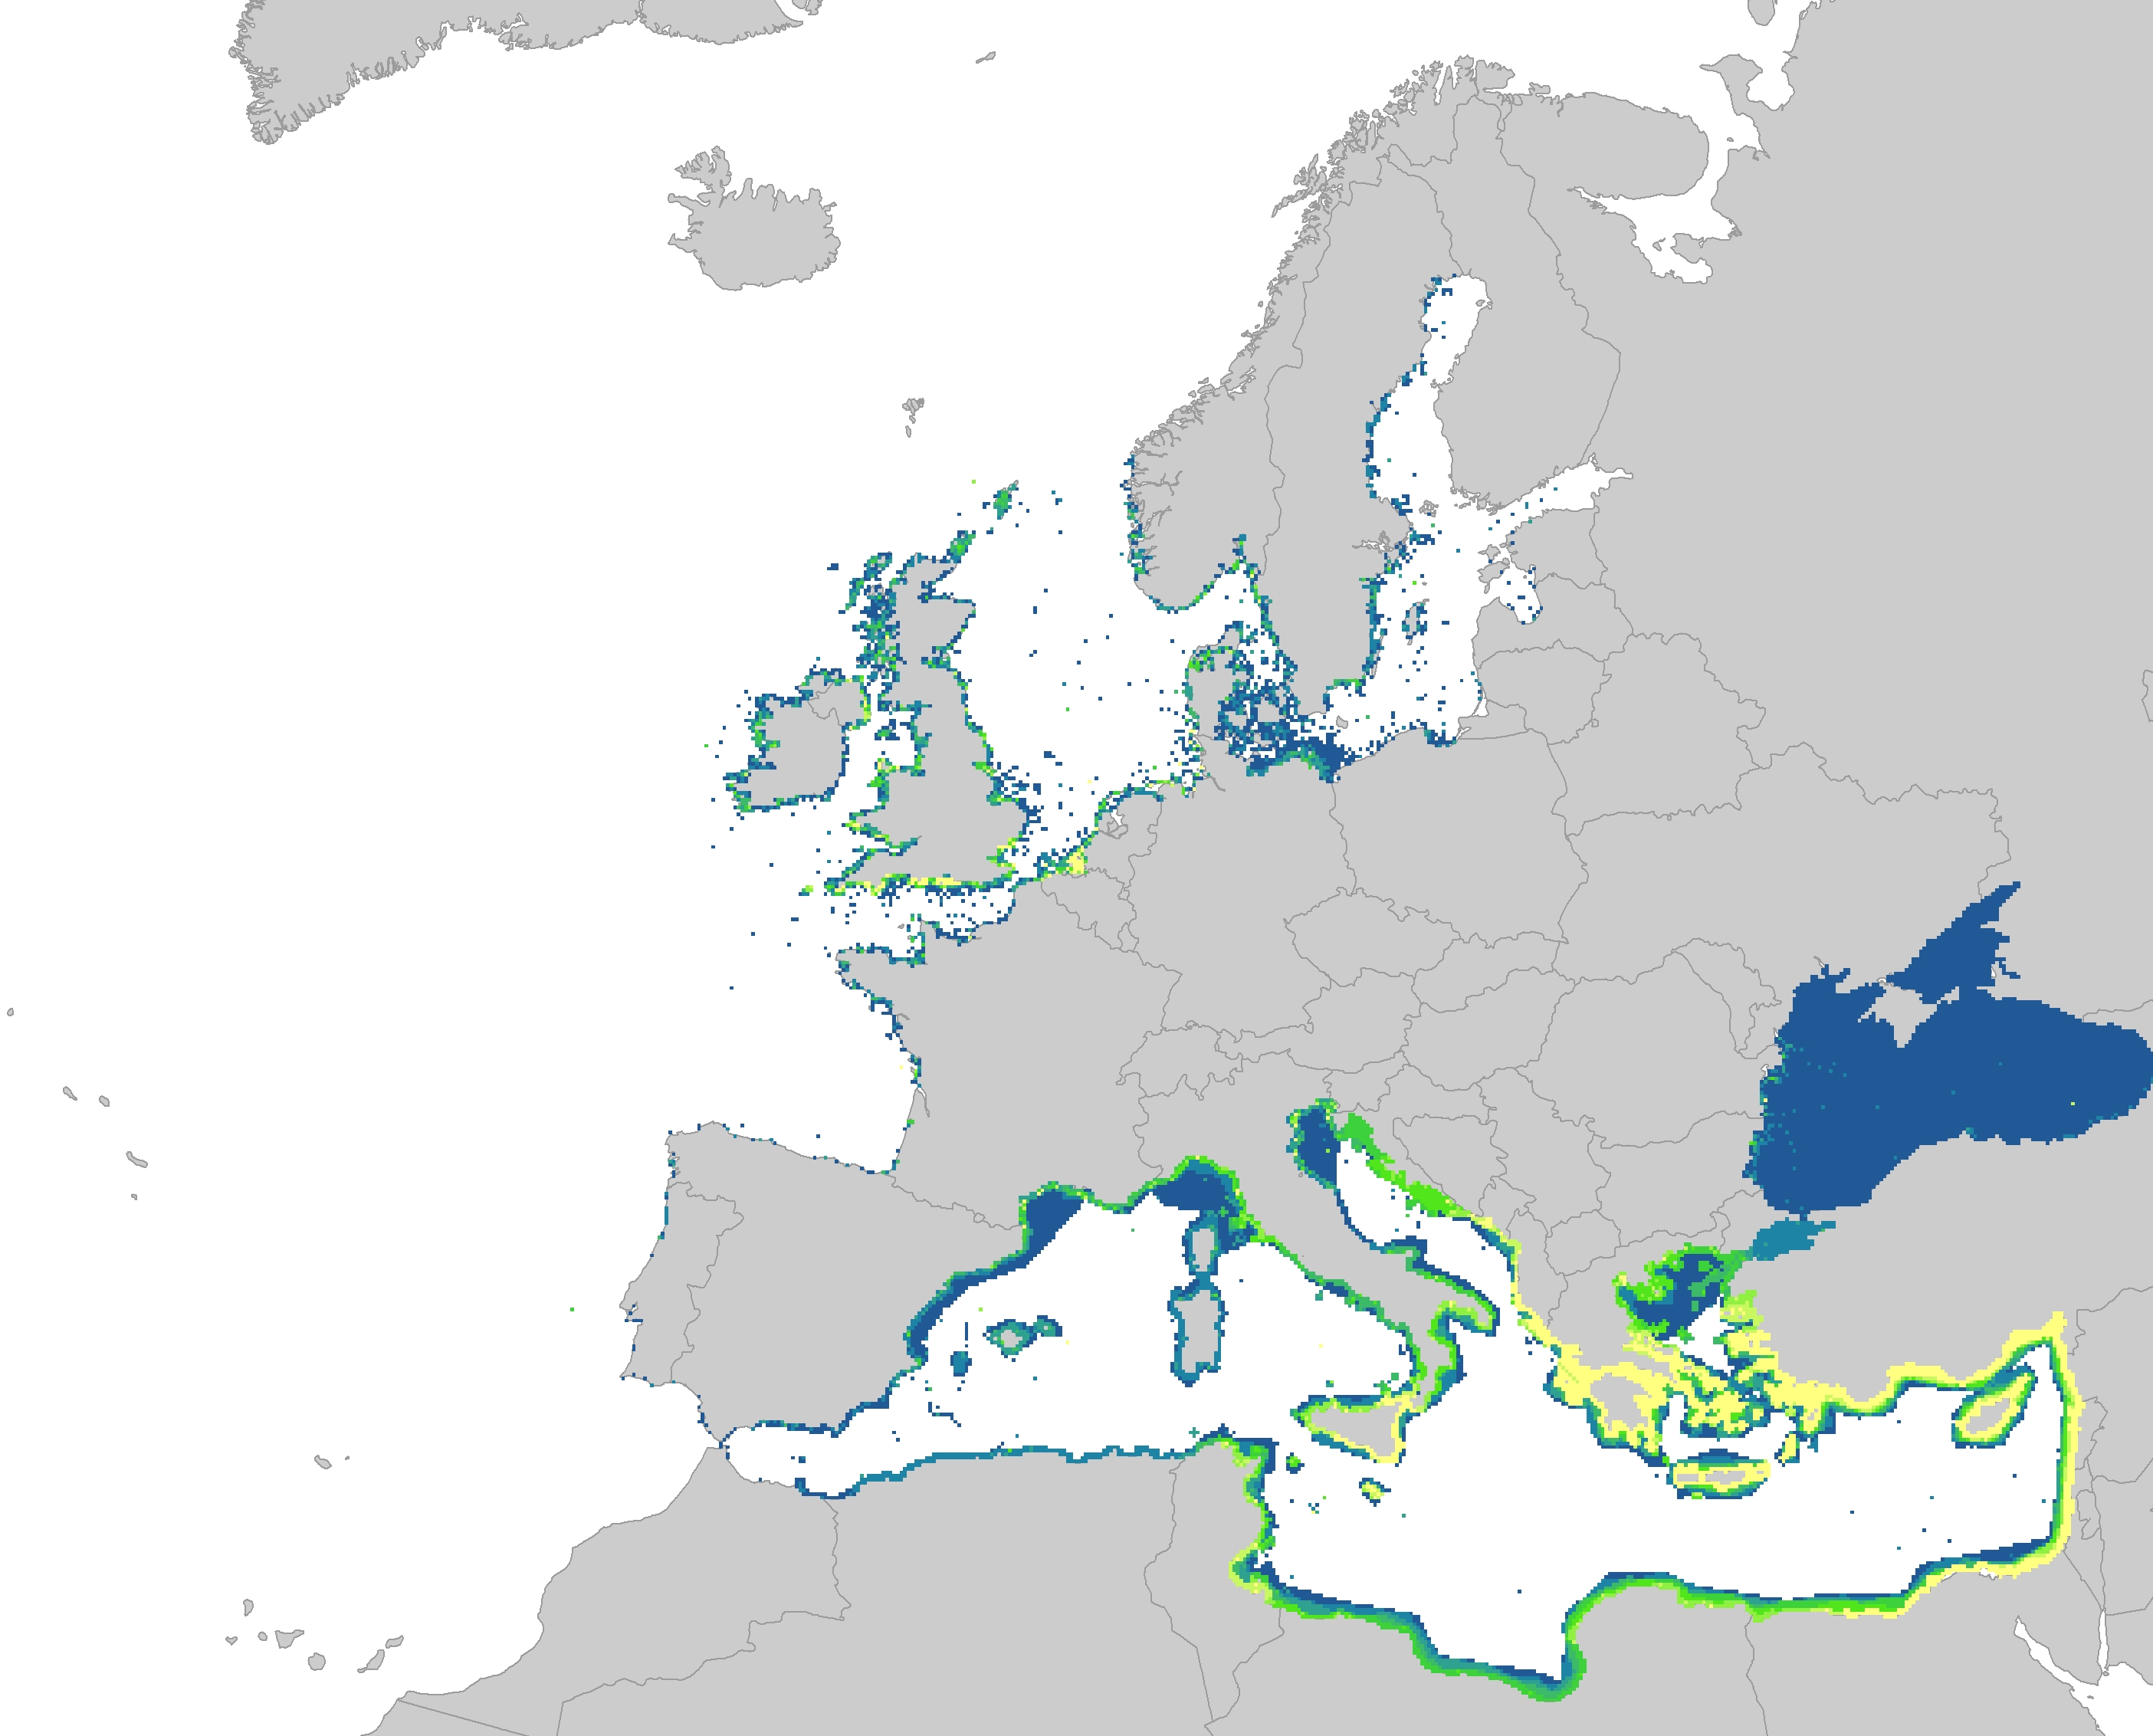
The dataset represents the introduction of non-indigenous species in European seas. Non-indigenous species are species that have been spread as a result of human activities to areas where they do not belong naturally. The main concern are the invasive species, which are defined as causing a significant negative impact on biodiversity as well as serious economic and social consequences. The dataset has been prepared first by individually mapping each aquatic invasive species that had a distinctive distribution area, which had been provided by several non-indigenous species online databases. The distribution of the species were then resampled into the EEA 10 km grid and summed together, showing the number of non-indigenous species per grid cell. The temporal reference of the dataset covers the last 30 years (1989 - 2018). This dataset has been prepared for the calculation of the combined effect index, produced for the ETC/ICM Report 4/2019 "Multiple pressures and their combined effects in Europe's seas" available on: https://www.eionet.europa.eu/etcs/etc-icm/etc-icm-report-4-2019-multiple-pressures-and-their-combined-effects-in-europes-seas-1.
-
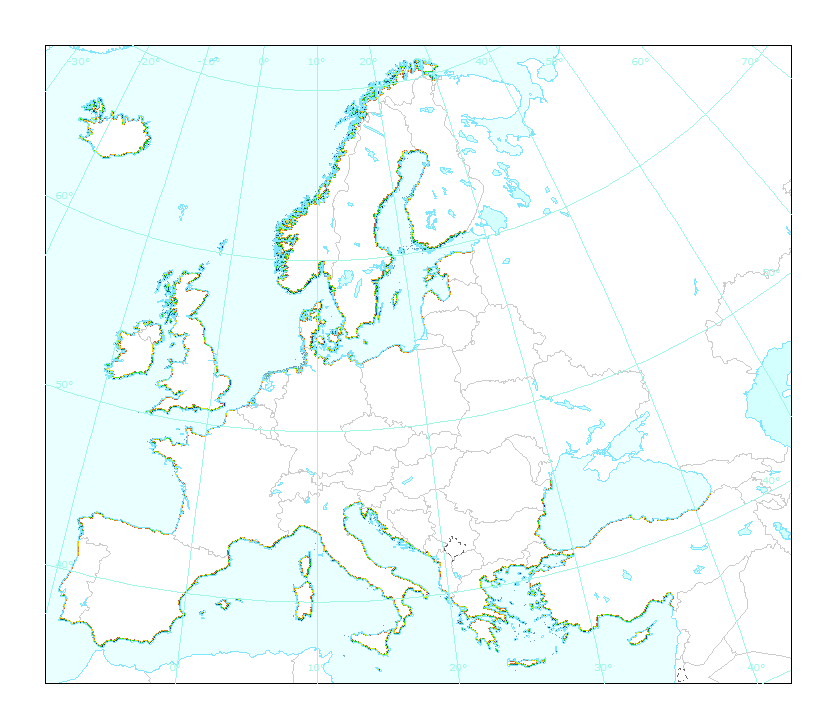
Coastal zones are presented as a series of 10 consecutive buffers of 1km width each (towards inland). For this dataset, were treated as sea data all areas with class values of 52x (521: coastal lagoons, 522: estuaries, 523: sea and ocean) in Corine Land Cover (details in lineage).
-
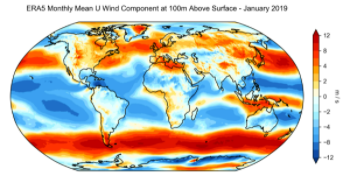
ERA5 is the fifth generation ECMWF reanalysis for the global climate and weather for the past 4 to 7 decades. Currently data is available from 1950, split into Climate Data Store entries for 1950-1978 (preliminary back extension) and from 1979 onwards (final release plus timely updates, this page). ERA5 replaces the ERA-Interim reanalysis. Reanalysis combines model data with observations from across the world into a globally complete and consistent dataset using the laws of physics. This principle, called data assimilation, is based on the method used by numerical weather prediction centres, where every so many hours (12 hours at ECMWF) a previous forecast is combined with newly available observations in an optimal way to produce a new best estimate of the state of the atmosphere, called analysis, from which an updated, improved forecast is issued. Reanalysis works in the same way, but at reduced resolution to allow for the provision of a dataset spanning back several decades. Reanalysis does not have the constraint of issuing timely forecasts, so there is more time to collect observations, and when going further back in time, to allow for the ingestion of improved versions of the original observations, which all benefit the quality of the reanalysis product. ERA5 provides hourly estimates for a large number of atmospheric, ocean-wave and land-surface quantities. An uncertainty estimate is sampled by an underlying 10-member ensemble at three-hourly intervals. Ensemble mean and spread have been pre-computed for convenience. Such uncertainty estimates are closely related to the information content of the available observing system which has evolved considerably over time. They also indicate flow-dependent sensitive areas. To facilitate many climate applications, monthly-mean averages have been pre-calculated too, though monthly means are not available for the ensemble mean and spread. ERA5 is updated daily with a latency of about 5 days (monthly means are available around the 6th of each month). In case that serious flaws are detected in this early release (called ERA5T), this data could be different from the final release 2 to 3 months later. So far this has not been the case and when this does occur users will be notified. The data set presented here is a regridded subset of the full ERA5 data set on native resolution. It is online on spinning disk, which should ensure fast and easy access. It should satisfy the requirements for most common applications. An overview of all ERA5 datasets can be found in this article. Information on access to ERA5 data on native resolution is provided in these guidelines. Data has been regridded to a regular lat-lon grid of 0.25 degrees for the reanalysis and 0.5 degrees for the uncertainty estimate (0.5 and 1 degree respectively for ocean waves). There are four main sub sets: hourly and monthly products, both on pressure levels (upper air fields) and single levels (atmospheric, ocean-wave and land surface quantities). The present entry is "ERA5 monthly mean data on single levels from 1979 to present".
-
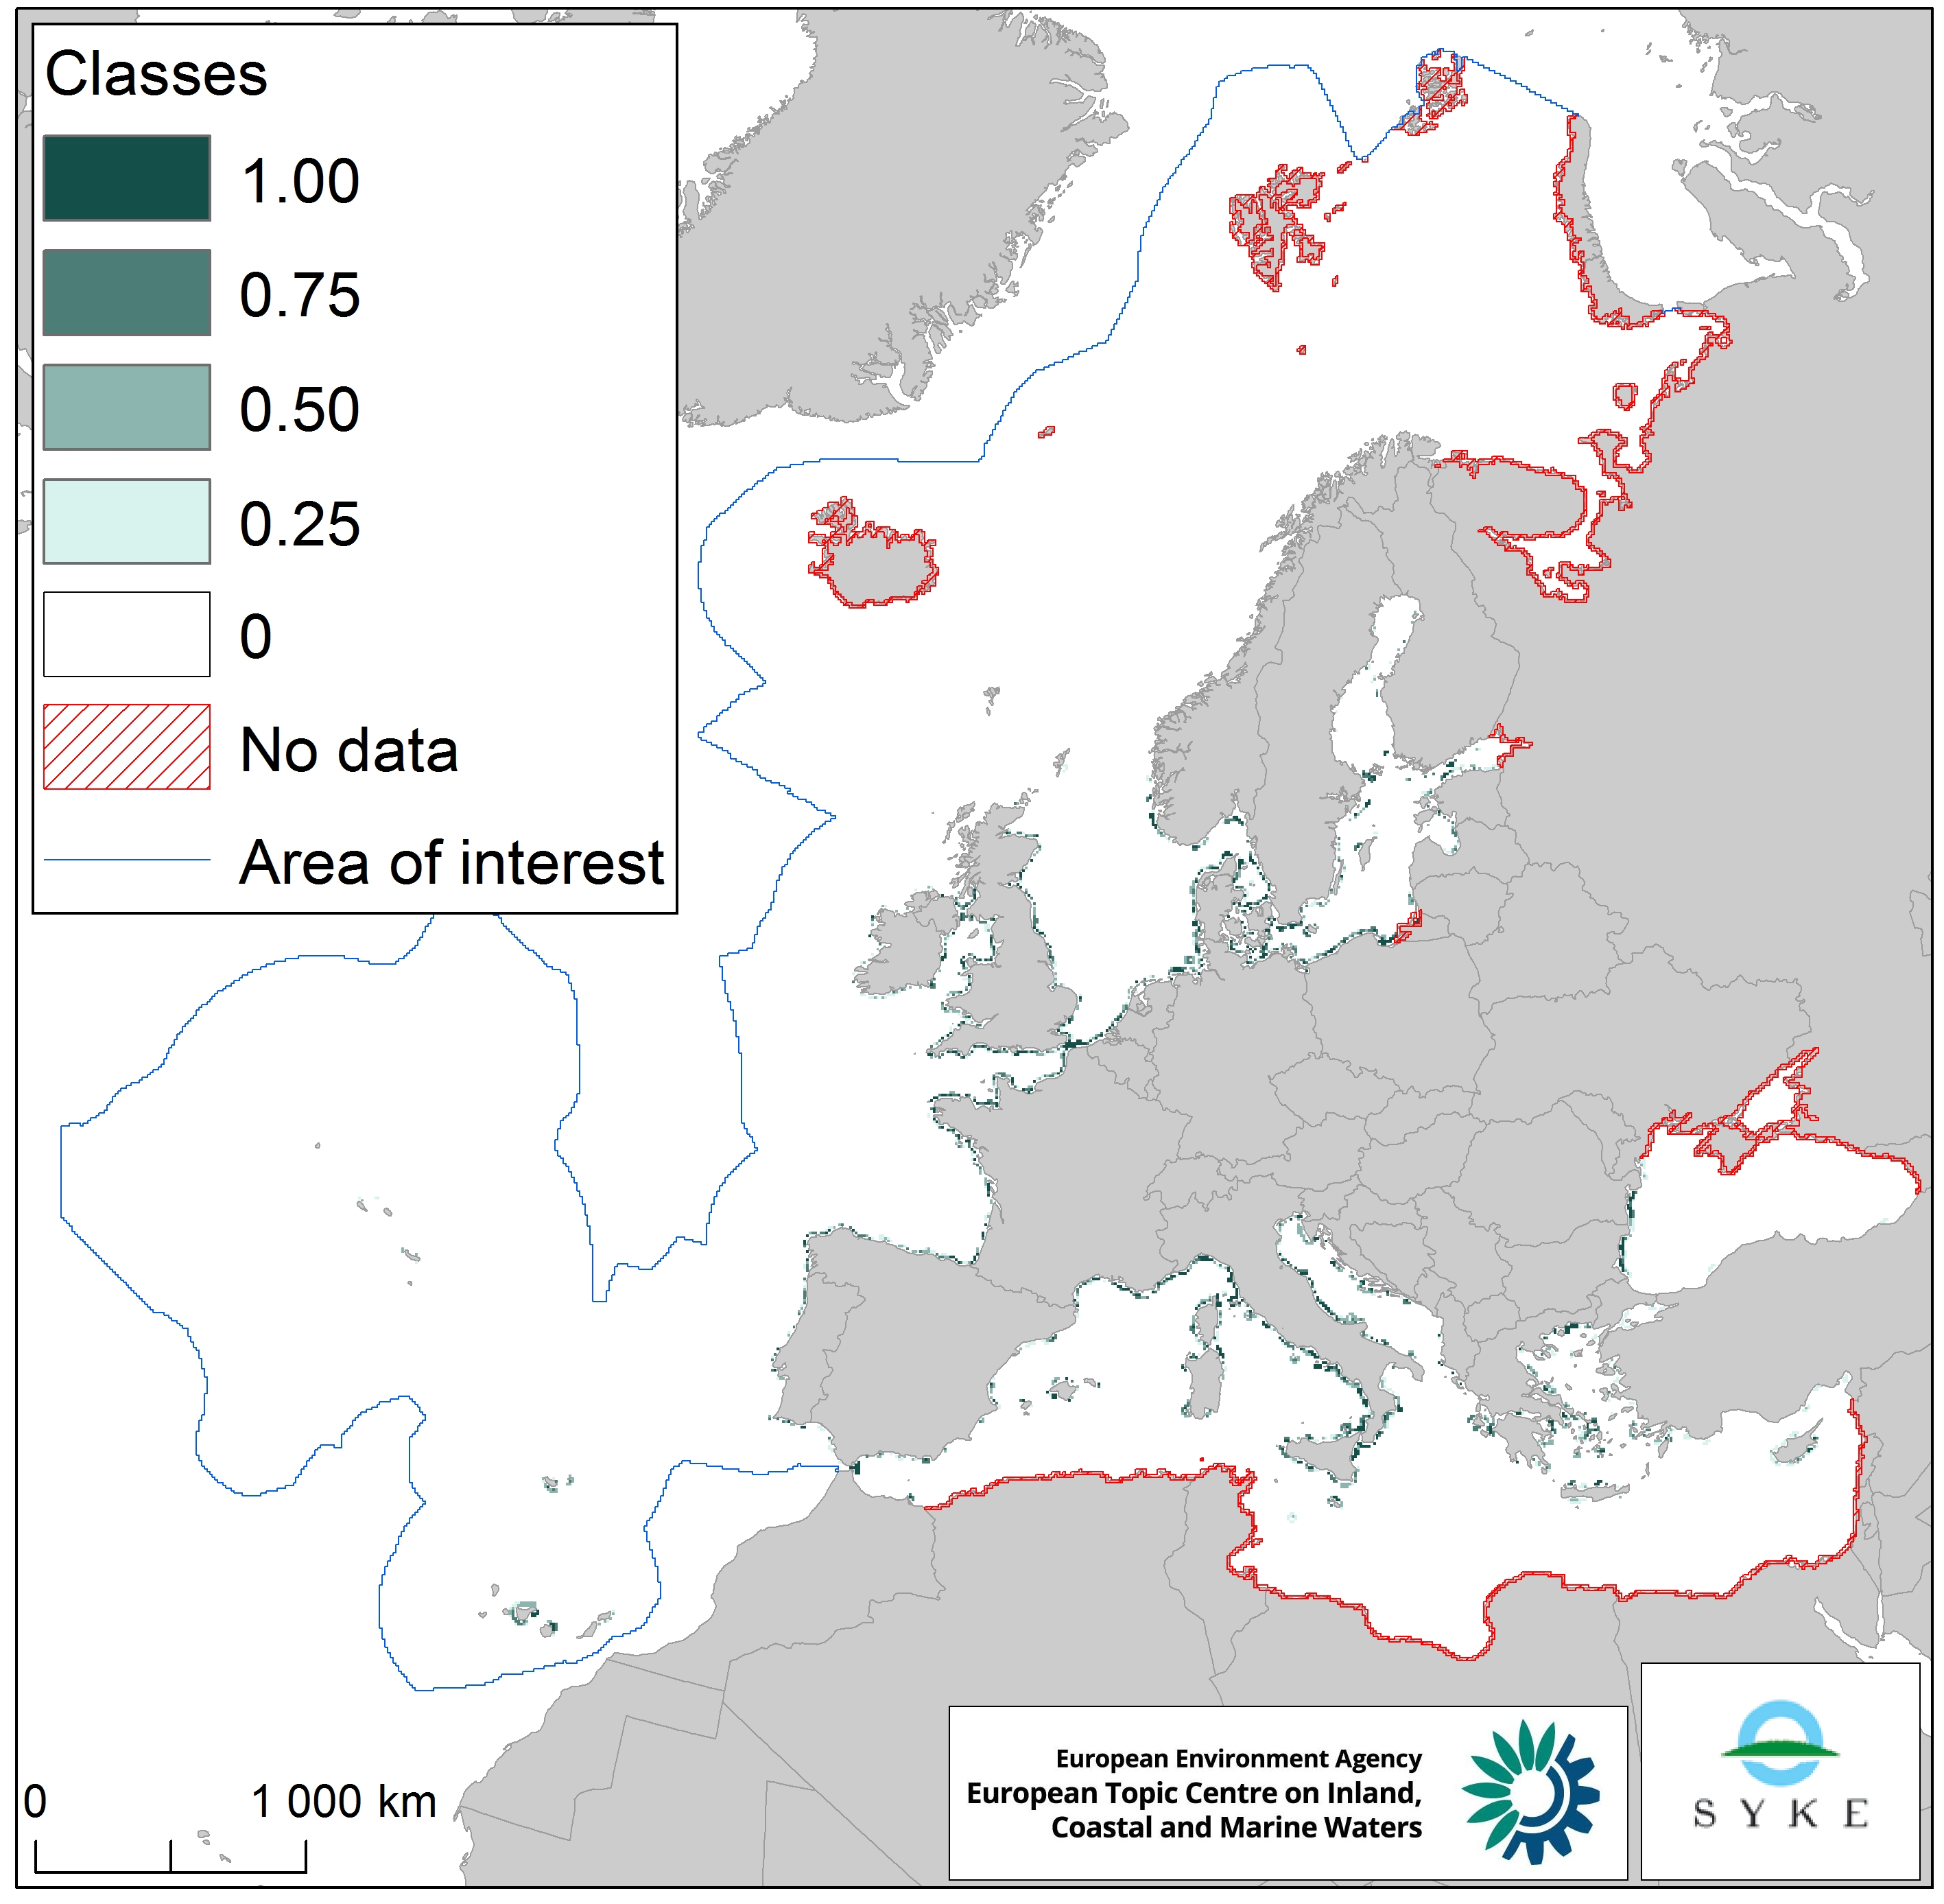
This raster dataset represents the input of microbial pathogens along the European coastlines. The pressure layer was created using three different datasets rasterized using the EEA 10 km grid: urban agglomerations reported under the Urban Waste Water Treatment Directive (2017), EMODnet dataset of ports lying on the sea coast together with passenger information (annual average 2006-2016) and Intestinal enterococci and Escherichia coli data at bathing sites as measured under the Bathing Water Directive reporting obligation (average 2008-2016). All three datasets were then classified into four classes, aggregated and classified again (quantile classes between 0 and 1, with the latter being the highest pathogen pressure). This dataset has been prepared for the calculation of the combined effect index, produced for the ETC/ICM Report 4/2019 "Multiple pressures and their combined effects in Europe's seas" available on: https://www.eionet.europa.eu/etcs/etc-icm/etc-icm-report-4-2019-multiple-pressures-and-their-combined-effects-in-europes-seas-1.