 Catalogue PIGMA
WP5 Assessing state, drivers and tipping points
Type of resources
Available actions
Topics
Keywords
Contact for the resource
Provided by
Years
Formats
Representation types
Update frequencies
status
Resolution
-
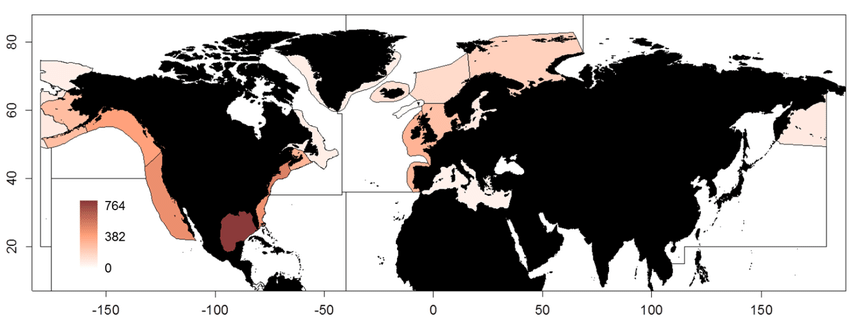
This dataset containing traits of marine fish is based on fish taxa observed during international scientific bottom-trawl surveys regularly conducted in the Northeast Atlantic, Northwest Atlantic and the Northeast Pacific. These scientific surveys target primarily demersal (bottom-dwelling) fish species, but pelagic species are also regularly recorded. The overarching aim of this dataset was to collect information on ecological traits for as many fish taxa as possible and to find area-specific trait values to account for intraspecific variation in traits, especially for widely distributed species. We collected traits for species, genera and families. The majority of trait values were sourced from FishBase (Froese and Pauly, 2019), and have been supplemented with values from the primary literature.
-
Assessments run at AFWG provide the scientific basis for the management of cod, haddock, saithe, redfish, Greenland halibut and capelin in subareas 1 and 2. Taking the catch values provided by the Norwegian fisheries ministry for Norwegian catches1 and raising the total landed value to the total catches gives an approximate nominal first-hand landed value for the combined AFWG stocks of ca. 20 billion NOK or ca. 2 billion EUR (2018 estimates).
-
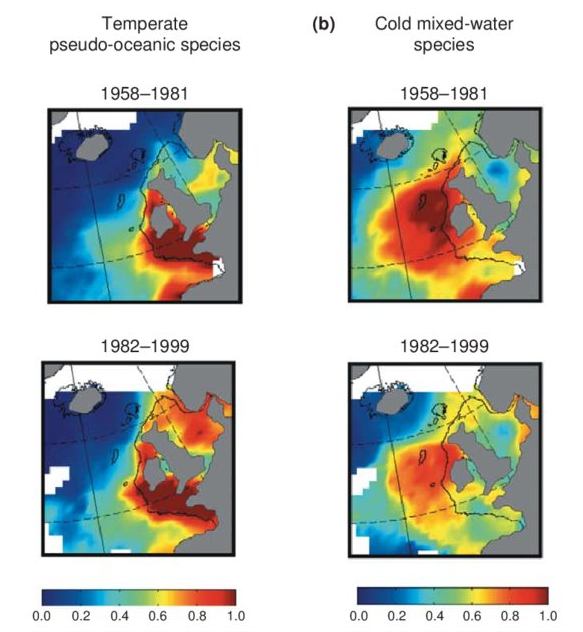
Excel file containing CPR data from Standard Areas B4,C3,C4,D3,D4,D5,E4,F4 for the plankton Calanus finmarchicus and helgolandicus, total traverse (small) copepods, total large copepods, Phytoplankton Colour Index and Cnidaria (presence denoted by a 1, absence by a zero). All taxa are from 1980, except Cnidaria which are from 2011. Dataset is in the format of sample level data, with each row being a discrete sample, with a sample being 3m3 filtered seawater, and 10nm of tow. For each row, a sample has the following information, starting at column a: Standard area of sample, sample id, latitude (decimal degrees) of sample mid point, longitude (decimal degrees) of sample midpoint, sample midpoint date and local time, year of sample, month of sample, then plankton abundance values (or PCI index or cnidaria presence/absence). All taxa have been looked for during the period this dataset spans, so zero values represent true absence.
-
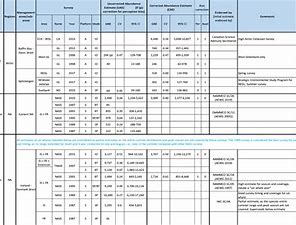
The purpose of this table is to present the best available abundance estimates for cetacean species in areas of relevance to the work of NAMMCO. It is intended to be used as a starting point for researchers, and the original sources are provided if additional information is required. The Scientific Committee of NAMMCO maintains a Working Group on Abundance Estimates, composed of invited experts in the field as well as some Committee members. This Working Group meets periodically to review new abundance estimates from recent surveys or, in some cases, re-analyses of older data. The reports of the Working Group are brought to the Scientific Committee at their annual meetings, and used to formulate advice on stock status, allowable removals or other matters. In most cases, the Scientific Committee will formally endorse estimates approved by the Working Group, and if so, this is indicated on the Table. Some estimates have been endorsed by the Scientific Committee of the International Whaling Commission (IWC).
-

We assembled a dataset of 14C-based productivity measurements to understand the critical variables required for accurate assessment of daily depth-integrated phytoplankton carbon fixation (PP(PPeu)u) from measurements of sea surface pigment concentrations (Csat)(Csat). From this dataset, we developed a light-dependent, depth-resolved model for carbon fixation (VGPM) that partitions environmental factors affecting primary production into those that influence the relative vertical distribution of primary production (Pz)z) and those that control the optimal assimilation efficiency of the productivity profile (P(PBopt). The VGPM accounted for 79% of the observed variability in Pz and 86% of the variability in PPeu by using measured values of PBopt. Our results indicate that the accuracy of productivity algorithms in estimating PPeu is dependent primarily upon the ability to accurately represent variability in Pbopt. We developed a temperature-dependent Pbopt model that was used in conjunction with monthly climatological images of Csat sea surface temperature, and cloud-corrected estimates of surface irradiance to calculate a global annual phytoplankton carbon fixation (PPannu) rate of 43.5 Pg C yr‒1. The geographical distribution of PPannu was distinctly different than results from previous models. Our results illustrate the importance of focusing Pbopt model development on temporal and spatial, rather than the vertical, variability.
-
The principal component (PC)-based indices of the North Atlantic Oscillation (NAO) are the time series of the leading Empirical Orthogonal Function (EOF) of SLP anomalies over the Atlantic sector, 20°-80°N, 90°W-40°E. These indices are used to measure the NAO throughout the year, tracking the seasonal movements of the Icelandic low and Azores high. These movements are illustrated in the Figures on this page. Positive values of the NAO index are typically associated with stronger-than-average westerlies over the middle latitudes, more intense weather systems over the North Atlantic and wetter/milder weather over western Europe.
-
Stakeholder networks from 32 countries united to collaborate on Ocean Action, Climate Action, addressing pollution from land-based, riverine and marine-based sources and advancing Circular Economy development. International Waste Platform provides international expertise and launches joint initiatives; It supports advancing solutions to mitigate the global waste, plastic pollution & climate crises which are interlinked. Representatives committed themselves to align objectives, to support the implementation of strategies of Ocean Action and Climate Action, as well as to share ideas, best practices, concepts, programs, knowledge and opportunities; including the reduction of plastic debris at the source, before it enters rivers and the coastal environment. Country / regional networks and national marine debris networks make a difference in societal behaviour change and environmental policies by providing input and promoting action which aims at finding solutions to reduce (ocean) plastic pollution. Country and regional networks are instrumental to reach the prevention and reduction of marine pollution, facilitate and foster the establishment of national and international partnerships in a multi-stakeholder approach.
-
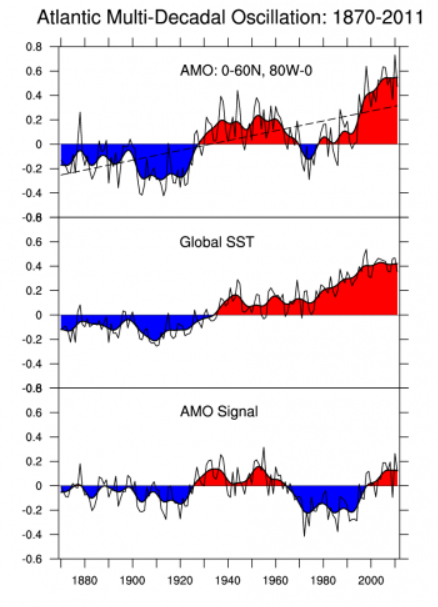
The Atlantic Multi-decadal Oscillation (AMO) has been identified as a coherent mode of natural variability occurring in the North Atlantic Ocean with an estimated period of 60-80 years. It is based upon the average anomalies of sea surface temperatures (SST) in the North Atlantic basin, typically over 0-80N. To remove the climate change signal from the AMO index, users typically detrend the SST data at each gridpoint or detrend the spatially averaged time series. Trenberth and Shea (2006) recommend that the detrending be done by subtracting the global-mean SST anomaly time series from the spatially averaged time series. See the Expert Guidance by Dr. Kevin Trenberth for the rationale for the global-mean detrending approach. The Expert Guidance by Dr. Rong Zhang discusses the impacts and mechanisms of the AMO.
-
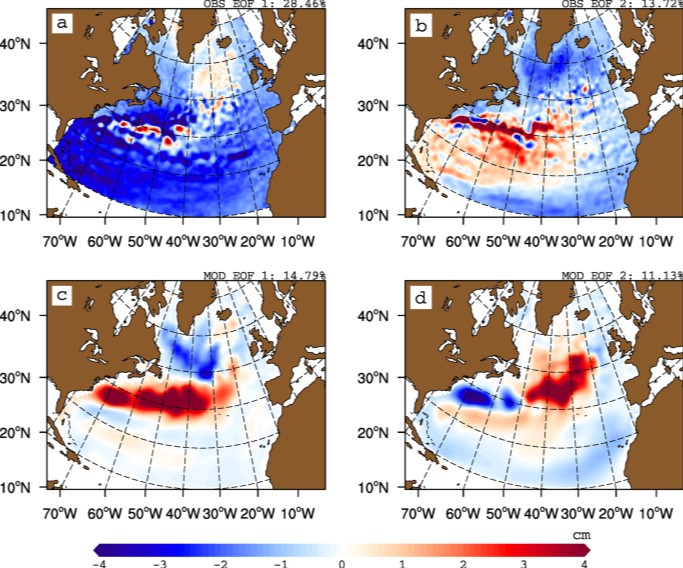
The gyre index constructed here from satellite altimetry is related to core aspects of the North Atlantic subpolar gyre, meridional overturning circulation, hydrographic properties in the Atlantic inflows toward the Arctic, and in marine ecosystems in the northeast Atlantic Ocean. The data series spans the period January 1993 to September 2018. Data description: Monthly gyre index from January 1993 until September 2018. The data is provided in one comma separated value (csv) file with the following entries on each row: year, month, index value. The index is normalized, i.e. it has a zero mean and unit standard deviation. Positive (negative) gyre index reflects stronger (weaker) than average surface circulation of the North Atlantic subpolar gyre.
-

This is the FAO Fishery and Aquaculture Reference Data repository: Codes and reference data for fishing gear, species, currencies, commodities, countries and others.