 Catalogue PIGMA
WP5 Assessing state, drivers and tipping points
Type of resources
Available actions
Topics
Keywords
Contact for the resource
Provided by
Years
Formats
Representation types
Update frequencies
status
Resolution
-
Assessments run at AFWG provide the scientific basis for the management of cod, haddock, saithe, redfish, Greenland halibut and capelin in subareas 1 and 2. Taking the catch values provided by the Norwegian fisheries ministry for Norwegian catches1 and raising the total landed value to the total catches gives an approximate nominal first-hand landed value for the combined AFWG stocks of ca. 20 billion NOK or ca. 2 billion EUR (2018 estimates).
-
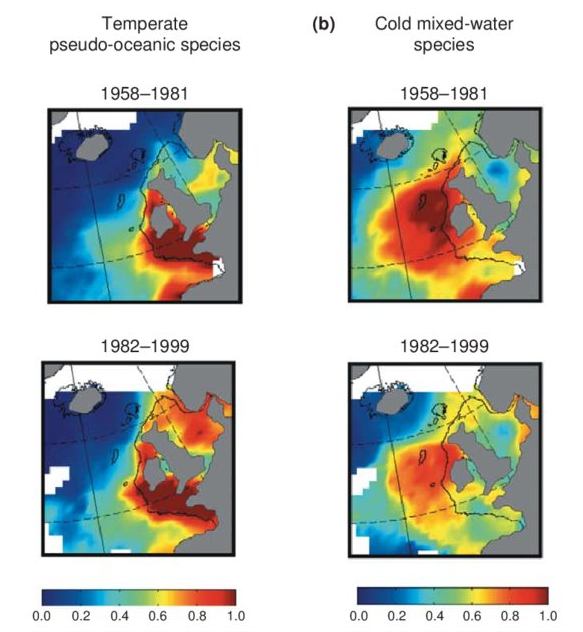
Excel file containing CPR data from Standard Areas B4,C3,C4,D3,D4,D5,E4,F4 for the plankton Calanus finmarchicus and helgolandicus, total traverse (small) copepods, total large copepods, Phytoplankton Colour Index and Cnidaria (presence denoted by a 1, absence by a zero). All taxa are from 1980, except Cnidaria which are from 2011. Dataset is in the format of sample level data, with each row being a discrete sample, with a sample being 3m3 filtered seawater, and 10nm of tow. For each row, a sample has the following information, starting at column a: Standard area of sample, sample id, latitude (decimal degrees) of sample mid point, longitude (decimal degrees) of sample midpoint, sample midpoint date and local time, year of sample, month of sample, then plankton abundance values (or PCI index or cnidaria presence/absence). All taxa have been looked for during the period this dataset spans, so zero values represent true absence.
-
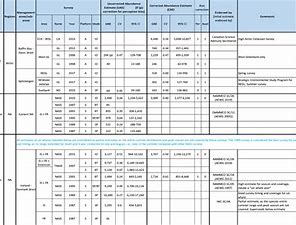
The purpose of this table is to present the best available abundance estimates for cetacean species in areas of relevance to the work of NAMMCO. It is intended to be used as a starting point for researchers, and the original sources are provided if additional information is required. The Scientific Committee of NAMMCO maintains a Working Group on Abundance Estimates, composed of invited experts in the field as well as some Committee members. This Working Group meets periodically to review new abundance estimates from recent surveys or, in some cases, re-analyses of older data. The reports of the Working Group are brought to the Scientific Committee at their annual meetings, and used to formulate advice on stock status, allowable removals or other matters. In most cases, the Scientific Committee will formally endorse estimates approved by the Working Group, and if so, this is indicated on the Table. Some estimates have been endorsed by the Scientific Committee of the International Whaling Commission (IWC).
-
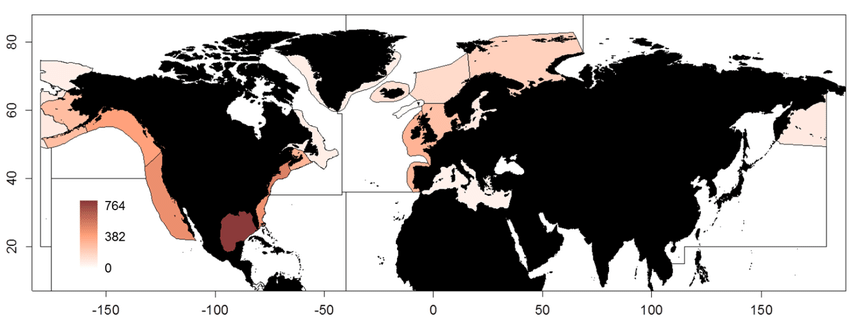
This dataset containing traits of marine fish is based on fish taxa observed during international scientific bottom-trawl surveys regularly conducted in the Northeast Atlantic, Northwest Atlantic and the Northeast Pacific. These scientific surveys target primarily demersal (bottom-dwelling) fish species, but pelagic species are also regularly recorded. The overarching aim of this dataset was to collect information on ecological traits for as many fish taxa as possible and to find area-specific trait values to account for intraspecific variation in traits, especially for widely distributed species. We collected traits for species, genera and families. The majority of trait values were sourced from FishBase (Froese and Pauly, 2019), and have been supplemented with values from the primary literature.
-
The principal component (PC)-based indices of the North Atlantic Oscillation (NAO) are the time series of the leading Empirical Orthogonal Function (EOF) of SLP anomalies over the Atlantic sector, 20°-80°N, 90°W-40°E. These indices are used to measure the NAO throughout the year, tracking the seasonal movements of the Icelandic low and Azores high. These movements are illustrated in the Figures on this page. Positive values of the NAO index are typically associated with stronger-than-average westerlies over the middle latitudes, more intense weather systems over the North Atlantic and wetter/milder weather over western Europe.
-

All statistics of UNCTAD are harmonized and integrated into UNCTADstat- free to use dissemination platform. It gives access to basic and derived indicators built upon common rules, harmonized environment and clear methodology supported by powerful data browsing system. The statistical series are regularly updated and classified into easy-to-navigate themes. UNCTADstat offers ready-to-use analytical groupings, with a unique coverage for countries and products and a particular focus on developing and transition economies. This approach ensures data consistency across multiple data series, and enables users to harness its full potential by mixing and matching data from various domains. The navigation browser allows table or graphic presentations, easy selection and reorganization of data, personalized functionalities and several straightforward extraction options.
-

The International Whaling Commission was set up under the International Convention for the Regulation of Whaling which was signed in Washington DC on 2nd December 1946. The preamble to the Convention states that its purpose is to provide for the proper conservation of whale stocks and thus make possible the orderly development of the whaling industry. The Commission undertakes extensive study and research on cetacean populations, develops and maintains scientific databases, and publishes its own peer reviewed scientific journal, the Journal of Cetacean Research and Management. A list of catches since the moratorium came into place (in the 1985/6 Antarctic Season) up to 2019 (download link).
-

The Commission for the Conservation Southern Bluefin Tuna collects a variety of data types from its Members and Cooperating Non-Members, including total catch, catch and effort data, and catch at size data. Catch, size and trade information is also collected through the Commission's Catch Documentation Scheme, Japanese import statistics, and other monitoring programs. Annual catches provided on this page are reported on a calendar year basis. CCSBT Members use quota years (not calendar years) for managing catching limits, but quota years differ between Members, so calendar years are used to provide catches on a common timescale. Relevant subsets and summaries of these data are provided below. All figures are subject to change as improved data or estimates become available. In particular, reviews of SBT data in 2006 indicated that southern bluefin tuna catches may have been substantially under-reported over the previous 10-20 years and the data presented here do not include estimates for this unreported catch. Also, data for the last reported year of catch (2020) are preliminary and are subject to revision. Any latitudes and longitudes presented in these summaries represent the north western corner of the relevant grid, which is a 5*5 grid unless otherwise specified. Other information on Members and Cooperating Non-Members fishing activities appears in the reports of the Extended Scientific Committee, Compliance Committee and Extended Commission.
-
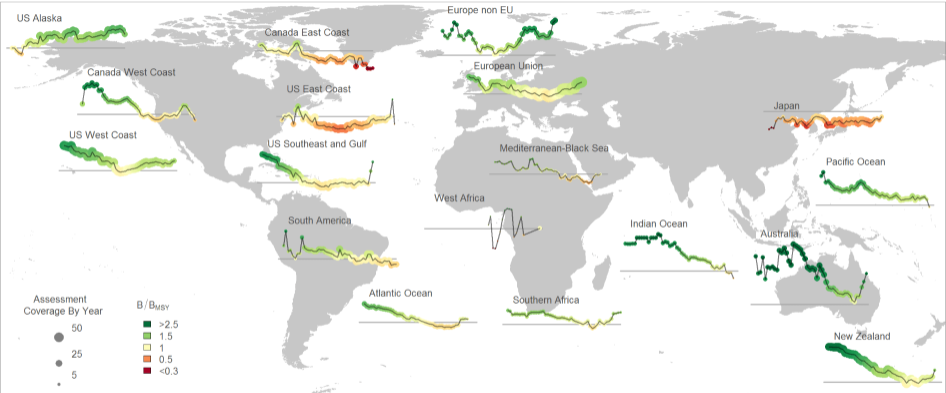
The RAM Legacy Stock Assessment Database is a compilation of stock assessment results for commercially exploited marine populations from around the world. The RAM Legacy Stock Assessment Database is grateful to the many stock assessment scientists whose work this database is based upon and the many collaborators who recorded the assessment model results for inclusion in the RAM Legacy Stock Assessment Database. Since 2011 the RAM Legacy Data base has been hosted and managed at the University of Washington with financial assistance from a consortium of Seattle-based seafood companies and organizations, and from the Walton Family Foundation. Initial development of the database from 2006-2010 was supported by the Census of Marine Life, Canadian Foundation for Innovation, NCEAS, NSERC, the Smith Conservation Research Fellowship, New Jersey Sea Grant, and the National Science Foundation.
-

This is the FAO Fishery and Aquaculture Reference Data repository: Codes and reference data for fishing gear, species, currencies, commodities, countries and others.