 Catalogue PIGMA
English Channel
Type of resources
Available actions
Topics
Keywords
Contact for the resource
Provided by
Years
Formats
Representation types
Update frequencies
status
Scale
Resolution
-
This dataset comprises energy density and proximal composition (water, ash, lipid and protein contents) for anchovy (Engraulis encrasicolus) and sardine (Sardina pilchardus) from the Bay of Biscay, the English Channel and the southern North Sea between 2014 and 2017. Fish were sampled throughout various seasons thanks to the PELGAS (May, Bay of Biscay), EVHOE (October-November, Bay of Biscay), CGFS and CAMANOC (September-October, English Channel) surveys conducted by IFREMER on the RV “Thalassa”, to the JUVENA (September-October, Bay of Biscay) survey conducted by AZTI, and from commercial landings within the European Data Collection Framework (DCF) during the CAPTAIN project (France Filière Pêche). During the surveys, pelagic (PELGAS and JUVENA) or demersal (EVHOE and CGFS) trawl hauls are undertaken to identify species and measure individual fish traits. Professional sampling was performed from pelagic trawl or purse-seine catches. From the various surveys, a sub-sampling of the trawls was performed to cover as much as possible the spatial extent of the surveys along the french coast. From the various selected trawls, a sub-sampling of 5 fish per size class (when possible) was performed to cover the size range of each species, based on the following size classes : sardine (1 : <15 cm ; 2 : 15-20 cm ; 3 : >20cm), anchovy (1 : <10cm ; 2 : 10-14 cm ; 3 : >14cm). Each fish was individually measured to the nearest tenth of a centimeter and weighted to the nearest tenth of a gram. These measurements were taken either at sea or later in the laboratory. The collected fish were frozen individually at -20°C before laboratory processing. In the laboratory, maturity stages were determined following ICES guidelines (ICES, 2008) based on macroscopic gonads observation and using a six-stage key as follows: stages 1 & 2 indicate immature and developing individuals, stages 3–5 indicate three steps of increasing gonad development and the spawning period (stage 3: partial pre-spawning; stage 4: spawning (hydrated); stage 5: partial post-spawning), and stage 6 features the final post-spawning period. Fish characterised by maturity stages 3, 4 or 5 were considered as being in an active reproductive period as opposed to fish in stages 1, 2 or 6. Fish were then ground and freeze-dried during at least 48 hours. Water content of the entire fish was determined from dry mass and wet mass ratio. Then, fish were ground again to obtain fine homogeneous dry powder for subsequent analysis. Energy density measurements were performed following the protocols of Gatti et al. (2018). Two subsamples of fish powder were placed in an adiabatic bomb calorimeter (IKA C-4000 adiabatic bomb calorimeter, IKA-WerkeGmbh & co. KG) for energy measurements. The energy density (ED, kJ.g-1 dry mass) was determined by measuring the heat released through the combustion of a small subsample, approximately 200 mg. If the coefficient of variation between the two measurements exceeded 3%, a third measurement was made. Finally, ED subsamples measurements were averaged and assigned to each individual fish. Energy density analyses were conducted on 503 individuals for anchovy and 976 individuals for sardine. Ash content was determined gravimetrically by combusting dried tissue in a muffle furnace at 550°C for six hours. Lipids and proteins were analysed by a certified laboratory (Labocea, Plouzané, France). Protein content was estimated using the Kjeldahl method. It consists in first determining the quantity of nitrogen contained in the sample, and to convert it into protein content using a conversion factor (6.25 here). Lipid content was determined by hydrolysis, using petroleum ether as an organic solvent. Carbohydrates represent less than 1% of fish mass and were thus neglected. Protein, lipid and ash content did not exactly sum to 1 in DW (anchovy: mean = 0.91, sd = 0.04; sardine: mean = 0.90, sd = 0.04). This discrepancy may arise from residual water, measurement uncertainties, or to a lesser extent the exclusion of carbohydrates. Body component contents have been normalised by dividing each component by the sum of lipids, proteins and ash content, to sum to one, enabling comparisons between fishes, assuming proportional errors across the components. A total of 116 and 104 proximate composition analyses were performed for anchovy and sardine, respectively.
-

The "EMODnet Digital Bathymetry (DTM) - 2016" is a multilayer bathymetric product for Europe’s sea basins covering:: • the Greater North Sea, including the Kattegat and stretches of water such as Fair Isle, Cromarty, Forth, Forties, Dover, Wight, and Portland • the English Channel and Celtic Seas • Western and Central Mediterranean Sea and Ionian Sea • Bay of Biscay, Iberian coast and North-East Atlantic • Adriatic Sea • Aegean - Levantine Sea (Eastern Mediterranean) • Azores - Madeira EEZ • Canary Islands • Baltic Sea • Black Sea • Norwegian – Icelandic seas The DTM is based upon more than 7700 bathymetric survey data sets and Composite DTMs that have been gathered from 27 data providers from 18 European countries and involving 169 data originators. The gathered survey data sets can be discovered and requested for access through the Common Data Index (CDI) data discovery and access service that also contains additional European survey data sets for global waters. The Composite DTMs can be discovered through the Sextant Catalogue service. Both discovery services make use of SeaDataNet standards and services and have been integrated in the EMODnet portal (https://emodnet.ec.europa.eu/en/bathymetry#bathymetry-services ). In addition, the EMODnet Map Viewer (https://emodnet.ec.europa.eu/geoviewer/ ) gives users wide functionality for viewing and downloading the EMODnet digital bathymetry such as: • water depth (refering to the Lowest Astronomical Tide Datum - LAT) in gridded form on a DTM grid of 1/8 * 1/8 arc minute of longitude and latitude (ca 230 * 230 meters) • option to view depth parameters of individual DTM cells and references to source data • option to download DTM in 16 tiles in different formats: EMO, EMO (without GEBCO data), ESRI ASCII, ESRI ASCII Mean Sea Level, XYZ, NetCDF (CF), RGB GeoTiff and SD • layer with a number of high resolution DTMs for coastal regions • layer with wrecks from the UKHO Wrecks database. The NetCDF (CF) DTM files are fit for use in a special 3D Viewer software package which is based on the existing open source NASA World Wind JSK application. It has been developed in the frame of the EU FP7 Geo-Seas project (another sibling of SeaDataNet for marine geological and geophysical data) and is freely available. The 3D viewer also supports the ingestion of WMS overlay maps. The SD files can also be used for 3D viewing by means of the freely available iView4De(Fledermaus) software. The original datasets themselves are not distributed but described in the metadata services, giving clear information about the background survey data used for the DTM, their access restrictions, originators and distributors and facilitating requests by users to originator.
-
The "EMODnet Digital Bathymetry (DTM) - 2016" is a multilayer bathymetric product for Europe’s sea basins covering:: • the Greater North Sea, including the Kattegat and stretches of water such as Fair Isle, Cromarty, Forth, Forties, Dover, Wight, and Portland • the English Channel and Celtic Seas • Western and Central Mediterranean Sea and Ionian Sea • Bay of Biscay, Iberian coast and North-East Atlantic • Adriatic Sea • Aegean - Levantine Sea (Eastern Mediterranean) • Azores - Madeira EEZ • Canary Islands • Baltic Sea • Black Sea • Norwegian – Icelandic seas The DTM is based upon more than 7700 bathymetric survey data sets and Composite DTMs that have been gathered from 27 data providers from 18 European countries and involving 169 data originators. The gathered survey data sets can be discovered and requested for access through the Common Data Index (CDI) data discovery and access service that also contains additional European survey data sets for global waters. This discovery service makes use of SeaDataNet standards and services and have been integrated in the EMODnet portal (https://emodnet.ec.europa.eu/en/bathymetry#bathymetry-services ). The Composite DTMs are described using the Sextant Catalogue Service that makes also use of SeaDataNet standards and services. Their metadata can retrieved through interrogating the Source Reference map in the Central Map Viewing service (https://emodnet.ec.europa.eu/geoviewer/ ). In addition, the EMODnet Map Viewer gives users wide functionality for viewing and downloading the EMODnet digital bathymetry such as: • water depth (refering to the Lowest Astronomical Tide Datum - LAT) in gridded form on a DTM grid of 1/8 * 1/8 arc minute of longitude and latitude (ca 230 * 230 meters) • option to view depth parameters of individual DTM cells and references to source data • option to download DTM in 16 tiles in different formats: EMO, EMO (without GEBCO data), ESRI ASCII, ESRI ASCII Mean Sea Level, XYZ, NetCDF (CF), RGB GeoTiff and SD • layer with a number of high resolution DTMs for coastal regions • layer with wrecks from the UKHO Wrecks database. The NetCDF (CF) DTM files are fit for use in a special 3D Viewer software package which is based on the existing open source NASA World Wind JSK application. It has been developed in the frame of the EU FP7 Geo-Seas project (another sibling of SeaDataNet for marine geological and geophysical data) and is freely available. The 3D viewer also supports the ingestion of WMS overlay maps. The SD files can also be used for 3D viewing by means of the freely available iView4De(Fledermaus) software. The original datasets themselves are not distributed but described in the metadata services, giving clear information about the background survey data used for the DTM, their access restrictions, originators and distributors and facilitating requests by users to originator.
-
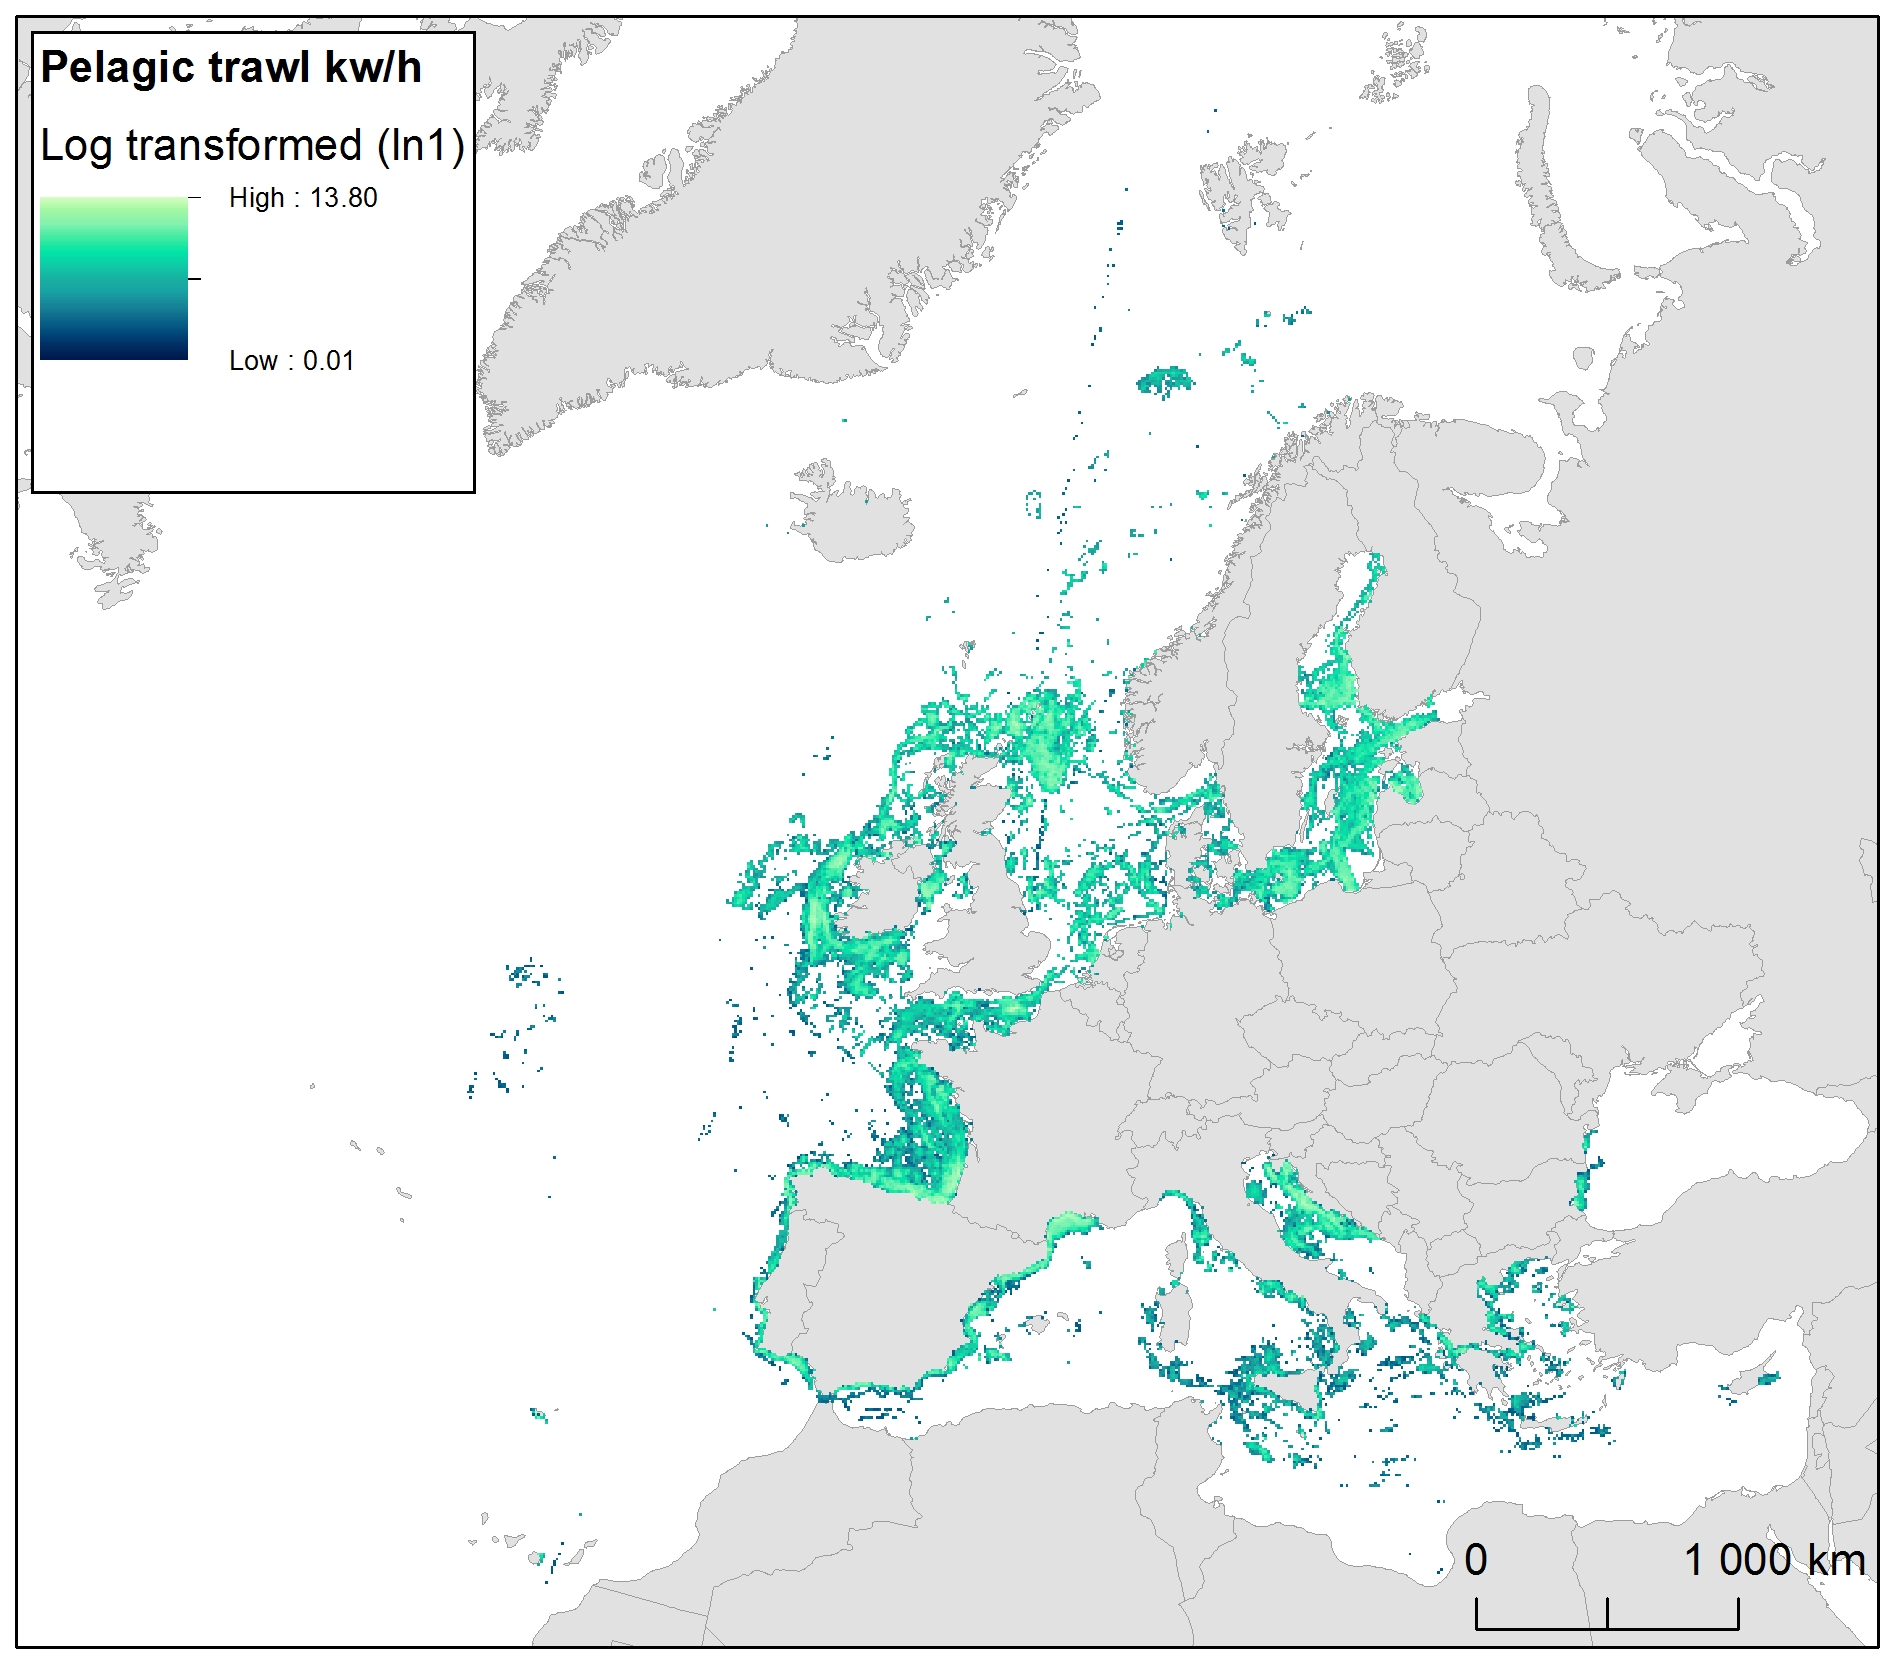
The raster dataset represents fishing intensity (kilowatt per fishing hour) by pelagic towed gears in the European seas. The dataset has been derived from Automatic Identification System (AIS) based pelagic fishing intensity data received from the European Commission’s Joint Research Centre - Independent experts of the Scientific, Technical and Economic Committee for Fisheries (JRC STECF), as well as from Vessel Monitoring System (VMS) and logbook based pelagic fishing effort data from HELCOM Commission. The temporal extent varies between the data sources (between 2013 and 2015). The dataset has been transformed to a logarithmic scale (ln1). This dataset has been prepared for the calculation of the combined effect index, produced for the ETC/ICM Report 4/2019 "Multiple pressures and their combined effects in Europe's seas" available on: https://www.eionet.europa.eu/etcs/etc-icm/etc-icm-report-4-2019-multiple-pressures-and-their-combined-effects-in-europes-seas-1.
-

This visualization product displays the density of floating micro-litter per net normalized per m³ per year from specific protocols different from research and monitoring protocols. EMODnet Chemistry included the collection of marine litter in its 3rd phase. Before 2021, there was no coordinated effort at the regional or European scale for micro-litter. Given this situation, EMODnet Chemistry proposed to adopt the data gathering and data management approach as generally applied for marine data, i.e., populating metadata and data in the CDI Data Discovery and Access service using dedicated SeaDataNet data transport formats. EMODnet Chemistry is currently the official EU collector of micro-litter data from Marine Strategy Framework Directive (MSFD) National Monitoring activities (descriptor 10). A series of specific standard vocabularies or standard terms related to micro-litter have been added to SeaDataNet NVS (NERC Vocabulary Server) Common Vocabularies to describe the micro-litter. European micro-litter data are collected by the National Oceanographic Data Centres (NODCs). Micro-litter map products are generated from NODCs data after a test of the aggregated collection including data and data format checks and data harmonization. A filter is applied to represent only micro-litter sampled according to a very specific protocol such as the Volvo Ocean Race (VOR) or Oceaneye. Densities were calculated for each net using the following calculation: Density (number of particles per m³) = Micro-litter count / Sampling effort (m³) When the number of micro-litters was not filled, it was not possible to calculate the density. Percentiles 50, 75, 95 & 99 have been calculated taking into account data for all years. Warning: the absence of data on the map does not necessarily mean that they do not exist, but that no information has been entered in the National Oceanographic Data Centre (NODC) for this area.
-
This visualization product displays the density of floating micro-litter per net normalized per km² per year from research and monitoring protocols. EMODnet Chemistry included the collection of marine litter in its 3rd phase. Before 2021, there was no coordinated effort at the regional or European scale for micro-litter. Given this situation, EMODnet Chemistry proposed to adopt the data gathering and data management approach as generally applied for marine data, i.e., populating metadata and data in the CDI Data Discovery and Access service using dedicated SeaDataNet data transport formats. EMODnet Chemistry is currently the official EU collector of micro-litter data from Marine Strategy Framework Directive (MSFD) National Monitoring activities (descriptor 10). A series of specific standard vocabularies or standard terms related to micro-litter have been added to SeaDataNet NVS (NERC Vocabulary Server) Common Vocabularies to describe the micro-litter. European micro-litter data are collected by the National Oceanographic Data Centres (NODCs). Micro-litter map products are generated from NODCs data after a test of the aggregated collection including data and data format checks and data harmonization. A filter is applied to represent only micro-litter sampled according to research and monitoring protocols as MSFD monitoring. Densities were calculated for each net using the following calculation: Density (number of particles per km²) = Micro-litter count / (Sampling effort (km) * Net opening (cm) * 0.00001) When the number of microlitters or the net opening was not filled, the density could not be calculated. Percentiles 50, 75, 95 & 99 have been calculated taking into account data for all years. Warning: the absence of data on the map doesn't necessarily mean that they don't exist, but that no information has been entered in the National Oceanographic Data Centre (NODC) for this area.
-
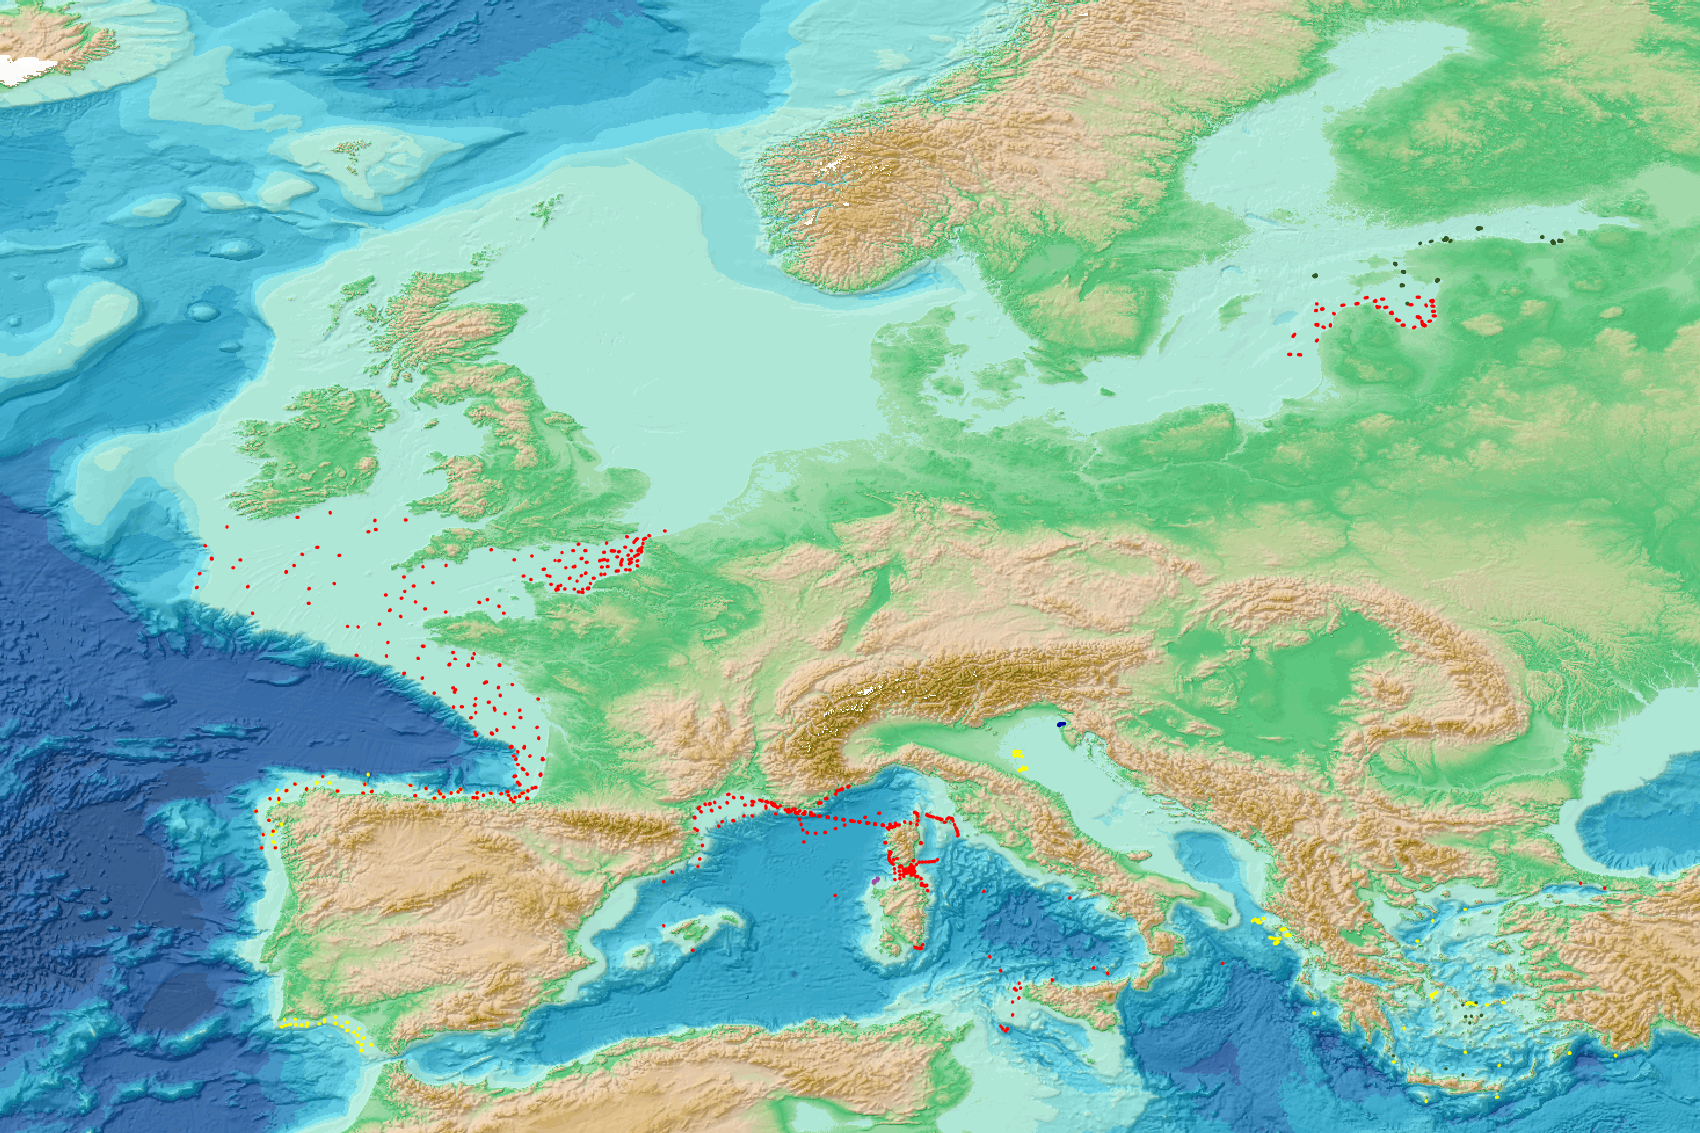
This visualization product displays nets locations where research and monitoring protocols have been applied to collate data on microlitter. Mesh size used with these protocols have been indicated with different colors in the map. EMODnet Chemistry included the collection of marine litter in its 3rd phase. Before 2021, there was no coordinated effort at the regional or European scale for micro-litter. Given this situation, EMODnet Chemistry proposed to adopt the data gathering and data management approach as generally applied for marine data, i.e., populating metadata and data in the CDI Data Discovery and Access service using dedicated SeaDataNet data transport formats. EMODnet Chemistry is currently the official EU collector of micro-litter data from Marine Strategy Framework Directive (MSFD) National Monitoring activities (descriptor 10). A series of specific standard vocabularies or standard terms related to micro-litter have been added to SeaDataNet NVS (NERC Vocabulary Server) Common Vocabularies to describe the micro-litter. European micro-litter data are collected by the National Oceanographic Data Centres (NODCs). Micro-litter map products are generated from NODCs data after a test of the aggregated collection including data and data format checks and data harmonization. A filter is applied to represent only micro-litter sampled according to research and monitoring protocols as MSFD monitoring. Warning: the absence of data on the map doesn't necessarily mean that they don't exist, but that no information has been entered in the National Oceanographic Data Centre (NODC) for this area.
-
The "EMODnet Digital Bathymetry (DTM)- 2020" is a multilayer bathymetric product for Europe’s sea basins covering: • the Greater North Sea, including the Kattegat and stretches of water such as Fair Isle, Cromarty, Forth, Forties,Dover, Wight, and Portland • the English Channel and Celtic Seas • Western Mediterranean, the Ionian Sea and the Central Mediterranean Sea • Iberian Coast and Bay of Biscay (Atlantic Ocean) • Adriatic Sea (Mediterranean) • Aegean - Levantine Sea (Mediterranean). • Madeira and Azores (Macaronesia) • Baltic Sea • Black Sea • Norwegian and Icelandic Seas • Canary Islands (Macaronesia) • Arctic region and Barentz Sea The DTM is based upon more than 16360 bathymetric survey data sets and Composite DTMs that have been gathered from 49 data providers from 24 countries riparian to European seas. Also Satellite Derived Bathymetry data products have been included derived from Landsat 8 and Sentinel satellite images. Areas not covered by observations are completed by integrating GEBCO 2020 and IBCAO V4. The source reference layer in the portal viewing service gives metadata of the data sets used with their data providers; the metadata also acknowledges the data originators. The incorporated survey data sets itself can be discovered and requested for access through the Common Data Index (CDI) data discovery and access service that in December 2020 contained > 30.000 survey data sets from European data providers for global waters. This discovery service makes use of SeaDataNet standards and services and have been integrated in the EMODnet portal (https://emodnet.ec.europa.eu/en/bathymetry#bathymetry-services ). The Composite DTMs are described using the Sextant Catalogue Service that makes also use of SeaDataNet standards and services. Their metadata can be retrieved through interrogating the Source Reference map in the Central Map Viewing service (https://emodnet.ec.europa.eu/geoviewer/ ). In addition, the EMODnet Map Viewer gives users wide functionality for viewing and downloading the EMODnet digital bathymetry such as: • water depth (refering to the Lowest Astronomical Tide Datum - LAT) in gridded form on a DTM grid of 1/16 * 1/16 arc minute of longitude and latitude (ca 115 * 115 meters). • option to view depth parameters of individual DTM cells and references to source data • option to download DTM in 58 tiles in different formats: ESRI ASCII, XYZ, EMODnet CSV, NetCDF (CF), GeoTiff and SD • option to visualize the DTM in 3D in the browser without plug-in • layer with a number of high resolution DTMs for coastal regions • layer with wrecks from the UKHO Wrecks database. The EMODnet DTM is also available by means of OGC web services (WMS, WFS, WCS, WMTS), which are specified at the EMODnet Bathymetry portal. The original datasets themselves are not distributed but described in the metadata services, giving clear information about the background survey data used for the DTM, their access restrictions, originators and distributors and facilitating requests by users to originator.
-
SOMLIT (Service d'Observation en Milieur Littoral) : a French Coastal Monitoring Network Coastal zones are where land, ocean and atmosphere interact. They are important for the exchange of matter and energy, and play a key role in (biogeo)chemical cycles at global scale. These environments are characterised by significant spatial and temporal variability of their physico-chemical and biological parameters due to local and seasonal meteorological drivers which are exacerbated by large-scale climate drivers (e.g. global warming, modification of the wind regime) and local-scale anthropogenic drivers (e.g. nutrient cycle changes linked to the use of fertilisers or the construction of large installations such as dams). These driving mechanisms are often interconnected. In the context of global warming (due to climate and human-induced changes), the identification and understanding of their impact on coastal marine and littoral ecosystems is essential. The scientific objective of SOMLIT is to 1) characterise the multi-decadal evolution of coastal marine and littoral ecosystems, and 2) determine the climatic and anthropogenic drivers. In order to meet this objective, a nationally coordinated multi-site monitoring system was set up in the mid-1990s. The observation strategy is the same for each of the 12 monitored ecosystems with fortnightly sampling and/or measurements, at high tide (for sites subject to tides): 1) in surface-water for a range of 15 parameters (temperature, salinity, dissolved oxygen, pH, nitrate, nitrite, ammonium, phosphate, silicate, suspended particulate matter, chlorophyll a, particulate organic carbon and nitrogen and stable isotopes of particulate organic carbon and nitrogen), 2) in surface-water for a range of 26 parameters of numbering and optical characteristics of pico- and nanoplankton), and 3) along the water column for temperature, salinity, fluorescence and PAR (vertical profiles of multi-parameter probes). SOMLIT’s activities are carried out under a quality assurance / quality control process based on the ISO 17025 standard. SOMLIT’s service provision objectives are to provide data and logistical support for research and other observation activities. SOMLIT has been officially accredited since 1996 as one of the CNRS (French National Centre for Scientific Research) National Observation Services (SNO). SOMLIT’s coordination is hosted by the Observatoire Aquitain des Sciences de l'Univers (University of Bordeaux / CNRS) and the service relies on strong partnerships with nine other institutions (University of Lille, University of the Littoral Opal Coast, University of Caen Normandy, Sorbonne University, University of Western Brittany, La Rochelle University, University of Montpellier, Aix Marseille University, National Museum of Natural History). SOMLIT is one of the nine networks that compose France’s Coastal Research Infrastructure (ILICO). SOMLIT has strong ties with ILICO’s other networks such as the SNOs MOOSE (Mediterranean Ocean Observing System on Environment), PHYTOBS (microphytoplankton monitoring) and COAST-HF (Coastal Ocean Observing System - High Frequency).
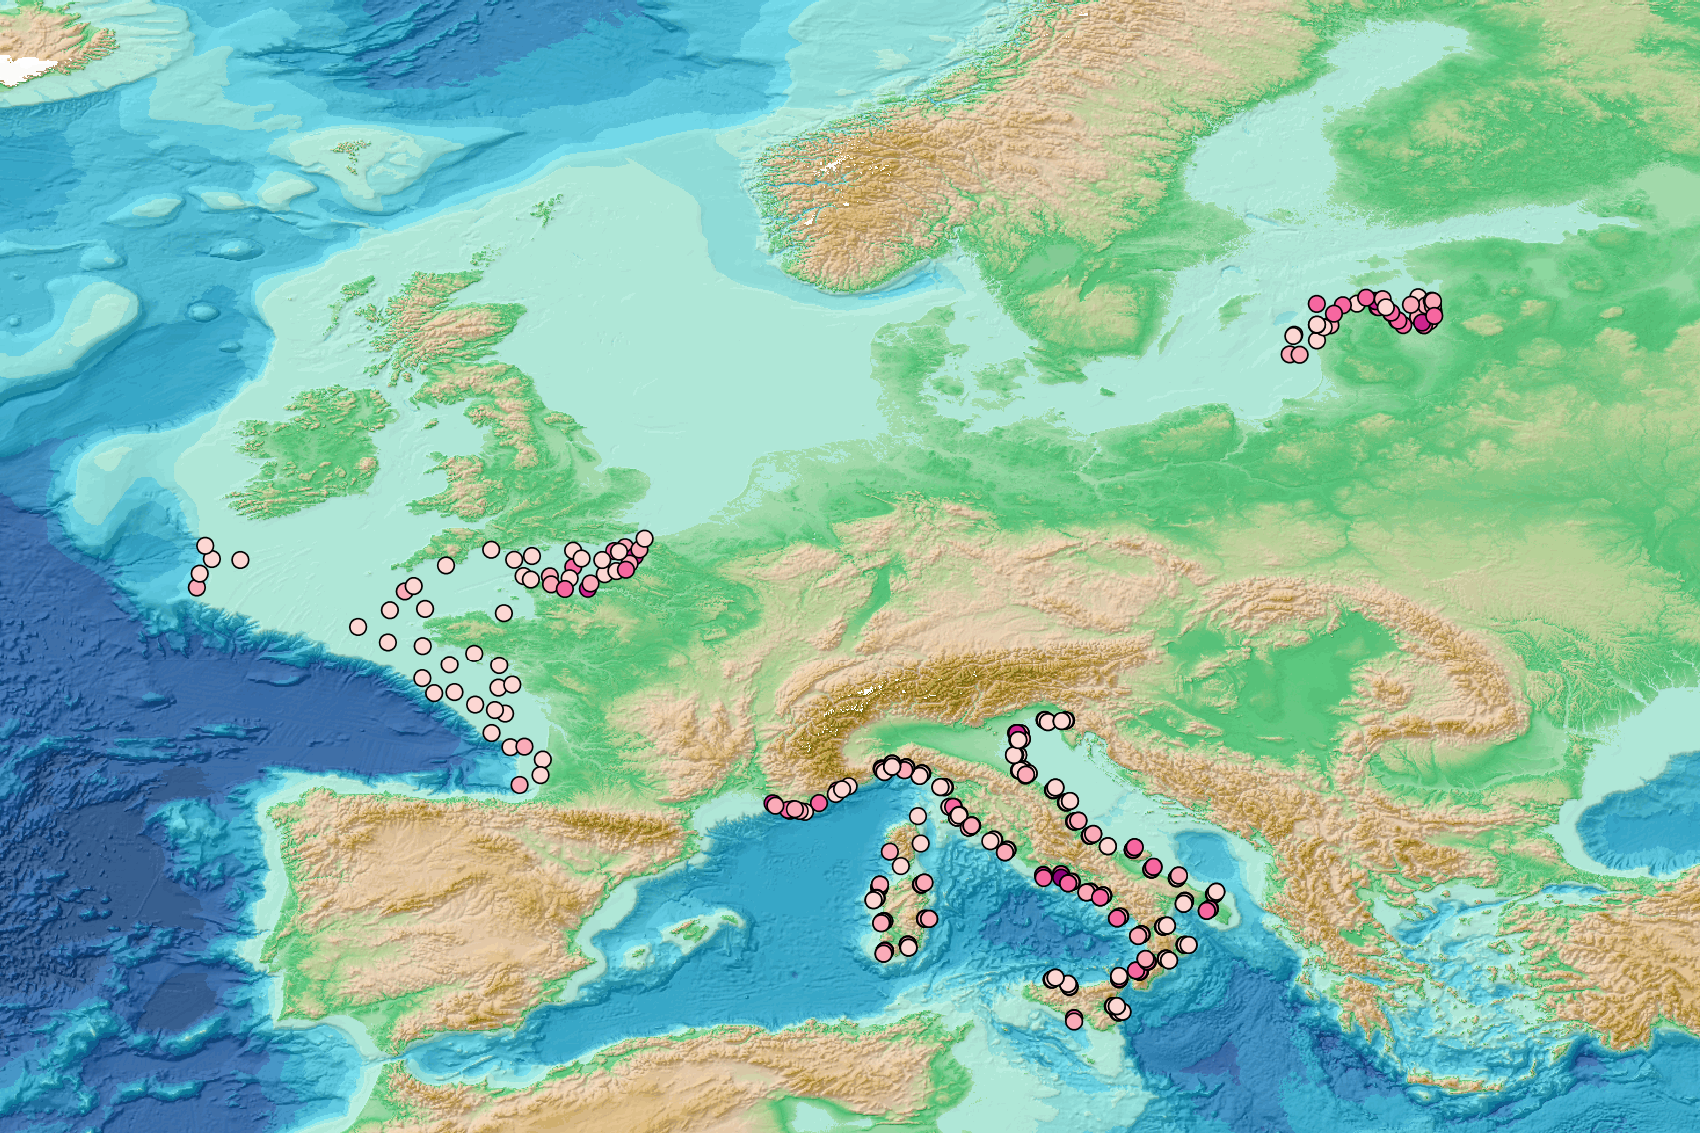
-
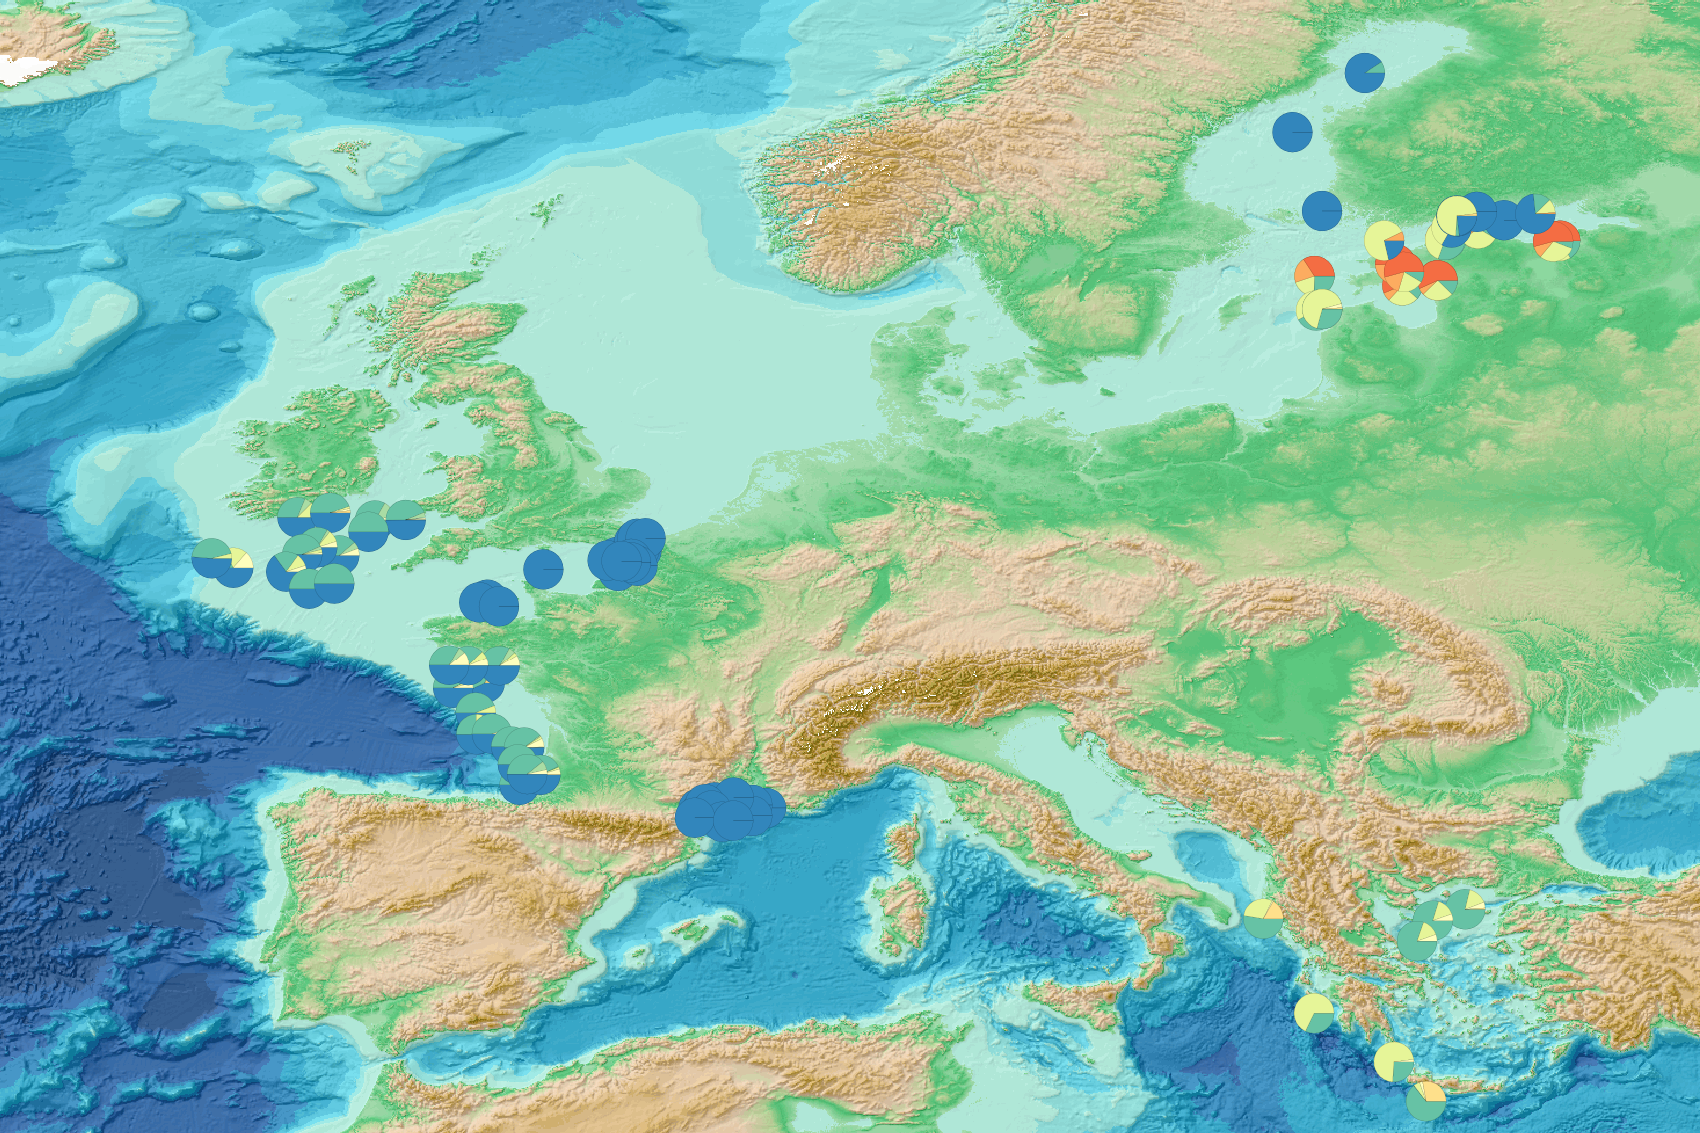
This visualization product displays the type of litter in percent per net per year from research and monitoring protocols. EMODnet Chemistry included the collection of marine litter in its 3rd phase. Before 2021, there was no coordinated effort at the regional or European scale for micro-litter. Given this situation, EMODnet Chemistry proposed to adopt the data gathering and data management approach as generally applied for marine data, i.e., populating metadata and data in the CDI Data Discovery and Access service using dedicated SeaDataNet data transport formats. EMODnet Chemistry is currently the official EU collector of micro-litter data from Marine Strategy Framework Directive (MSFD) National Monitoring activities (descriptor 10). A series of specific standard vocabularies or standard terms related to micro-litter have been added to SeaDataNet NVS (NERC Vocabulary Server) Common Vocabularies to describe the micro-litter. European micro-litter data are collected by the National Oceanographic Data Centres (NODCs). Micro-litter map products are generated from NODCs data after a test of the aggregated collection including data and data format checks and data harmonization. A filter is applied to represent only micro-litter sampled according to research and monitoring protocols as MSFD monitoring. To calculate percentages for each type, formula applied is: Type (%) = (∑number of particles of each type)*100 / (∑number of particles of all type) When the number of microlitters was not filled or zero, the percentage could not be calculated. Standard vocabularies for microliter types are taken from Seadatanet's H01 library (https://vocab.seadatanet.org/v_bodc_vocab_v2/search.asp?lib=H01) Warning: the absence of data on the map doesn't necessarily mean that they don't exist, but that no information has been entered in the National Oceanographic Data Centre (NODC) for this area.