 Catalogue PIGMA
unknown
Type of resources
Available actions
Topics
Keywords
Contact for the resource
Provided by
Years
Formats
Representation types
Update frequencies
status
Scale
Resolution
-
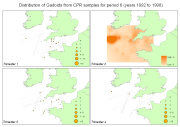
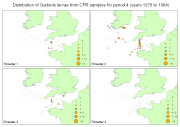
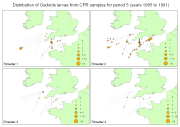
Fish larvae were collected by the continuous plankton recorder (CPR, operated by SAHFOS) all year long between 1951 and 2005 along transects in the Celtic Sea and English Channel. The CPR is towed by ships of opportunity at speeds of 15 to 20 knots, at an approximate depth of 10 m. Water enters the recorder through an aperture of 1.27 cm2, and is filtered through a continuously moving band of silk with an average mesh size of 270 μm.
-
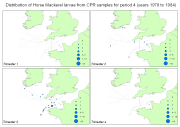
-
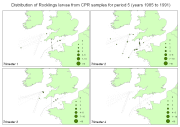
Fish larvae were collected by the continuous plankton recorder (CPR, operated by SAHFOS) all year long between 1951 and 2005 along transects in the Celtic Sea and English Channel. The CPR is towed by ships of opportunity at speeds of 15 to 20 knots, at an approximate depth of 10 m. Water enters the recorder through an aperture of 1.27 cm2, and is filtered through a continuously moving band of silk with an average mesh size of 270 μm.
-

-
-

'''DEFINITION''' Important note to users: These data are not to be used for navigation. The data is 100 m resolution and as high quality as possible. It has been produced with state-of-the-art technology and validated to the best of the producer’s ability and where sufficient high-quality data were available. These data could be useful for planning and modelling purposes. The user should independently assess the adequacy of any material, data and/or information of the product before relying upon it. Neither Mercator Ocean International/Copernicus Marine Service nor the data originators are liable for any negative consequences following direct or indirect use of the product information, services, data products and/or data. Product overview: This is a satellite derived bathymetry product covering the global coastal area (where data retrieval is possible), with 100 m resolution, based on Sentinel-2. This global coastal product has been developed based on 3 methodologies: Intertidal Satellite-Derived Bathymetry; Physics-based optical Satellite-Derived Bathymetry from RTE inversion; and Wave Kinematics Satellite-Derived Bathymetry from wave dispersion. There is one dataset for each of the methods (including a quality index based on uncertainty) and an additional one where the three datasets were merged (also includes a quality index). Using their expertise and special techniques the consortium tried to achieve an optimal balance between coverage and data quality. '''DOI (product):''' https://doi.org/10.48670/mds-00364
-
Fish larvae were collected by the continuous plankton recorder (CPR, operated by SAHFOS) all year long between 1951 and 2005 along transects in the Celtic Sea and English Channel. The CPR is towed by ships of opportunity at speeds of 15 to 20 knots, at an approximate depth of 10 m. Water enters the recorder through an aperture of 1.27 cm2, and is filtered through a continuously moving band of silk with an average mesh size of 270 μm.
-