 Catalogue PIGMA
SHP
Type of resources
Available actions
Topics
Keywords
Contact for the resource
Provided by
Years
Formats
Representation types
Update frequencies
status
Scale
Resolution
-
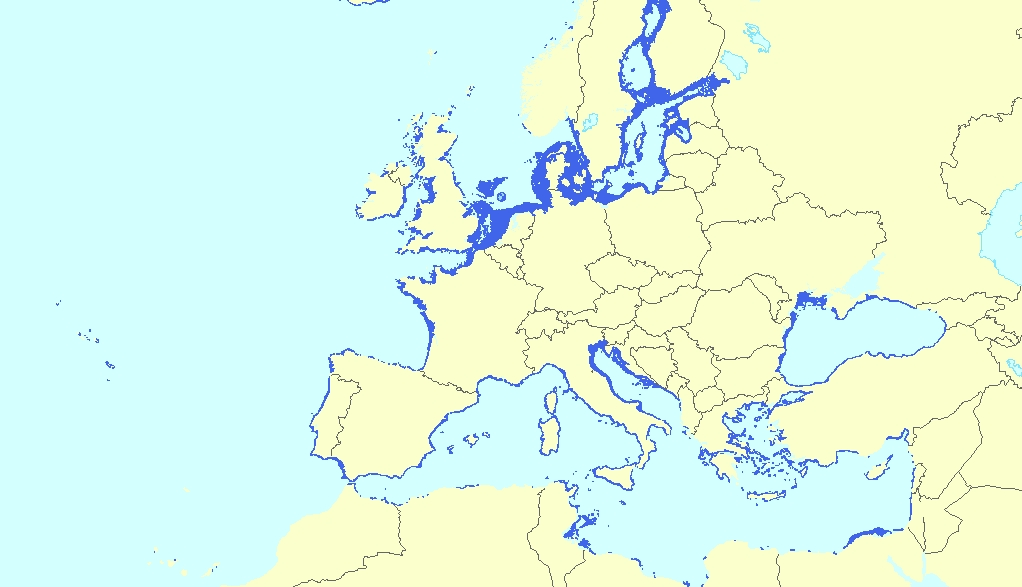
This vector dataset represents the benthic broad habitat types in Europe Seas potentially affected by the ship wakes. When navigating, the propellers of ships generate a turbulent mixing of the water that can produce sediment re-suspension in soft bottoms of shallow areas. This can increase the turbidity in those areas, affecting the seafloor organisms (especially those that are directly dependent on light, such as aquatic plants). It may also contribute to an increase of the the eutrophication level of the ecosystem (since the turbid waters may become warmer, which may turn into a reduction of dissolved oxygen in water). Finally, turbidity can produce an increase in the inputs of contaminants and microbial pathogens, since those can become attached to the suspended solids. The dataset has been prepared in the context of the development of the first European Maritime Transport Environmental Report (https://www.eea.europa.eu/publications/maritime-transport).
-
This dataset presents the resulting assessment grid (based on the EEA reference grid) with the classification of ecosystem health of the transitional, coastal and marine waters in the context of the Water Framework Directive (WFD) and the Marine Strategy Framework Directive (MSFD). This classification has been performed using the MESH+ (Marine EcoSystem Health) tool. The MESH+ tool builds on the EEA assessment tools developed and applied in the context of assessing the degree of contamination (CHASE+), eutrophication (HEAT+) and biodiversity (BEAT+) in Europe's seas (EEA, 2018a, 2019c; Vaughan et al., 2019). MESH+ makes use of the same data sets and threshold values used in these assessments but recombines these in a new framework that addresses 'ecosystem condition'. The overall area of interest used is based on the marine regions and subregions under the MSFD. Additionally, Norwegian (Barents Sea and Norwegian Sea) and Icelandic waters (’Iceland Sea’) have been added (see Surrounding seas of Europe). Note that within the North East Atlantic region only the subregions within EEZ boundaries (~200 nm) have been included. The spatial resolution of the assessment grid is 20 km x 20 km in coastal areas and 100 km x 100 km in offshore areas. This dataset underpins the findings and cartographic representations published in the report "Marine Messages II" (EEA, 2020): https://www.eea.europa.eu/publications/marine-messages-2
-
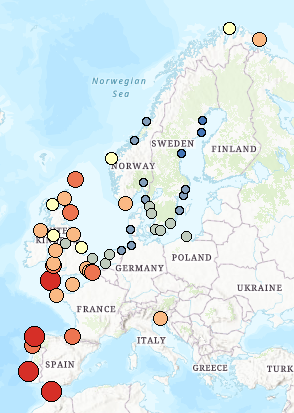
This dataset presents the estimated multiplication factor by which the frequency of flooding events of a given height in European tide gauges will change between 2010 and 2100, due to projected regional sea relative level rise under the Representative Concentration Pathways (RCP) 4.5 scenario. Values larger than 1 indicate an increase in flooding frequency. This dataset is derived from the Figure 13.25(b) of the Working Group I contribution to the IPCC Fifth Assessment Report (http://www.climatechange2013.org/images/report/WG1AR5_ALL_FINAL.pdf). This dataset also contributes to an earlier version of the EEA Indicator "Global and European sea-level": https://www.eea.europa.eu/data-and-maps/indicators/sea-level-rise-5/assessment.
-
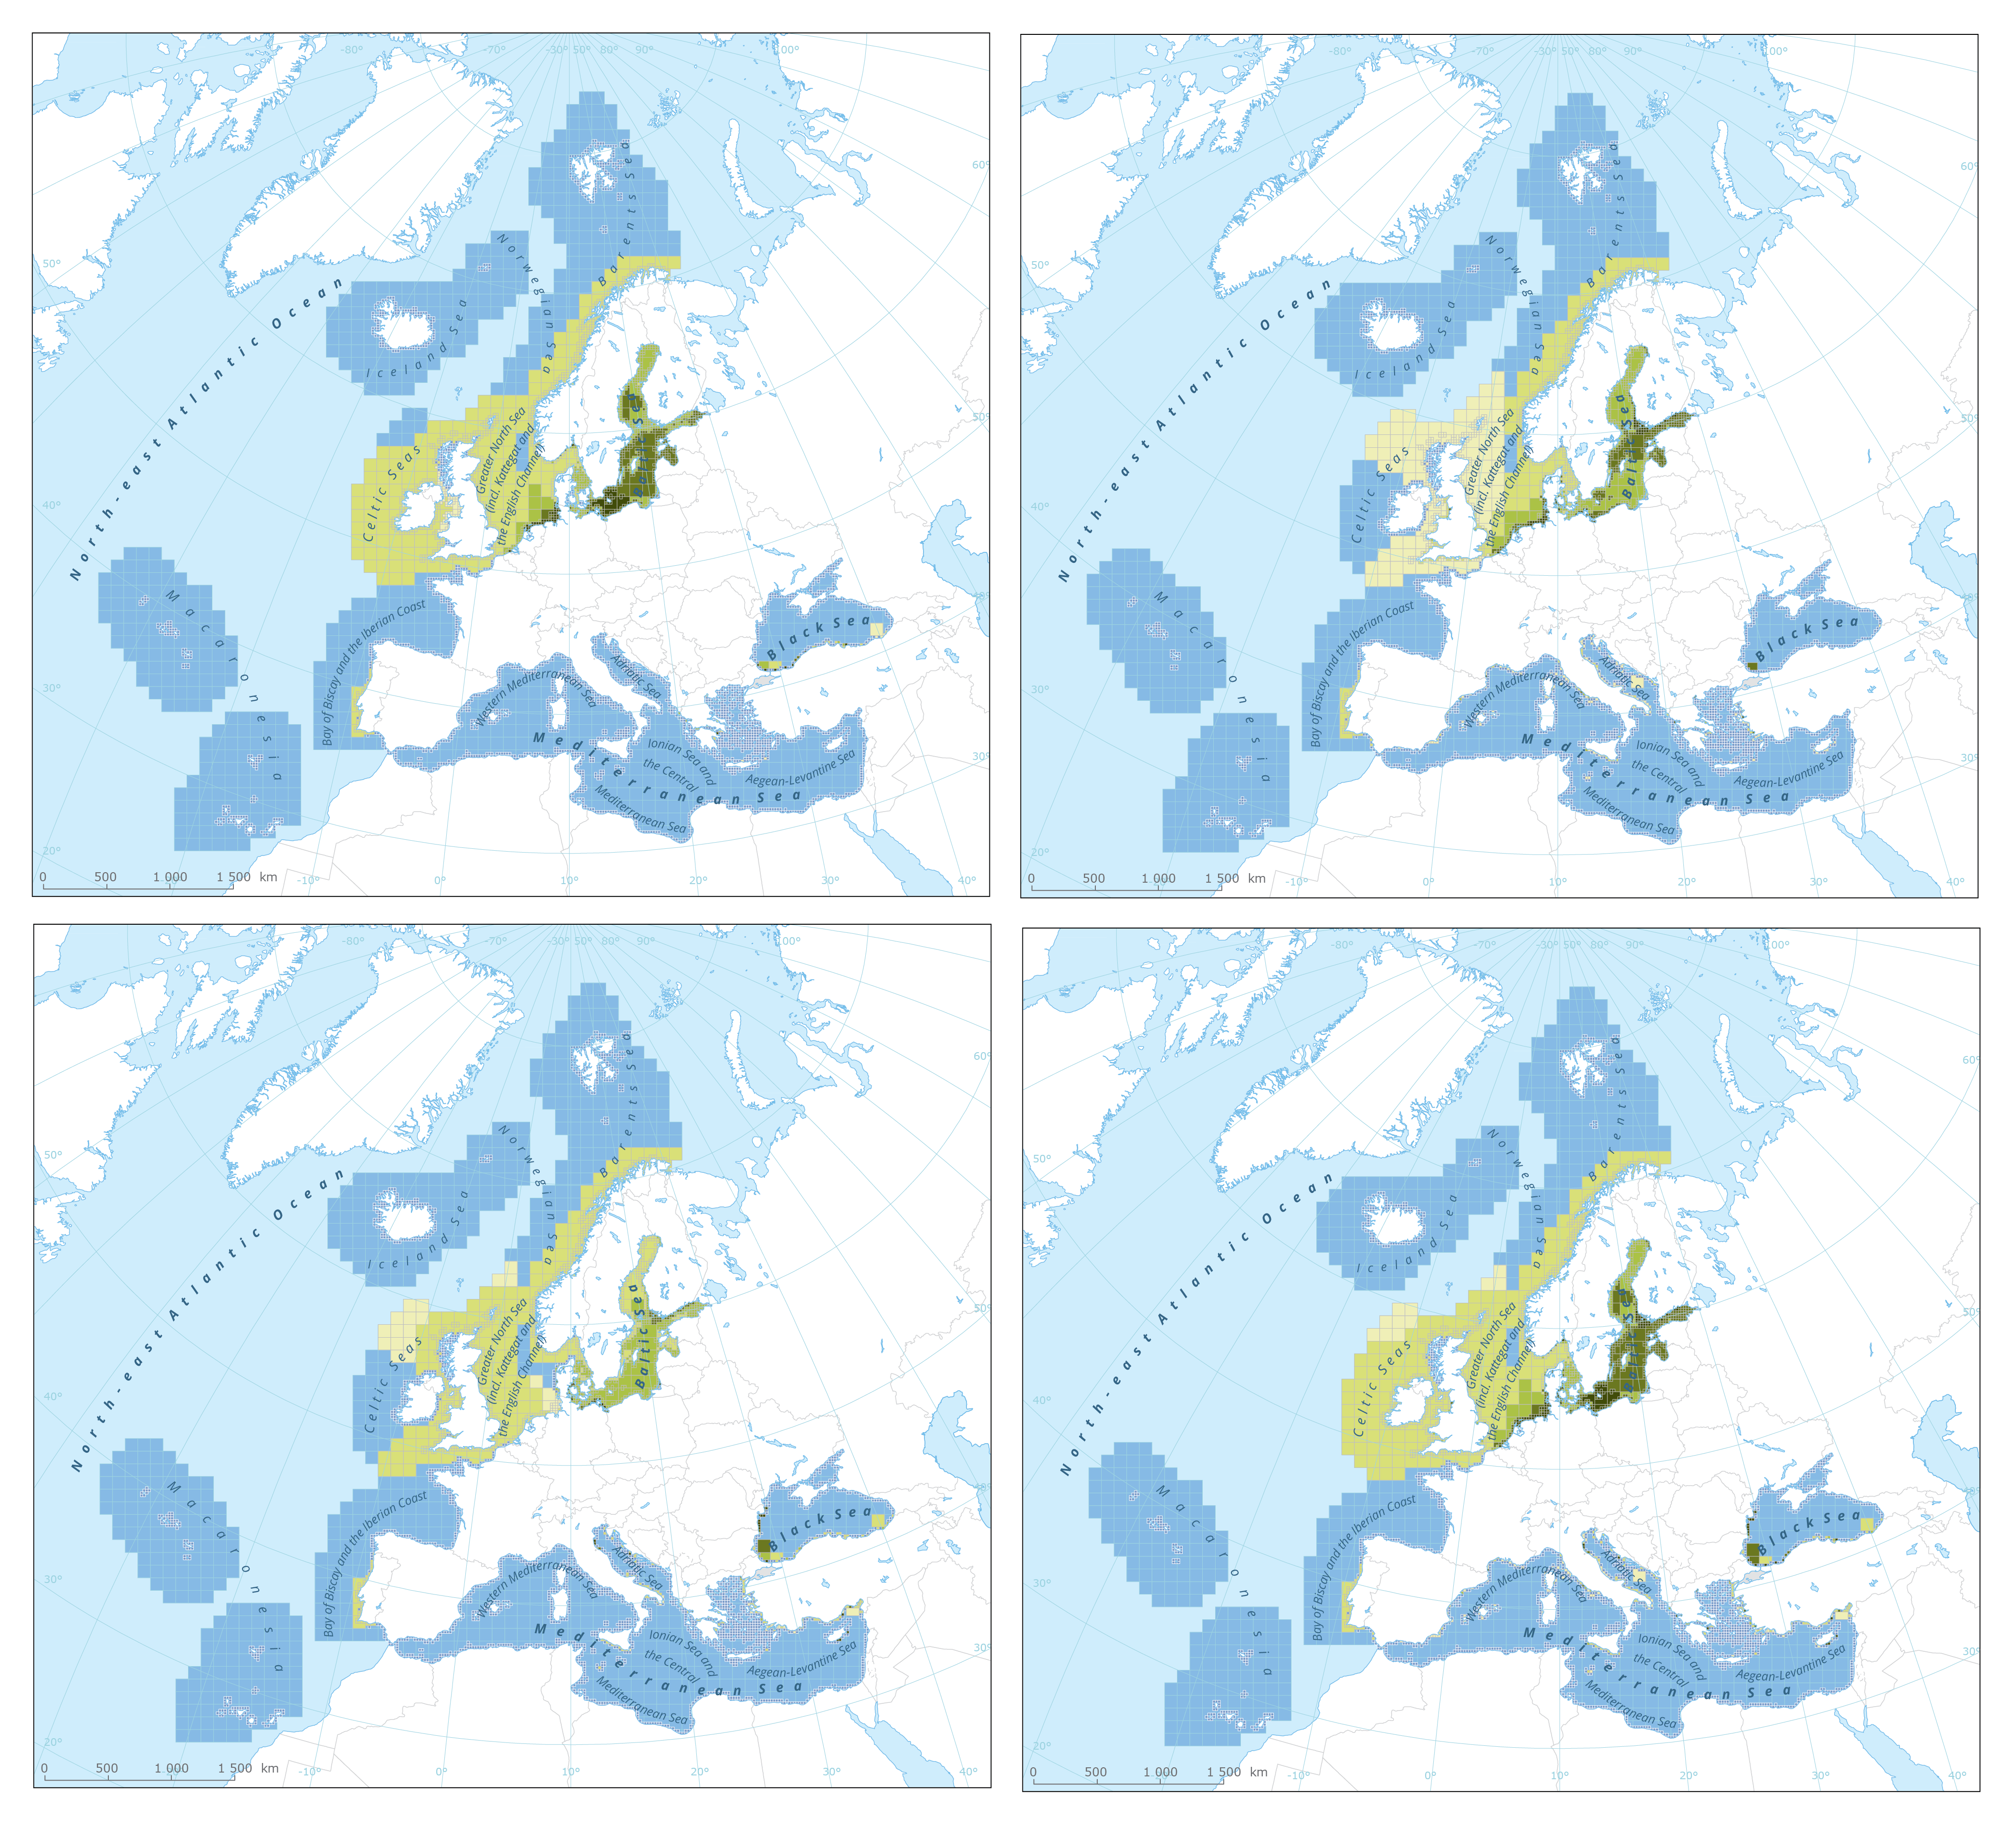
The dataset presents the results of classification of eutrophication status of the European seas using the HEAT+ tool. Eutrophication status is evaluated in five classes, where NPAhigh and NPAgood are recognised as ‘non-problem areas’ and PAmoderate, PApoor and PAbad are recognised as ‘problem areas’. Besides the overall Eutrophication status (HEAT+) are the results shown for three aspects of eutrophication: C1) Nutrient Concentrations C2) Direct Effects C3) Indirect Effects This dataset underpins the findings and cartographic representations published in the report "Nutrient enrichment and eutrophication in Europe's seas" (EEA, 2019): https://www.eea.europa.eu/publications/nutrient-enrichment-and-eutrophication-in.
-
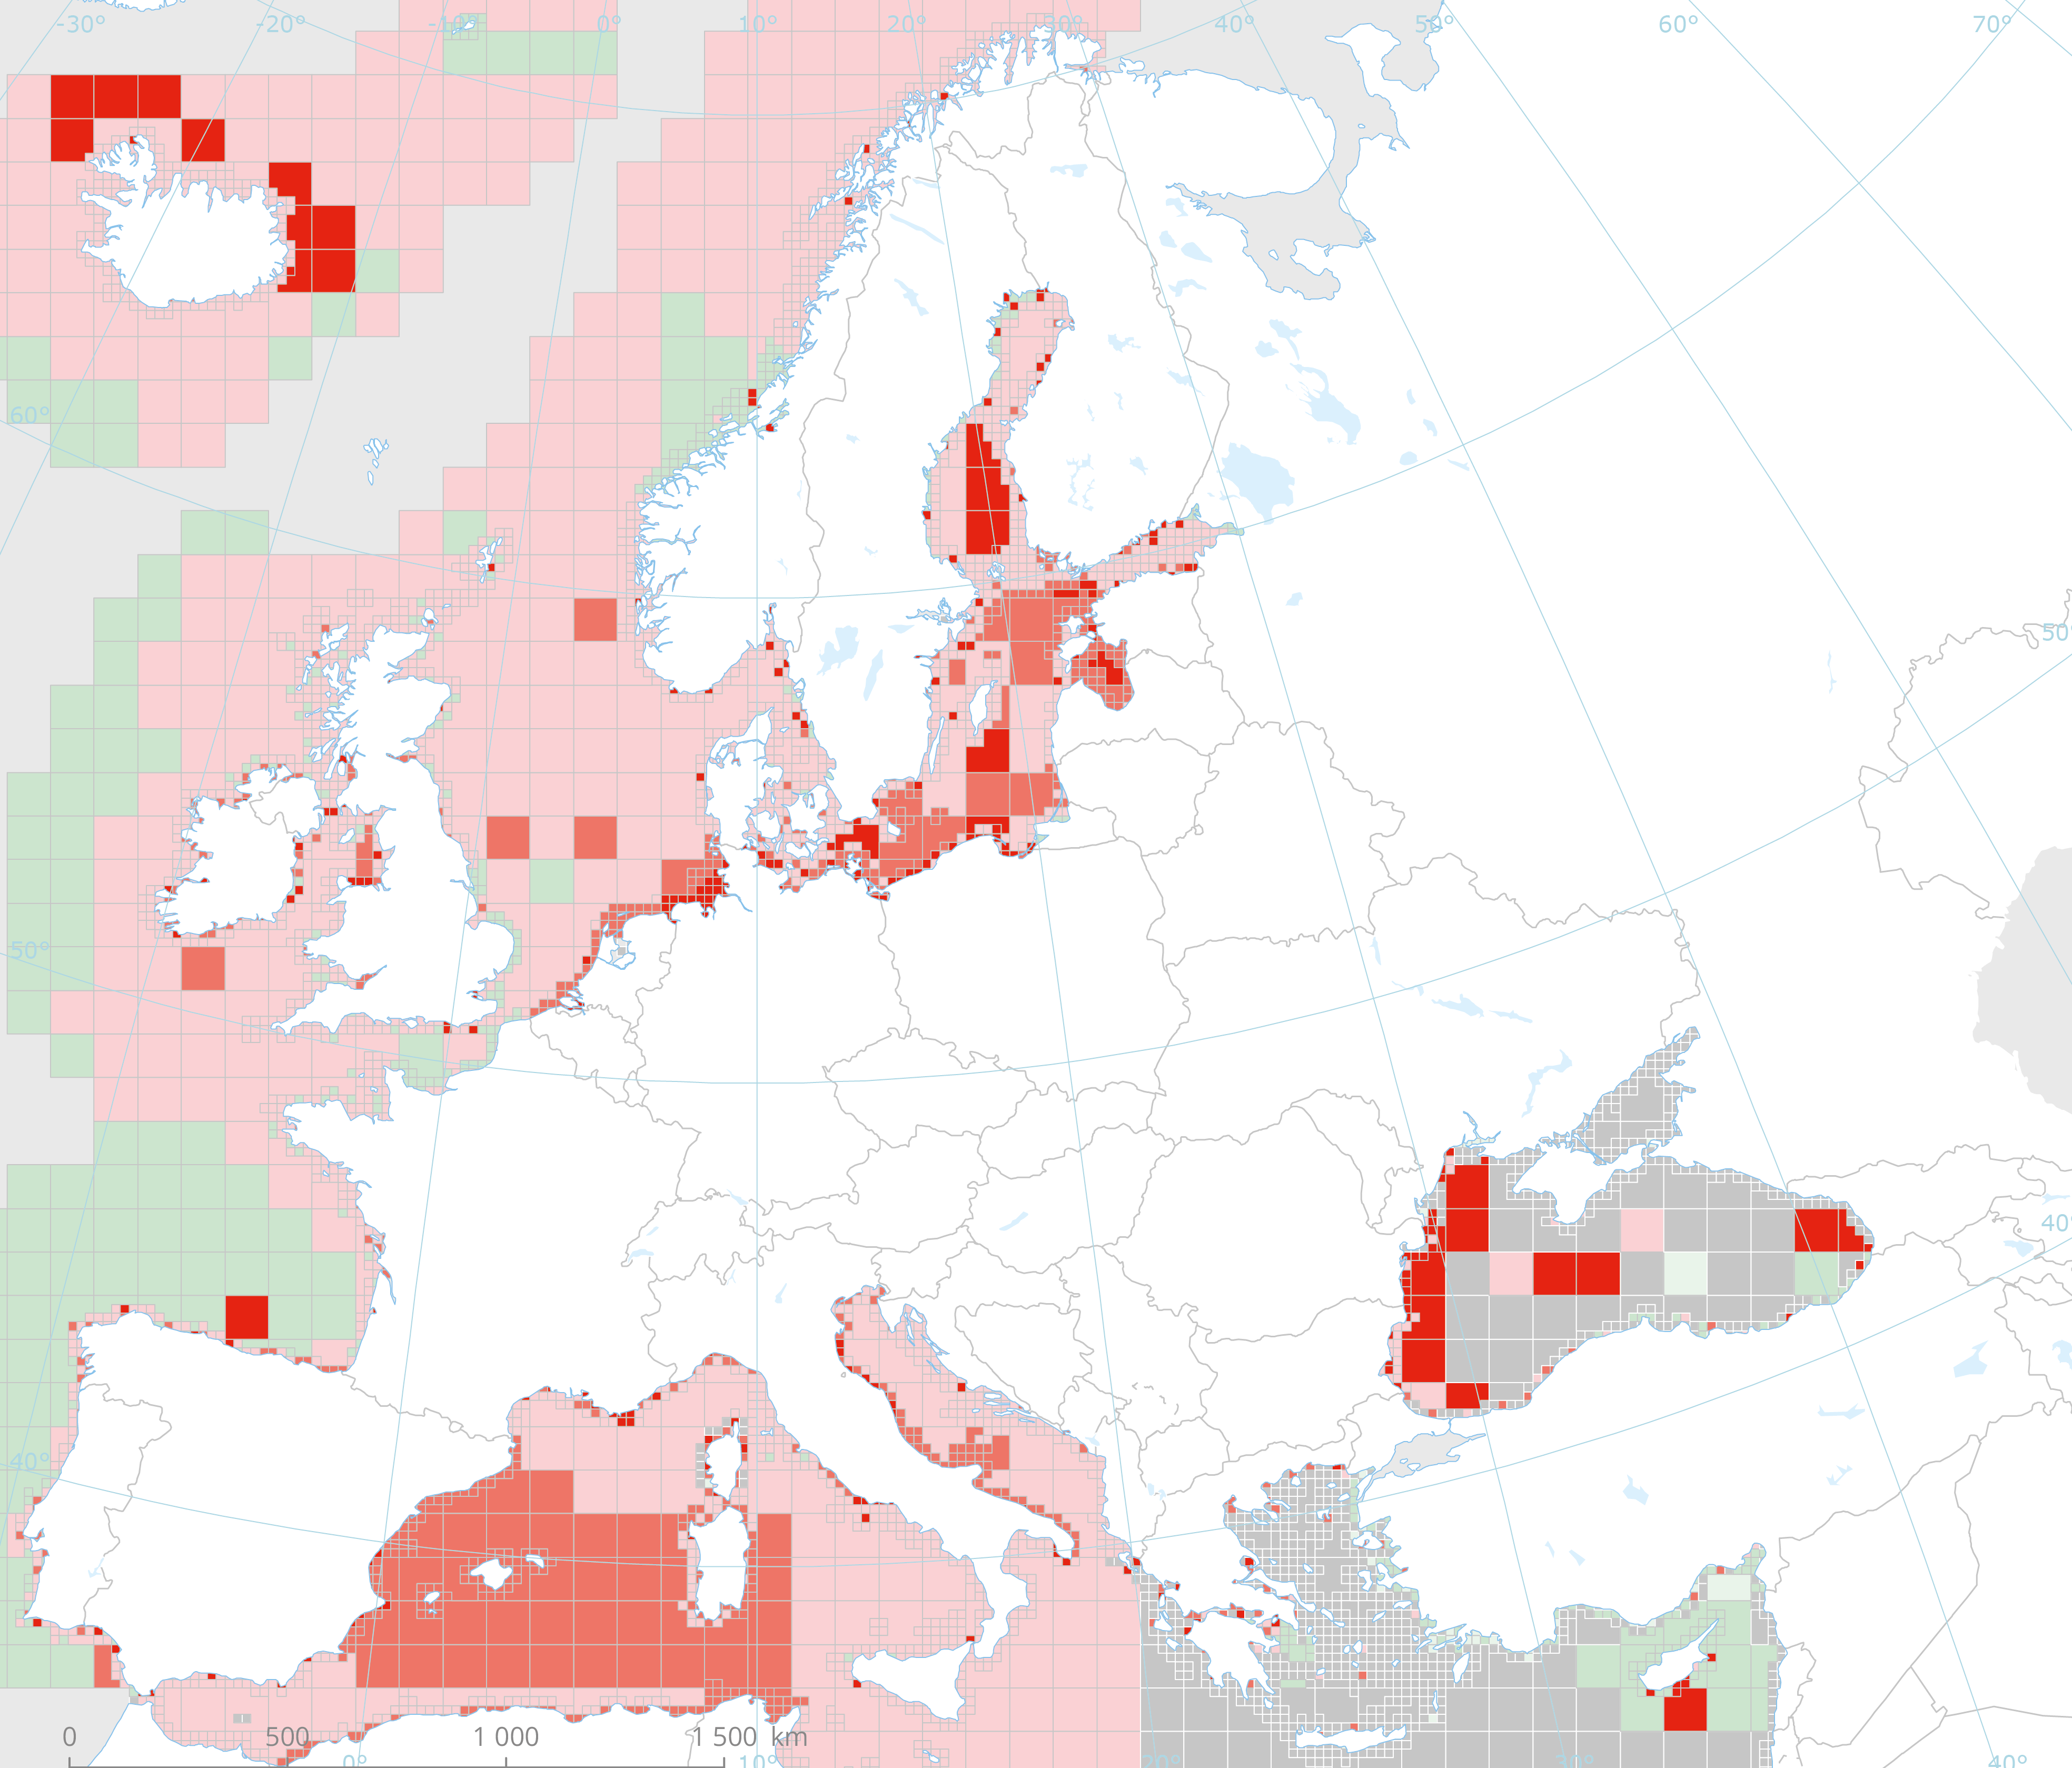
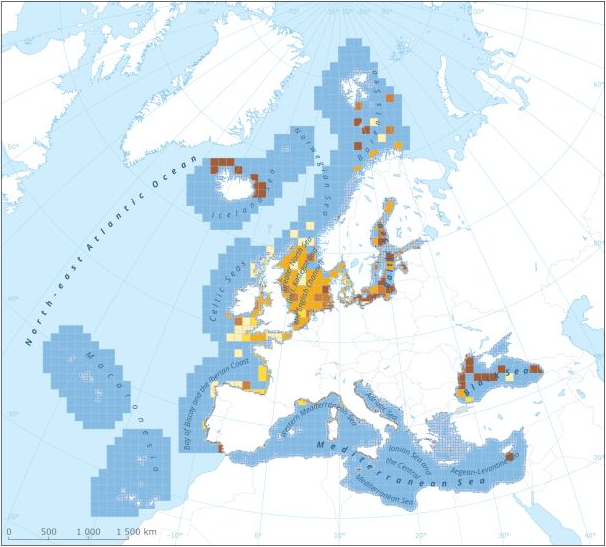
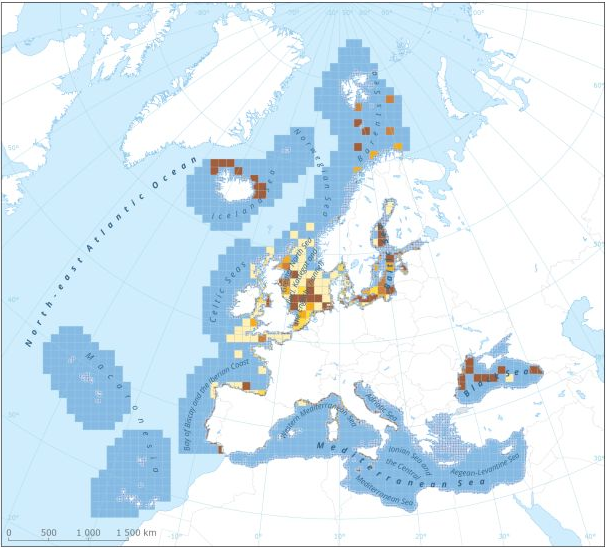
This data set presents the resulting assessment grid (based on the EEA reference grid) with the classification of chemical status of the transitional, coastal and marine waters in the context of the Water Framework Directive (WFD) and the Marine Strategy Framework Directive (MSFD), with a mapping of contamination 'problem areas' and ‘non-problem areas’ based on measurements in the matrix 'biota'. This classification has been performed using the CHASE+ tool, with classifications of the biota matrix. The chemical status is evaluated in five classes, where NPAhigh and NPAgood are recognised as ‘non-problem areas’ and PAmoderate, PApoor and PAbad are recognised as ‘problem areas’. Monitoring and assessment for the matrix 'biota' has been carried out in the North-East Atlantic Ocean (482 assessment units), Baltic sea (198 assessment units), Mediterranean Sea (161 assessment units) and Black sea (12 assessment units). This data set underpins the findings and cartographic representations published in the EEA report “Contaminants in Europe’s seas” (No 25/2018): https://www.eea.europa.eu/publications/contaminants-in-europes-seas. See the mentioned report for further information as well as examples of classification excluding specific groups of substances (e.g. metals, PBDEs).
-
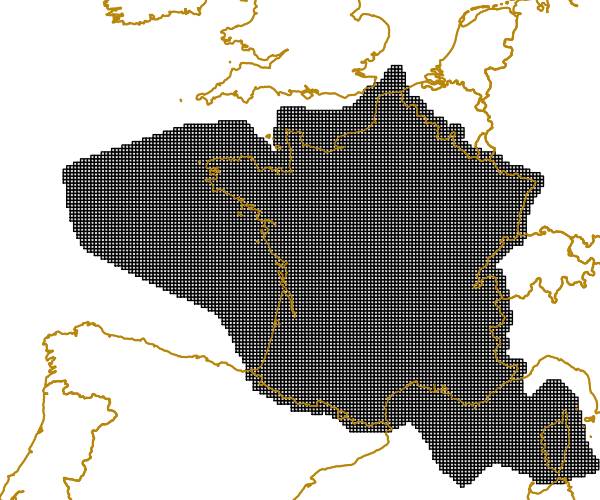
The grid is based on proposal at the 1st European Workshop on Reference Grids in 2003 and later INSPIRE geographical grid systems. The sample grid available here is part of a set of three polygon grids in 1, 10 and 100 kilometres. The grids cover at least country borders and, where applicable, marine Exclusive Economic Zones v7.0, http://www.marineregions.org. Note that the extent of the grid into the marine area does not reflect the extent of the territorial waters.
-
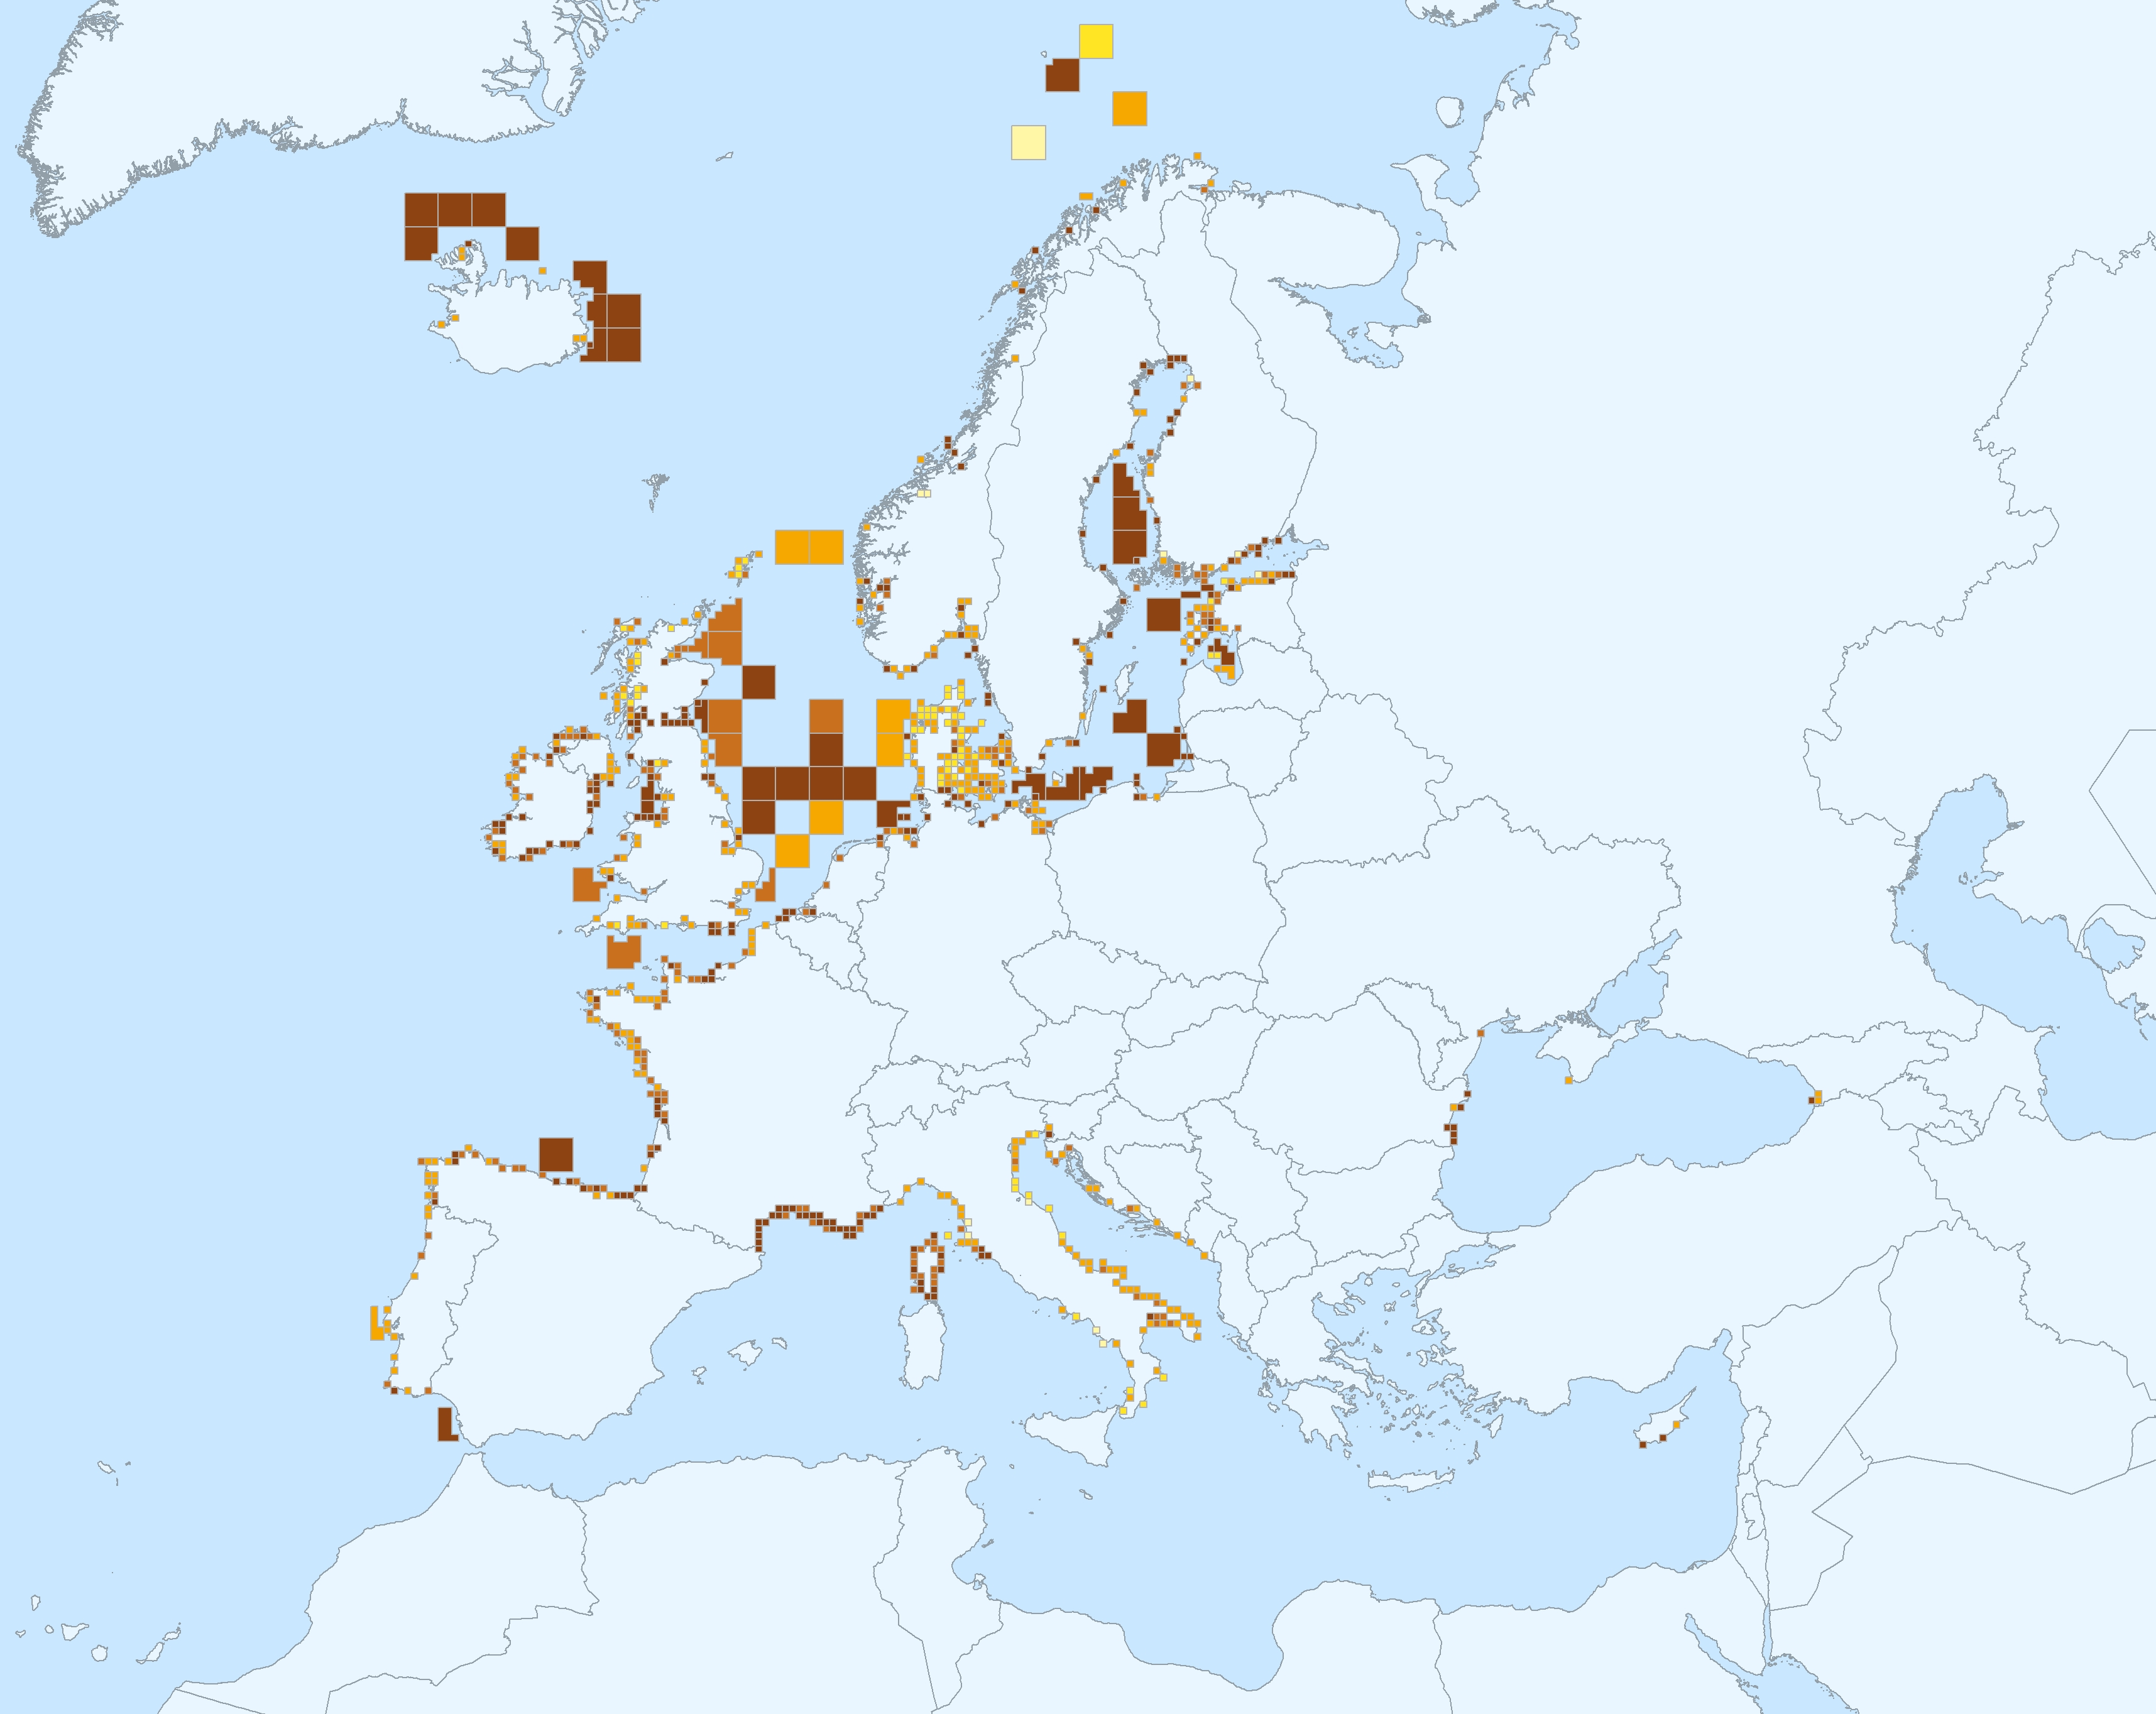
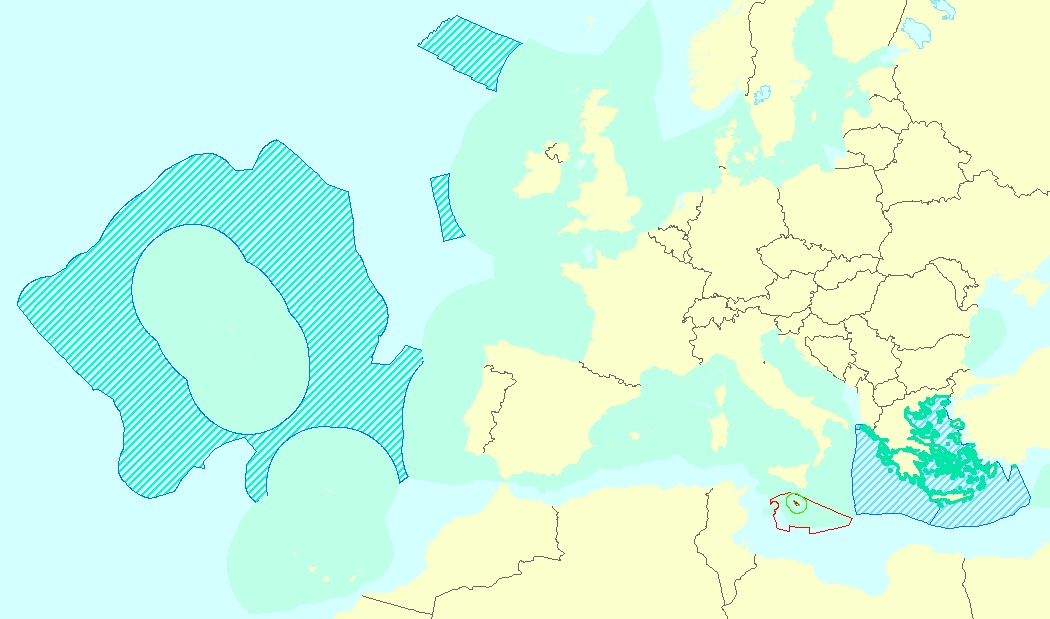
Gridded Distribution of Species as reported during the Article 17 of the Habitats Directive (92/43/EEC) covering the period 2001 to 2006. The data covers the EU 25. All Member States are requested by the Habitats Directive (92/43/EEC) to monitor habitat types and species considered to be of Community interest. Article 17 of the Habitats Directive 92/43/EEC requires that every 6 years Member States prepare reports to be sent to the European Commission on the implementation of the Directive. The Article 17 report for the period 2001-2006 for the first time includes assessments on the conservation status of the habitat types and species of Community interest. Information on the data quality of the 2001-2006 reporting round is available at http://bd.eionet.europa.eu/article17.
-
This dataset presents the resulting assessment grid (based on the EEA reference grid) with the classification of chemical status of the transitional, coastal and marine waters in the context of the Water Framework Directive (WFD) and the Marine Strategy Framework Directive (MSFD). This classification has been performed using the CHASE+ tool, with classifications of the matrices ‘water’, ‘sediment’ and ‘biota’ and indicators of ‘biological effects’, as well as an integrated classification of chemical status, combining results of all matrices. The chemical status is evaluated in five classes, where NPAhigh and NPAgood are recognised as ‘non-problem areas’ and PAmoderate, PApoor and PAbad are recognised as ‘problem areas’. This is the assessment made excluding concentrations of mercury (Hg) and polybrominated diphenyl ethers (PBDEs) The overall area of interest used is based on the marine regions and subregions under the Marine Strategy Framework Directive. Additionally, Norwegian (Barent Sea and Norwegian Sea) and Icelandic waters (’Iceland Sea’) have been added (see Surrounding seas of Europe). Note that within the North East Atlantic region only the subregions within EEZ boundaries (~200 nm) have been included. This dataset underpins the findings and cartographic representations published in the report "Contaminants in Europe's Seas" (EEA, 2019): https://www.eea.europa.eu/publications/contaminants-in-europes-seas.
-
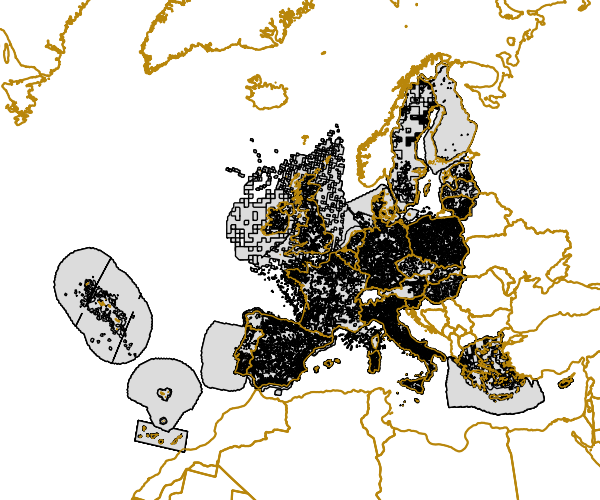
This vector data set is the first public version released of the EU marine waters used for the implementation of the Marine Strategy Framework Directive (MSFD), submitted by the Member States to the European Commission. The Marine Strategy Framework Directive (MSFD) applies to all marine waters of EU Member States, which in Article 3 are defined as follows: (a) waters, the seabed and subsoil on the seaward side of the baseline from which the extent of territorial waters is measured extending to the outmost reach of the area where a Member State has and/or exercises jurisdictional rights, in accordance with the UNCLOS, with the exception of waters adjacent to the countries and territories mentioned in Annex II to the Treaty and the French Overseas Departments and Collectivities; and (b) coastal waters as defined by Directive 2000/60/EC, their seabed and their subsoil, in so far as particular aspects of the environmental status of the marine environment are not already addressed through that Directive or other Community legislation.
-
This dataset presents the resulting assessment grid (based on the EEA reference grid) with the classification of chemical status of the transitional, coastal and marine waters in the context of the Water Framework Directive (WFD) and the Marine Strategy Framework Directive (MSFD). This classification has been performed using the CHASE+ tool, with classifications of the matrices ‘water’, ‘sediment’ and ‘biota’ and indicators of ‘biological effects’, as well as an integrated classification of chemical status, combining results of all matrices. The chemical status is evaluated in five classes, where NPAhigh and NPAgood are recognised as ‘non-problem areas’ and PAmoderate, PApoor and PAbad are recognised as ‘problem areas’. This is the assessment made excluding concentrations of metals. The overall area of interest used is based on the marine regions and subregions under the Marine Strategy Framework Directive. Additionally, Norwegian (Barent Sea and Norwegian Sea) and Icelandic waters (’Iceland Sea’) have been added (see Surrounding seas of Europe). Note that within the North East Atlantic region only the subregions within EEZ boundaries (~200 nm) have been included. This dataset underpins the findings and cartographic representations published in the report "Contaminants in Europe's Seas" (EEA, 2019).