 Catalogue PIGMA
/Observational data/satellite
Type of resources
Available actions
Topics
Keywords
Contact for the resource
Provided by
Years
Formats
Representation types
Update frequencies
status
Scale
Resolution
-

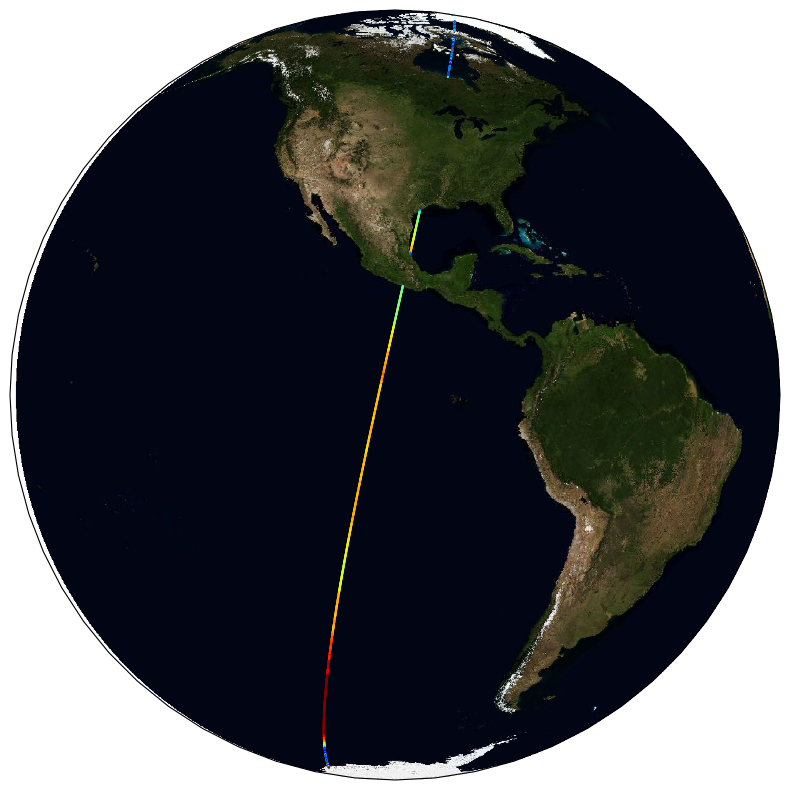
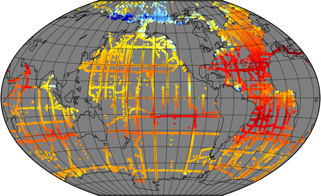
These gridded products are produced from the following upstream data: - for satellites SARAL/AltiKa, Cryosat-2, HaiYang-2B, Jason-3, Copernicus Sentinel-3A/B, Sentinel-6 MF, SWOT Nadir => NRT (Near-Real-Time) Nadir along-track (or Level-3) SEA LEVEL products (DOI: https://doi.org/10.48670/moi-00147) delivered by the Copernicus Marine Service (http://marine.copernicus.eu/ ). The gridded product is based on near-real-time (NRT) Level-3 Nadir datasets for the period from July 7, 2025, to December 31, 2025. => MY (Multi-Year) Nadir along-track (or Level-3) SEA LEVEL products (DOI: https://doi.org/10.48670/moi-00146 ) delivered by the Copernicus Marine Service (CMEMS, http://marine.copernicus.eu/ ). The gridded product is based on MY Level-3 Nadir datasets for the period from March 28, 2023, to July 6, 2025. - for SWOT KaRIn : the L3_LR_SSH Expert v3.0 product distributed by AVISO (DOI: https://doi.org/10.24400/527896/A01-2023.018) from March 28, 2023 to December 31, 2025. One mapping algorithm is proposed: the MIOST approach which provides which provides global Sea Surface Height (SSH) solutions. The MIOST method is capable of accounting for various modes of ocean surface topography variability (e.g., geostrophic, barotropic, equatorial wave dynamics) by constructing multiple independent components within a predefined covariance model.
-
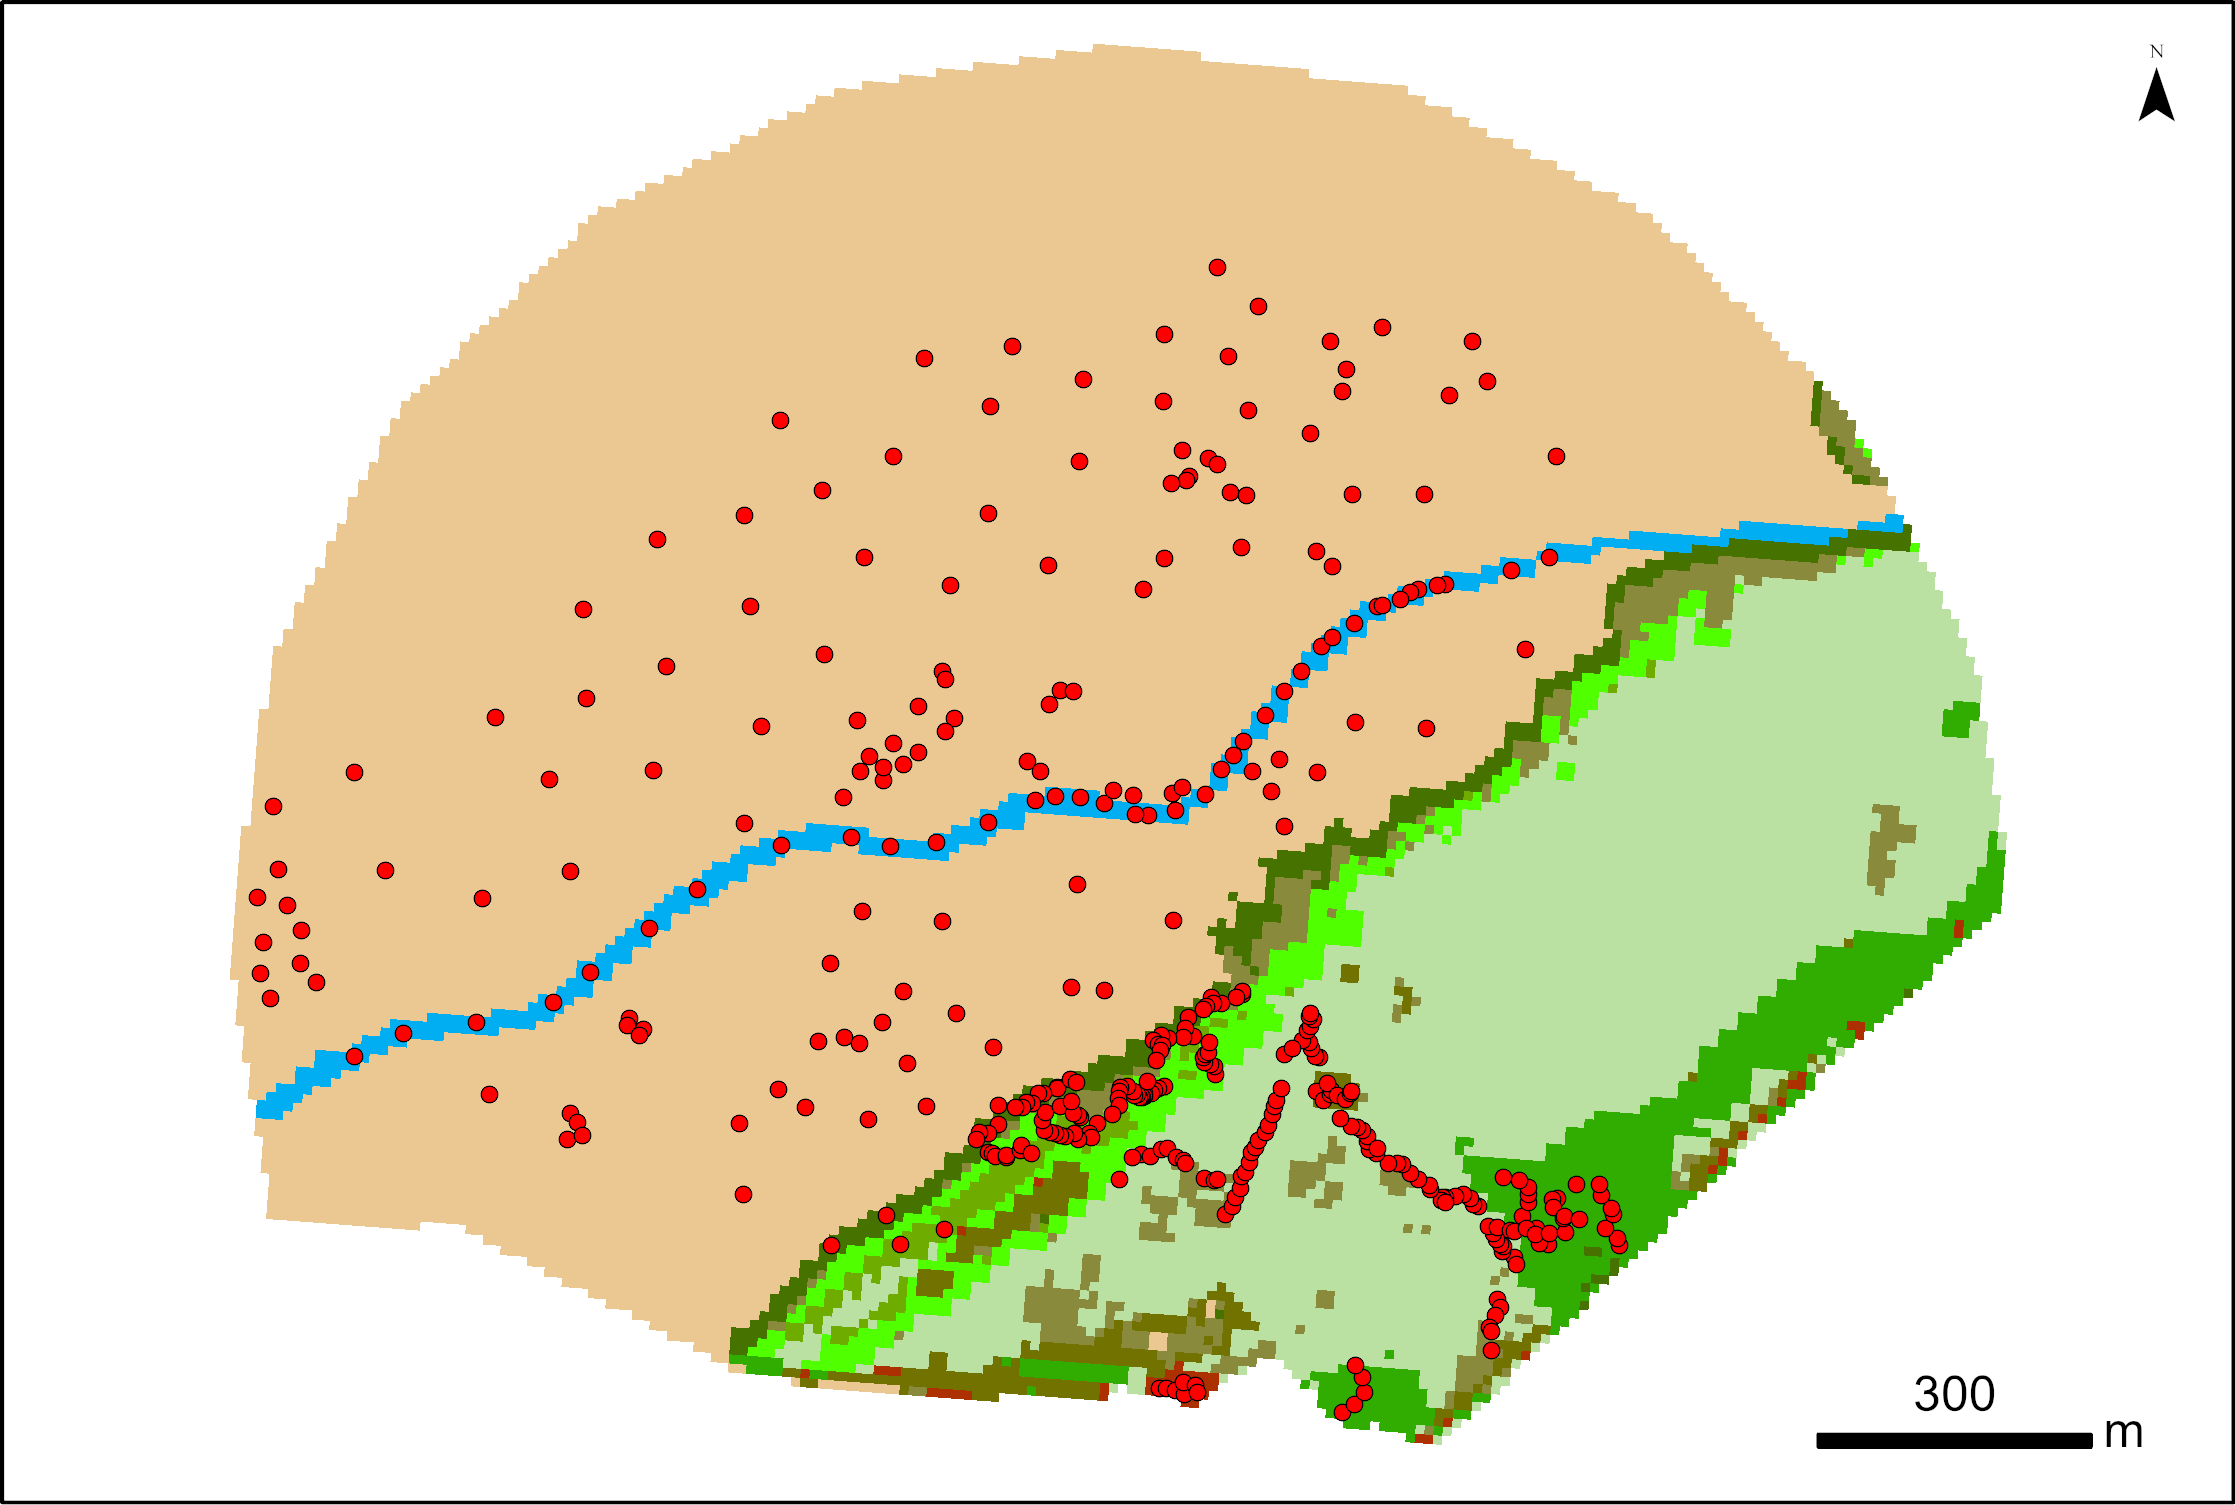
387 points were surveyed with a SP80 DGPS by Maxime Paschal as part of the La Rochelle Zero Carbon Territory (LRTZC) project on 26/05/23. At each point, the type of vegetation was specified.
-
Archive de toutes les données de température de surface (SST) satellite produites dans le cadre du projet international GHRSST. Ifremer est un GDAC pour ces données, miroir du GDAC NASA/JPL. Ces données sont utilisées pour la génération de produits multi-capteurs (CMEMS, Medspiration) mais également dans le cadre d'un grand nombre d'études ou projets nécessitant l'utilisation de mesures de SST. L'archive regroupe plusieurs jeux de données provenant de différents satellite ainsi que des données in situ de référence pour leur validation. Elle est mise à jour en temps quasi-réel depuis 10 ans, avec service de diffusion opérationnelle associé (FTP et HTTP). Une fiche sextant (issue du catalogue CERSAT) sera fournie pour chaque dataset dans cette archive.
-
The ESA Sea State Climate Change Initiative (CCI) project has produced global multi-sensor time-series of along-track satellite altimeter significant wave height data (referred to as Level 2P (L2P) data) with a particular focus for use in climate studies. This dataset contains the Version 3 Remote Sensing Significant Wave Height product, which provides along-track data at approximately 6 km spatial resolution, separated per satellite and pass, including all measurements with flags, corrections and extra parameters from other sources. These are expert products with rich content and no data loss. The altimeter data used in the Sea State CCI dataset v3 come from multiple satellite missions spanning from 2002 to 2022021 (Envisat, CryoSat-2, Jason-1, Jason-2, Jason-3, SARAL, Sentinel-3A), therefore spanning over a shorter time range than version 1.1. Unlike version 1.1, this version 3 involved a complete and consistent retracking of all the included altimeters. Many altimeters are bi-frequency (Ku-C or Ku-S) and only measurements in Ku band were used, for consistency reasons, being available on each altimeter but SARAL (Ka band).
-
This dataset contains all satellite altimeter wave heights above 9 m, from the following satellite missions: ERS-1, ERS-2, Topex-Poseidon (Topex only), Envisat, SARAL, Jason-1, Jason-2, Jason-3, Sentinel-3A, Sentinel-3B, Sentinel-6A, Cryosat-2, CFOSAT, SWOT. Storm event identification used the DetectHsStorm package developed by M. De Carlo and F. Ardhuin ( https://github.com/ardhuin/) . This data can be combined with modeled storm tracks (see F. Ardhuin, M. De Carlo, Storm tracks based on wave heights from LOPS WAVEWATCH III hindcast and ERA5 reanalysis, years 1991-2024, SEANOE (2025). doi: 10.17882/105148 )
-
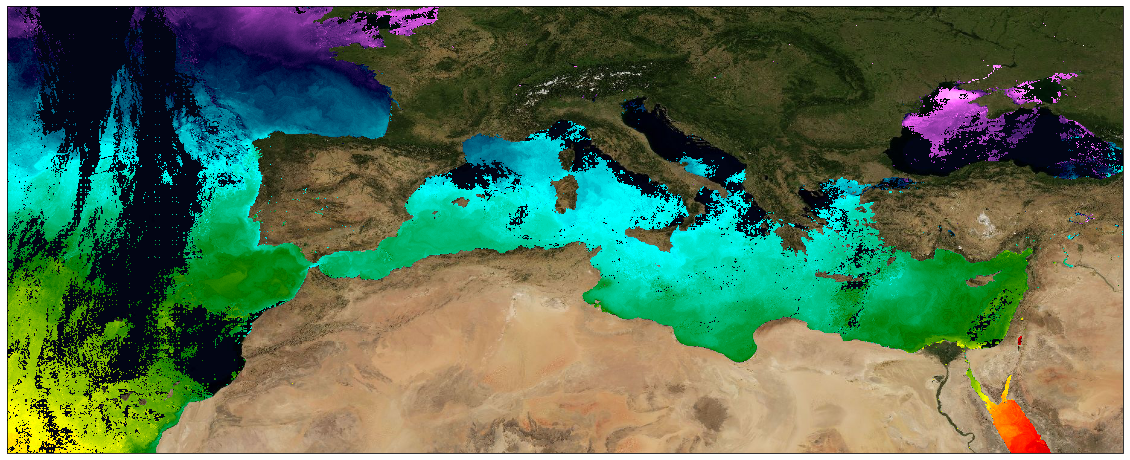
This dataset provide a times series of daily multi-sensor composite fields of Sea Surface Temperature (SST) foundation at ultra high resolution (UHR) on a 0.02 x 0.02 degree grid (approximately 2 x 2 km) over Mediterranean Sea, every 24 hours. Whereas along swath observation data essentially represent the skin or sub-skin SST, the L3S SST product is defined to represent the SST foundation (SSTfnd). SSTfnd is defined within GHRSST as the temperature at the base of the diurnal thermocline. It is so named because it represents the foundation temperature on which the diurnal thermocline develops during the day. SSTfnd changes only gradually along with the upper layer of the ocean, and by definition it is independent of skin SST fluctuations due to wind- and radiation-dependent diurnal stratification or skin layer response. It is therefore updated at intervals of 24 hrs. SSTfnd corresponds to the temperature of the upper mixed layer which is the part of the ocean represented by the top-most layer of grid cells in most numerical ocean models. It is never observed directly by satellites, but it comes closest to being detected by infrared and microwave radiometers during the night, when the previous day's diurnal stratification can be assumed to have decayed. The processing combines the observations of multiple polar orbiting and geostationary satellites, embedding infrared of microwave radiometers. All these sources are intercalibrated with each other before merging. A ranking procedure is used to select the best sensor observation for each grid point. The processing is the same (minus the optimal interpolation step) as for the Atlantic Near Real Time (NRT) L3S dataset available on Copernicus Marine Service [SST_ATL_PHY_L3S_NRT_010_037 dataset] and users can refer to the user manual and quality information documents available there for more details. This dataset is generated daily within a 24 delay and is therefore suitable for assimilation into operational models.
-
In recent years, large datasets of in situ marine carbonate system parameters (partial pressure of CO2 (pCO2), total alkalinity, dissolved inorganic carbon and pH) have been collated. These carbonate system datasets have highly variable data density in both space and time, especially in the case of pCO2, which is routinely measured at high frequency using underway measuring systems. This variation in data density can create biases when the data are used, for example for algorithm assessment, favouring datasets or regions with high data density. A common way to overcome data density issues is to bin the data into cells of equal latitude and longitude extent. This leads to bins with spatial areas that are latitude and projection dependent (eg become smaller and more elongated as the poles are approached). Additionally, as bin boundaries are defined without reference to the spatial distribution of the data or to geographical features, data clusters may be divided sub-optimally (eg a bin covering a region with a strong gradient). To overcome these problems and to provide a tool for matching in situ data with satellite, model and climatological data, which often have very different spatiotemporal scales both from the in situ data and from each other, a methodology has been created to group in situ data into ‘regions of interest’, spatiotemporal cylinders consisting of circles on the Earth’s surface extending over a period of time. These regions of interest are optimally adjusted to contain as many in situ measurements as possible. All in situ measurements of the same parameter contained in a region of interest are collated, including estimated uncertainties and regional summary statistics. The same grouping is done for each of the other datasets, producing a dataset of matchups. About 35 million in situ datapoints were then matched with data from five satellite sources and five model and re-analysis datasets to produce a global matchup dataset of carbonate system data, consisting of 287,000 regions of interest spanning 54 years from 1957 to 2020. Each region of interest is 100 km in diameter and 10 days in duration. An example application, the reparameterisation of a global total alkalinity algorithm, is shown. This matchup dataset can be updated as and when in situ and other datasets are updated, and similar datasets at finer spatiotemporal scale can be constructed, for example to enable regional studies. This dataset was funded by ESA Satellite Oceanographic Datasets for Acidification (OceanSODA) project which aims at developing the use of satellite Earth Observation for studying and monitoring marine carbonate chemistry. **This version is now superseded by the version 4 with higher spatial and temporal resolution**
-
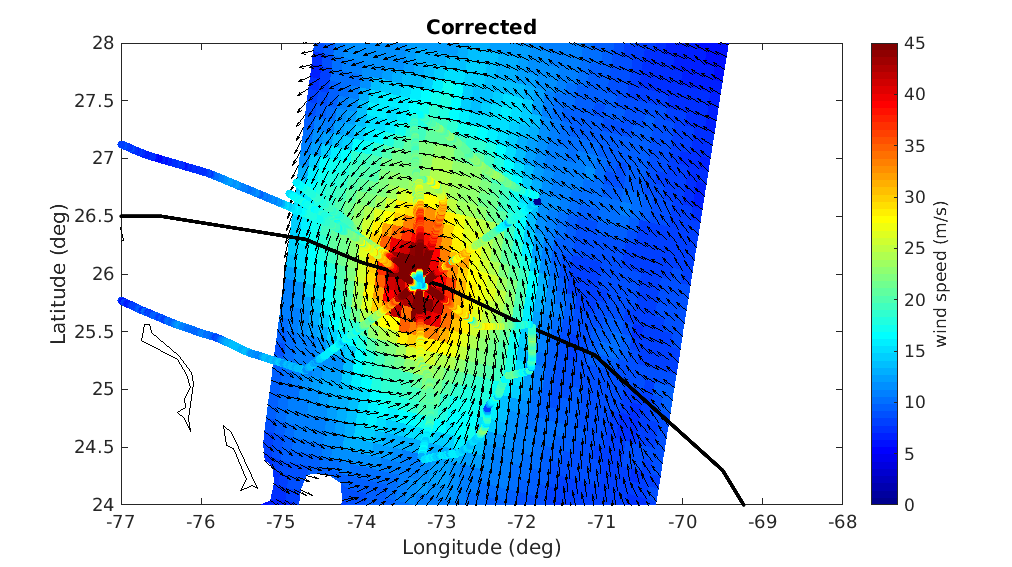
A prerequisite for a successful development of a multi-mission wind dataset is to ensure good inter-calibration of the different extreme wind datasets to be integrated in the product. Since the operational hurricane community is working with the in-situ dropsondes as wind speed reference, which are in turn used to calibrate the NOAA Hurricane Hunter Stepped Frequency Microwave Radiometer (SFMR) wind data, MAXSS has used the latter to ensure extreme-wind inter-calibration among the following scatterometer and radiometer systems: the Advanced Scatterometers onboard the Metop series (i.e., ASCAT-A, -B, and -C), the scatterometers onboard Oceansat-2 (OSCAT) and ScatSat-1 (OSCAT-2), and onboard the HY-2 series (HSCAT-A, -B); the Advanced Microwave Scanning Radiometer 2 onboard GCOM-W1(AMSR-2), the multi-frequency polarimetric radiometer (Windsat), and the L-band radiometers onboard the Soil Moisture and Ocean Salinity (SMOS) and the Soil Moisture Active Passive (SMAP) missions. In summary, a two-step strategy has been followed to adjust the high and extreme wind speeds derived from the mentioned scatterometer and radiometer systems, available in the period 2009-2020. First, the C-band ASCATs have been adjusted against collocated storm-motion centric SFMR wind data. Then, both SFMR winds and ASCAT adjusted winds have been used to adjust all the other satellite wind systems. In doing so, a good inter-calibration between all the systems is ensured not only under tropical cyclone (TC) conditions, but also elsewhere. This dataset was produced in the frame of the ESA funded Marine Atmosphere eXtreme Satellite Synergy (MAXSS) project. The primary objective of the ESA Marine Atmosphere eXtreme Satellite Synergy (MAXSS) project is to provide guidance and innovative methodologies to maximize the synergetic use of available Earth Observation data (satellite, in situ) to improve understanding about the multi-scale dynamical characteristics of extreme air-sea interaction.
-
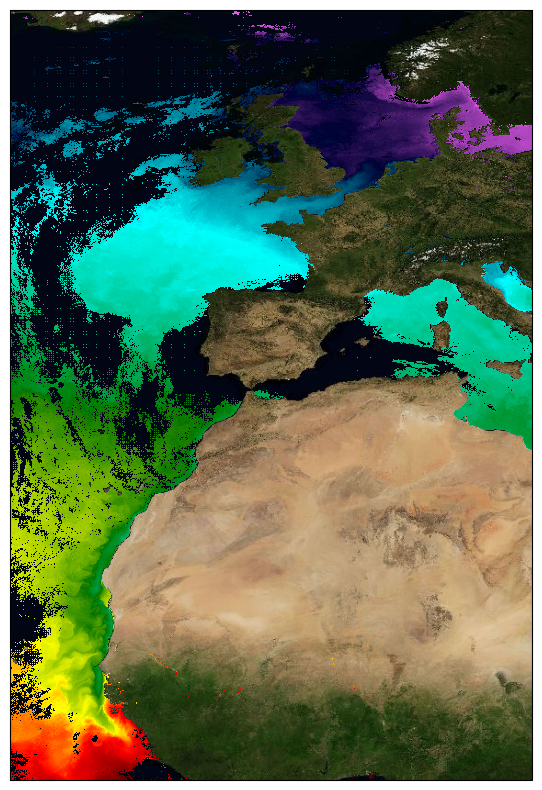
This dataset provide a times series of daily multi-sensor composite fields of Sea Surface Temperature (SST) foundation at ultra high resolution (UHR) on a 0.02 x 0.02 degree grid (approximately 2 x 2 km) for the North-East Atlantic (European North West shelf, Iberia, Bay of Biscay, Irish Sea down to Canary upwelling), every 24 hours. Whereas along swath observation data essentially represent the skin or sub-skin SST, the L3S SST product is defined to represent the SST foundation (SSTfnd). SSTfnd is defined within GHRSST as the temperature at the base of the diurnal thermocline. It is so named because it represents the foundation temperature on which the diurnal thermocline develops during the day. SSTfnd changes only gradually along with the upper layer of the ocean, and by definition it is independent of skin SST fluctuations due to wind- and radiation-dependent diurnal stratification or skin layer response. It is therefore updated at intervals of 24 hrs. SSTfnd corresponds to the temperature of the upper mixed layer which is the part of the ocean represented by the top-most layer of grid cells in most numerical ocean models. It is never observed directly by satellites, but it comes closest to being detected by infrared and microwave radiometers during the night, when the previous day's diurnal stratification can be assumed to have decayed. The processing combines the observations of multiple polar orbiting and geostationary satellites, embedding infrared of microwave radiometers. All these sources are intercalibrated with each other before merging. A ranking procedure is used to select the best sensor observation for each grid point. The processing is described on Copernicus Marine Service [SST_ATL_PHY_L3S_NRT_010_037 dataset] and users can refer to the user manual and quality documents available there for more details. This dataset is generated daily within a 24 delay and is therefore suitable for assimilation into operational models. It is produced in the frame of Copernicus Marine Service and the data available through various tools and protocols with a simple user registration from this service (product identifier: SST_ATL_PHY_L3S_NRT_010_037) at: https://data.marine.copernicus.eu/product/SST_ATL_PHY_L3S_NRT_010_037/
-

The Sentinel-6 Level-2P skewness products was developed to estimate the skewness from Sentinel-6 LR (Low Resolution Mode) and HR (High Resolution Mode) acquisitions. That demonstration product is generated by different retracking processes, provides an initial estimation of such a phenomenon and allows a finer description of the sea state.