 Catalogue PIGMA
/Observational data/satellite
Type of resources
Available actions
Topics
Keywords
Contact for the resource
Provided by
Years
Formats
Representation types
Update frequencies
status
Scale
Resolution
-

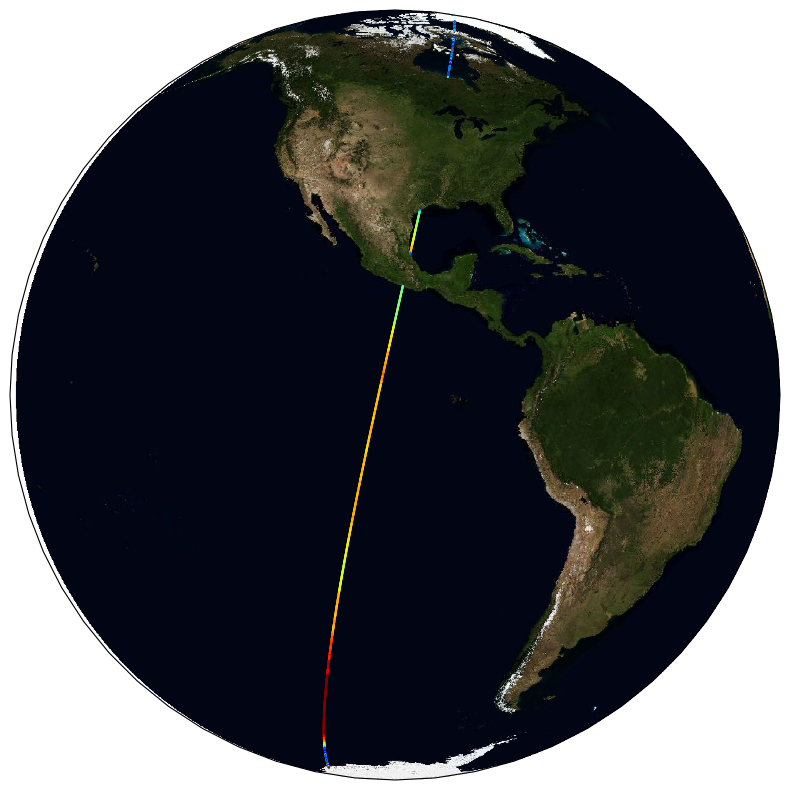
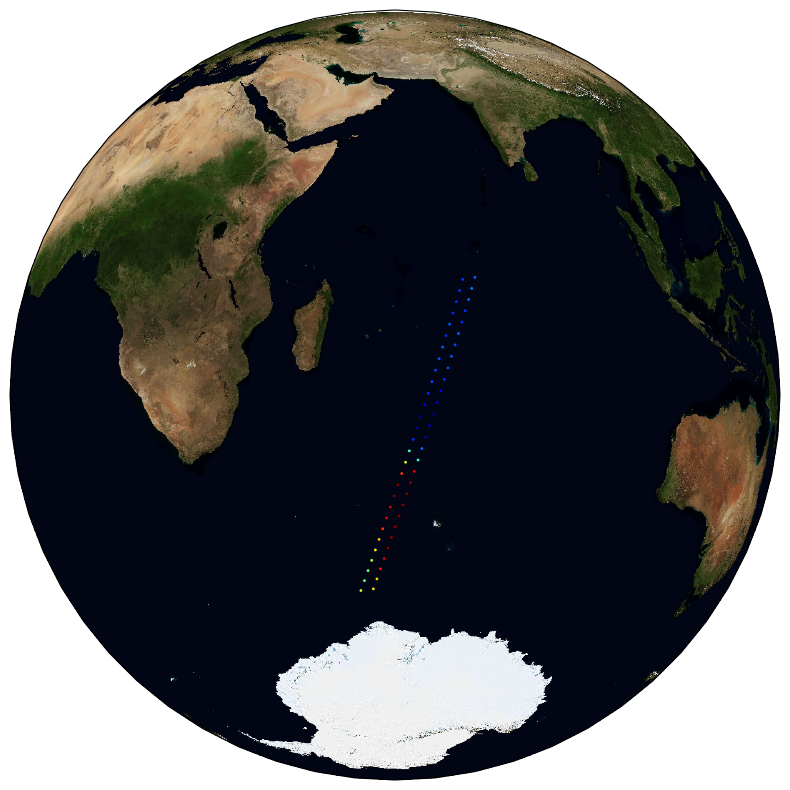
These gridded products are produced from the following upstream data: - for satellites SARAL/AltiKa, Cryosat-2, HaiYang-2B, Jason-3, Copernicus Sentinel-3A/B, Sentinel-6 MF, SWOT Nadir => NRT (Near-Real-Time) Nadir along-track (or Level-3) SEA LEVEL products (DOI: https://doi.org/10.48670/moi-00147) delivered by the Copernicus Marine Service (http://marine.copernicus.eu/ ). The gridded product is based on near-real-time (NRT) Level-3 Nadir datasets for the period from July 7, 2025, to December 31, 2025. => MY (Multi-Year) Nadir along-track (or Level-3) SEA LEVEL products (DOI: https://doi.org/10.48670/moi-00146 ) delivered by the Copernicus Marine Service (CMEMS, http://marine.copernicus.eu/ ). The gridded product is based on MY Level-3 Nadir datasets for the period from March 28, 2023, to July 6, 2025. - for SWOT KaRIn : the L3_LR_SSH Expert v3.0 product distributed by AVISO (DOI: https://doi.org/10.24400/527896/A01-2023.018) from March 28, 2023 to December 31, 2025. One mapping algorithm is proposed: the MIOST approach which provides which provides global Sea Surface Height (SSH) solutions. The MIOST method is capable of accounting for various modes of ocean surface topography variability (e.g., geostrophic, barotropic, equatorial wave dynamics) by constructing multiple independent components within a predefined covariance model.
-
Archive de toutes les données de température de surface (SST) satellite produites dans le cadre du projet international GHRSST. Ifremer est un GDAC pour ces données, miroir du GDAC NASA/JPL. Ces données sont utilisées pour la génération de produits multi-capteurs (CMEMS, Medspiration) mais également dans le cadre d'un grand nombre d'études ou projets nécessitant l'utilisation de mesures de SST. L'archive regroupe plusieurs jeux de données provenant de différents satellite ainsi que des données in situ de référence pour leur validation. Elle est mise à jour en temps quasi-réel depuis 10 ans, avec service de diffusion opérationnelle associé (FTP et HTTP). Une fiche sextant (issue du catalogue CERSAT) sera fournie pour chaque dataset dans cette archive.
-
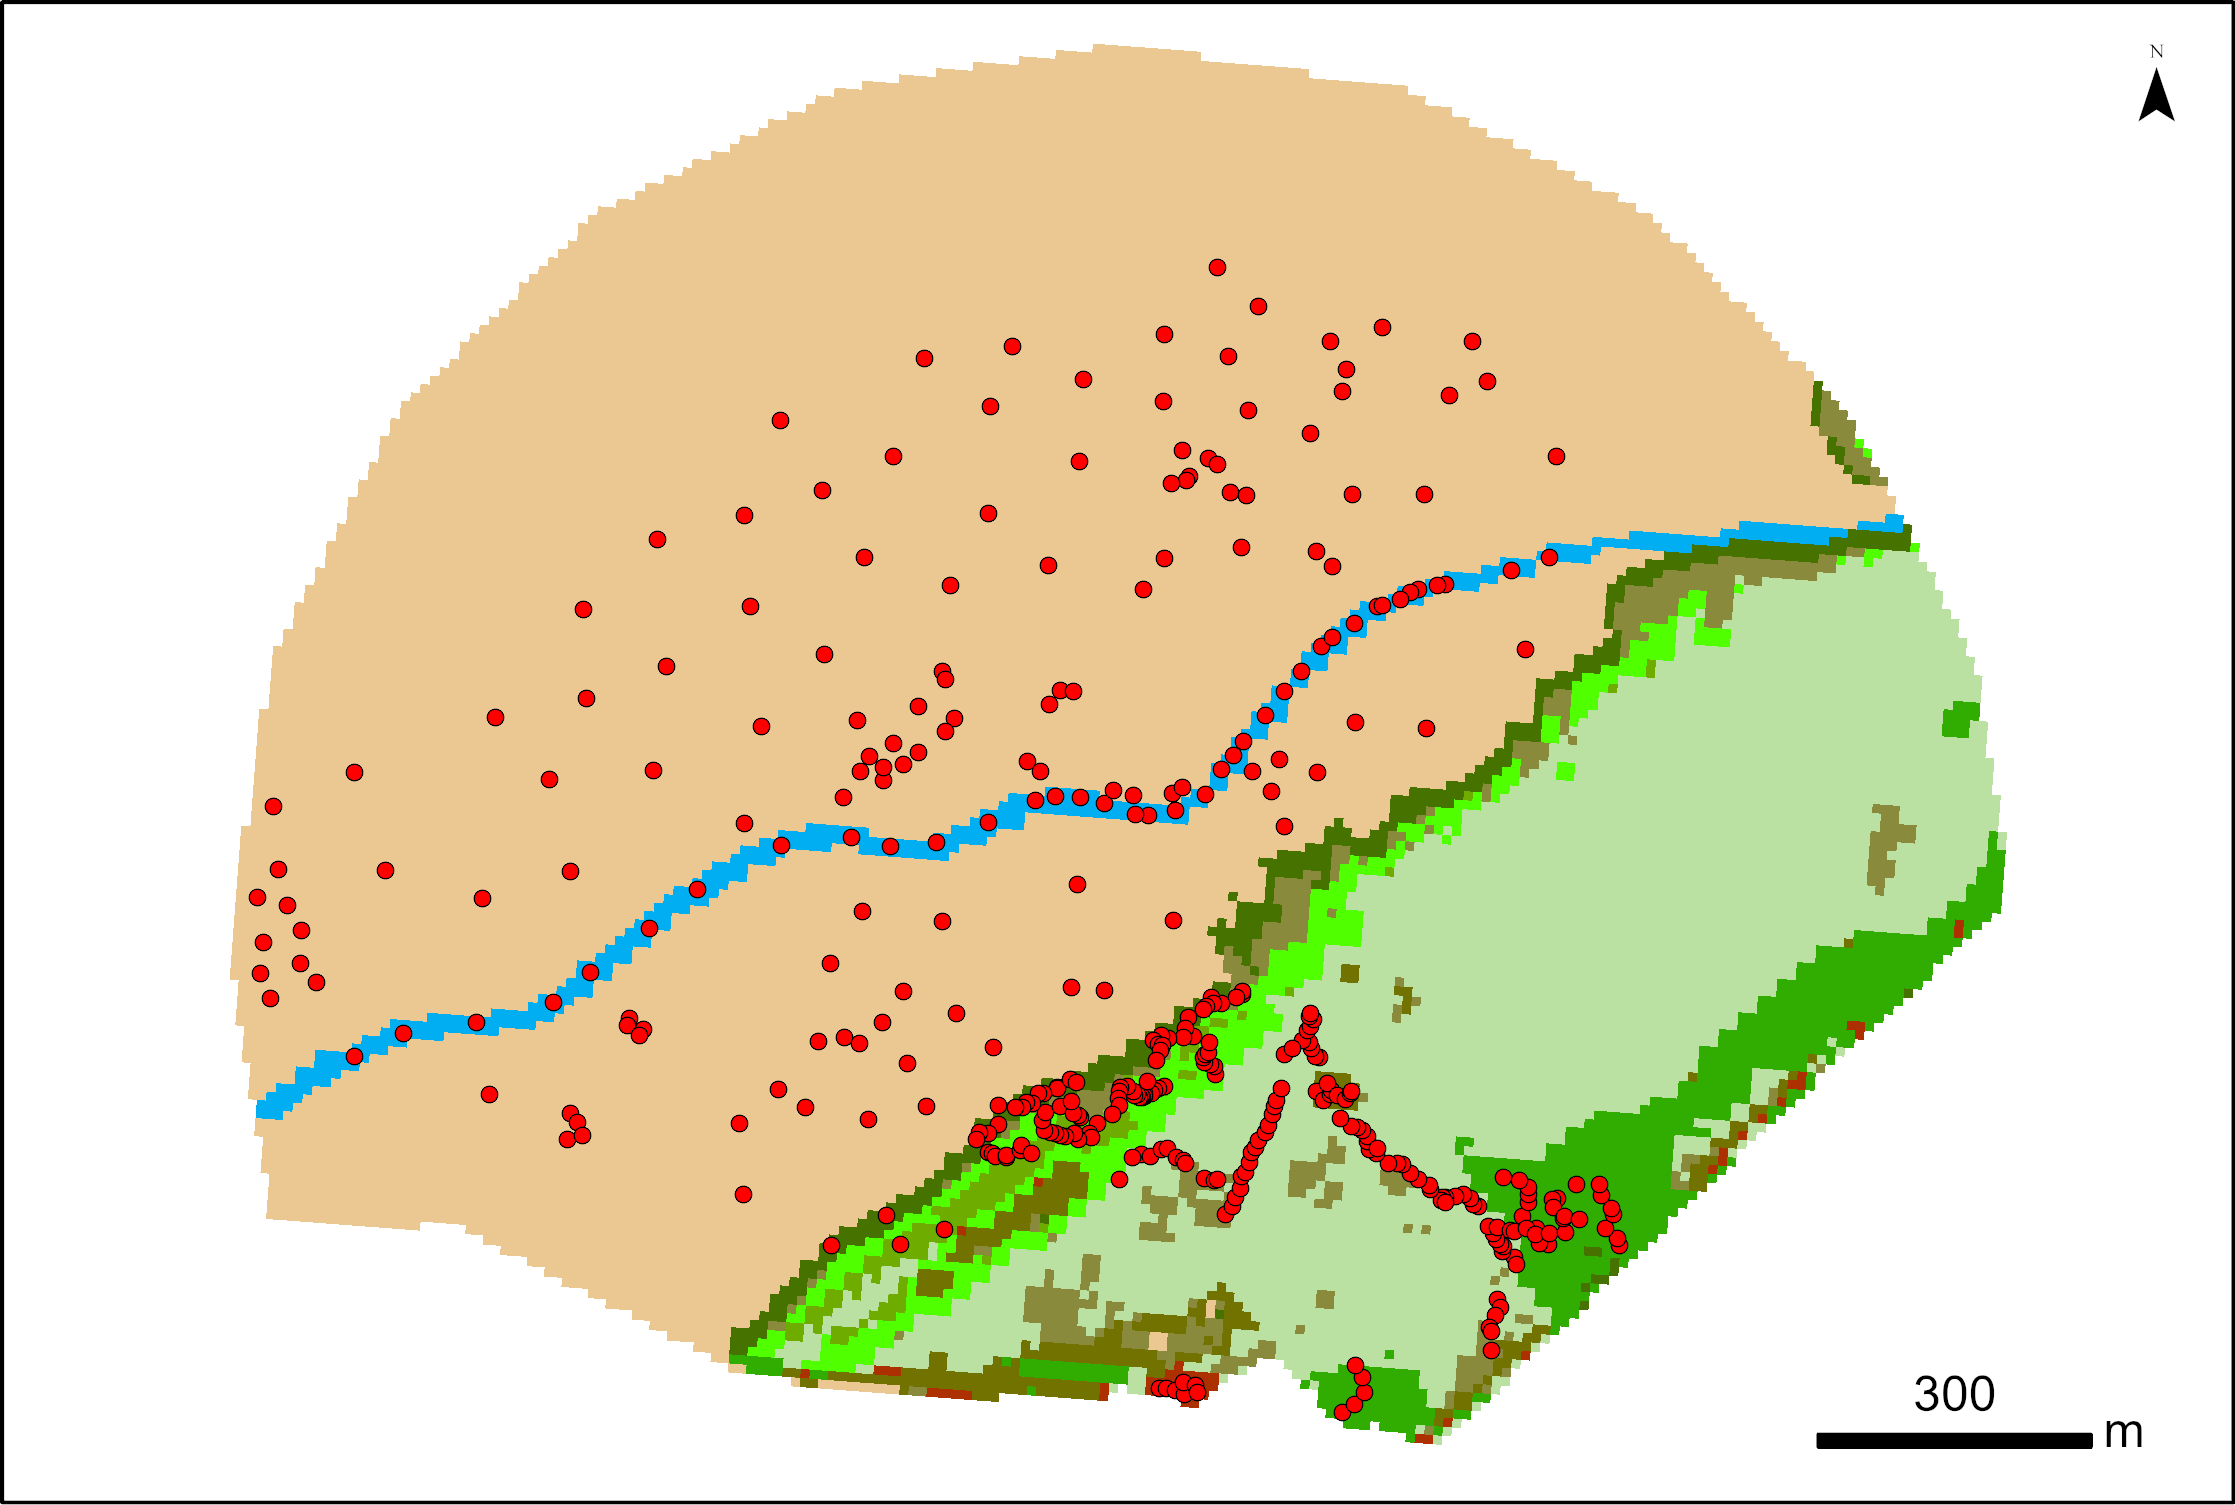
387 points were surveyed with a SP80 DGPS by Maxime Paschal as part of the La Rochelle Zero Carbon Territory (LRTZC) project on 26/05/23. At each point, the type of vegetation was specified.
-
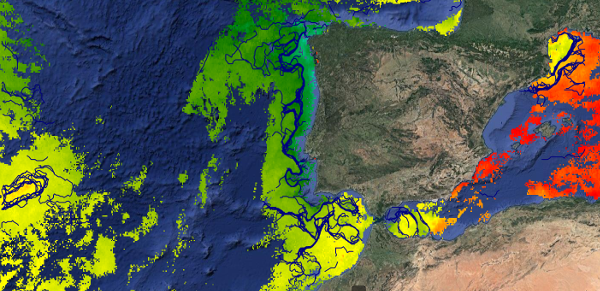
This dataset provides detections of fronts derived from high resolution remote sensing SST observations by SEVIRI L3C from OSISAF over Western Europe region. The data are available through HTTP and FTP; access to the data is free and open. In order to be informed about changes and to help us keep track of data usage, we encourage users to register at: https://forms.ifremer.fr/lops-siam/access-to-esa-world-ocean-circulation-project-data/ This dataset was generated by OceanDataLab and is distributed by Ifremer / CERSAT in the frame of the World Ocean Circulation (WOC) project funded by the European Space Agency (ESA).
-

This daily High-Resolution (HR) Level 3 gridded wind product is derived from Copernicus Sentinel-1 SAR (Synthetic Aperture Radar) observations, over the Mediterranean Sea ("MED" area). It is based on the European Space Agency (ESA) Level-2 OCN products at the highest available resolution. Although L2-OCN products already contain wind vectors, those are calculated using the CMOD5.n Geophysical Model Function (GMF) applied to the co-polarized (co-pol) VV channel (emitting in Vertical polarization and receiving in Vertical polarization). This VV GMF was mapped from scatterometer sensors (Hersbach et al., 2007) which are only able to use co-pol measurements. However, these co-pol GMF are known to lose sensitivity for wind above 20 m/s. Therefore, wind based on such GMF alone, are known to under-estimate wind speed (Polverari et al., 2022). For the L3 products winds based on SAR, we take advantage of the available cross-polarized (cross-pol) VH channel (emitting in Vertical polarization and receiving in Horizontal polarization) for which GMF were specifically derived based on C-Band SAR (Mouche et al., 2017, Mouche et al., 2019). Winds estimated from the combination of both the co-pol and cross-pol channels are referred to as dual-polarization (or dual-pol) winds. As shown in Mouche et al. (2019), taking advantage of the dual polarization strongly improves the wind estimation for high wind conditions thanks to the much greater VH channel sensitivity compared to VV. These new wind estimations are then gridded with a 0.012 degree resolution (between 0.5 and 1.2 km in zonal direction depending on the latitude and 1.3 km in meridional direction) using a cylindrical equidistant projection, independently for ascending and descending satellite passes and for each satellite (so 4 wind fields are available per day for two satellites). This dataset is generated over all Sentinel-1 mission time series starting from March 2018 and updated in delayed mode with a 4-months delay. It is also produced for 4 other different European areas. This dataset is produced and disseminated in the frame of Copernicus Marine Service.
-
This dataset contains all satellite altimeter wave heights above 9 m, from the following satellite missions: ERS-1, ERS-2, Topex-Poseidon (Topex only), Envisat, SARAL, Jason-1, Jason-2, Jason-3, Sentinel-3A, Sentinel-3B, Sentinel-6A, Cryosat-2, CFOSAT, SWOT. Storm event identification used the DetectHsStorm package developed by M. De Carlo and F. Ardhuin ( https://github.com/ardhuin/) . This data can be combined with modeled storm tracks (see F. Ardhuin, M. De Carlo, Storm tracks based on wave heights from LOPS WAVEWATCH III hindcast and ERA5 reanalysis, years 1991-2024, SEANOE (2025). doi: 10.17882/105148 )
-
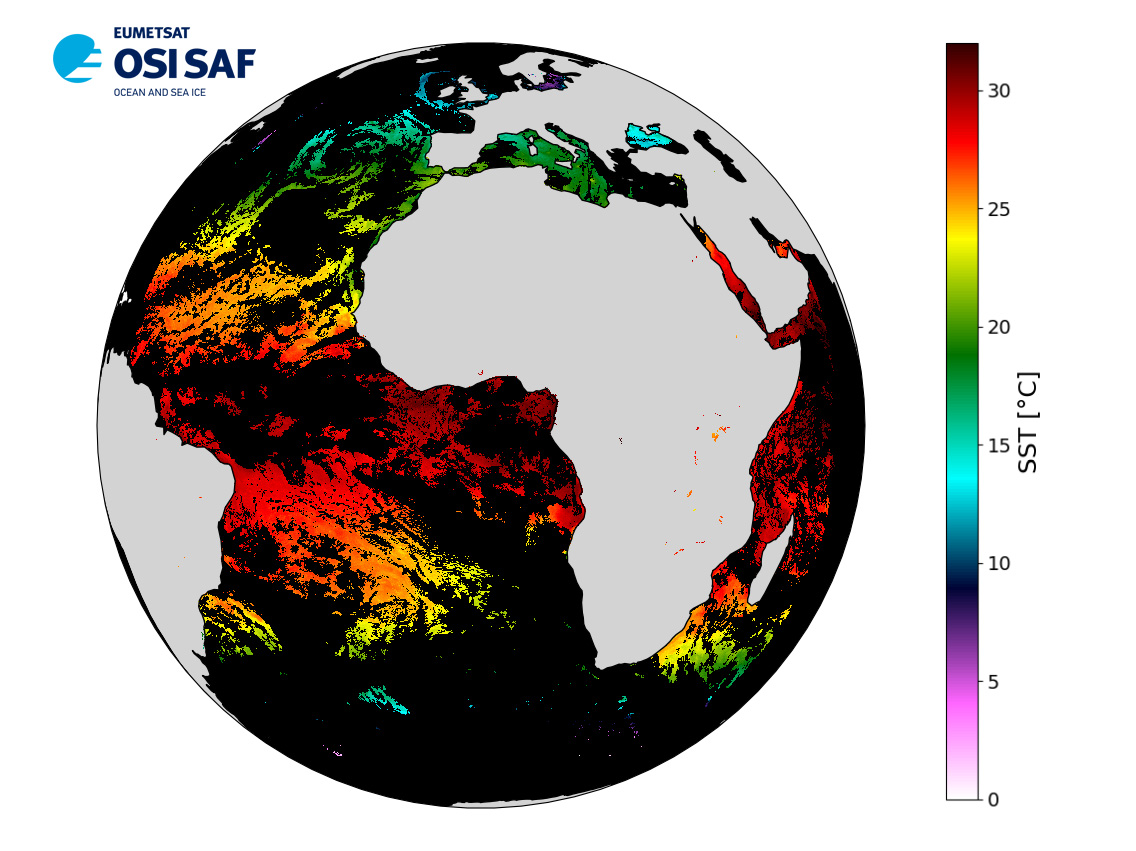
Level 3 hourly sub-skin Sea Surface Temperature derived from Meteosat at 0° longitude, covering 60S-60N and 60W-60E and re-projected on a 0.05° regular grid, in GHRSST compliant netCDF format. The satellite input data has successively come from Meteosat level 1 data processed at EUMETSAT. SST is retrieved from SEVIRI using a multi-spectral algorithm and a cloud mask. Atmospheric profiles of water vapor and temperature from a numerical weather prediction model, Sea Surface Temperature from an analysis, together with a radiative transfer model, are used to correct the multispectral algorithm for regional and seasonal biases due to changing atmospheric conditions.The quality of the products is monitored regularly by daily comparison of the satellite estimates against buoy measurements. The product format is compliant with the GHRSST Data Specification (GDS) version 2. Users are advised to use data only with quality levels 3, 4 and 5.
-
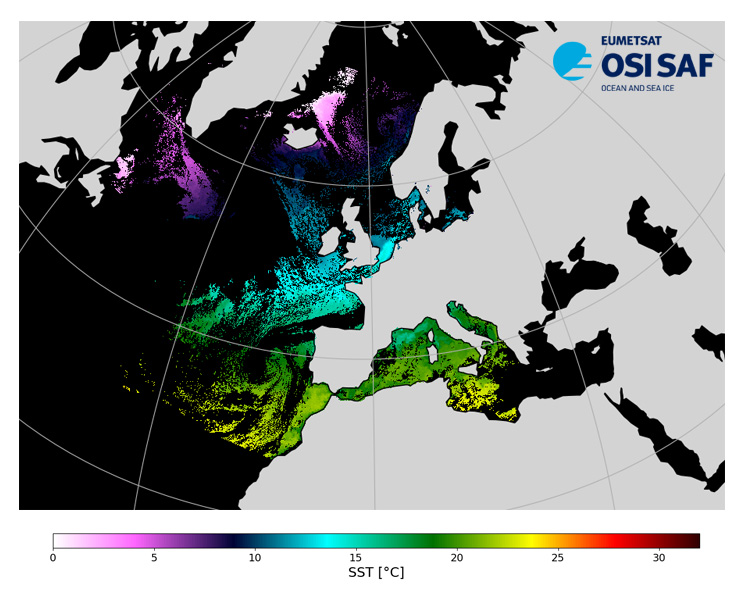
Level 3, four times a day, sub-skin Sea Surface Temperature derived from AVHRR on Metop satellites and VIIRS or AVHRR on NOAA and NPP satellites, over North Atlantic and European Seas and re-projected on a polar stereographic at 2 km resolution, in GHRSST compliant netCDF format. This catalogue entry presents NOAA-20 North Atlantic Regional Sea Surface Temperature. SST is retrieved from infrared channels using a multispectral algorithm and a cloud mask. Atmospheric profiles of water vapor and temperature from a numerical weather prediction model, Sea Surface Temperature from an analysis, together with a radiative transfer model, are used to correct the multispectral algorithm for regional and seasonal biases due to changing atmospheric conditions. The quality of the products is monitored regularly by daily comparison of the satellite estimates against buoy measurements. The product format is compliant with the GHRSST Data Specification (GDS) version 2.Users are advised to use data only with quality levels 3,4 and 5.
-
The ESA Sea State Climate Change Initiative (CCI) project has produced global multi-sensor time-series of along-track satellite altimeter significant wave height data (referred to as Level 2P (L2P) data) with a particular focus for use in climate studies. This dataset contains the Version 3 Remote Sensing Significant Wave Height product, which provides along-track data at approximately 6 km spatial resolution, separated per satellite and pass, including all measurements with flags, corrections and extra parameters from other sources. These are expert products with rich content and no data loss. The altimeter data used in the Sea State CCI dataset v3 come from multiple satellite missions spanning from 2002 to 2022021 (Envisat, CryoSat-2, Jason-1, Jason-2, Jason-3, SARAL, Sentinel-3A), therefore spanning over a shorter time range than version 1.1. Unlike version 1.1, this version 3 involved a complete and consistent retracking of all the included altimeters. Many altimeters are bi-frequency (Ku-C or Ku-S) and only measurements in Ku band were used, for consistency reasons, being available on each altimeter but SARAL (Ka band).
-
The ESA Sea State Climate Change Initiative (CCI) project has produced global multi-sensor time-series of along-track satellite synthetic aperture radar (SAR) integrated sea state parameters (ISSP) data from Sentinel-1 (referred to as SAR WV onboard Sentinel-1 Level 2P (L2P) ISSP data) with a particular focus for use in climate studies. This dataset contains the Sentinel-1 SAR Remote Sensing Integrated Sea State Parameter product (v1.0), which forms part of the ESA Sea State CCI version 3.0 release. This product provides along-track primary significant wave height measurements and secondary sea state parameters, calibrated with CMEMS model data and reference in situ measurements at 20km resolution every 100km, processed using the Pleskachevsky et. al., 2021 emprical model, separated per satellite and pass, including all measurements with flags and uncertainty estimates. These are expert products with rich content and no data loss. The SAR Wave Mode data used in the Sea State CCI SAR WV onboard Sentinel-1 Level 2P (L2P) ISSP v3 dataset come from the Sentinel-1 satellite missions spanning from 2014 to 2021 (Sentinel-1 A, Sentinel-1 B).