 Catalogue PIGMA
2000
Type of resources
Available actions
Topics
Keywords
Contact for the resource
Provided by
Years
Formats
Representation types
Update frequencies
status
Scale
Resolution
-
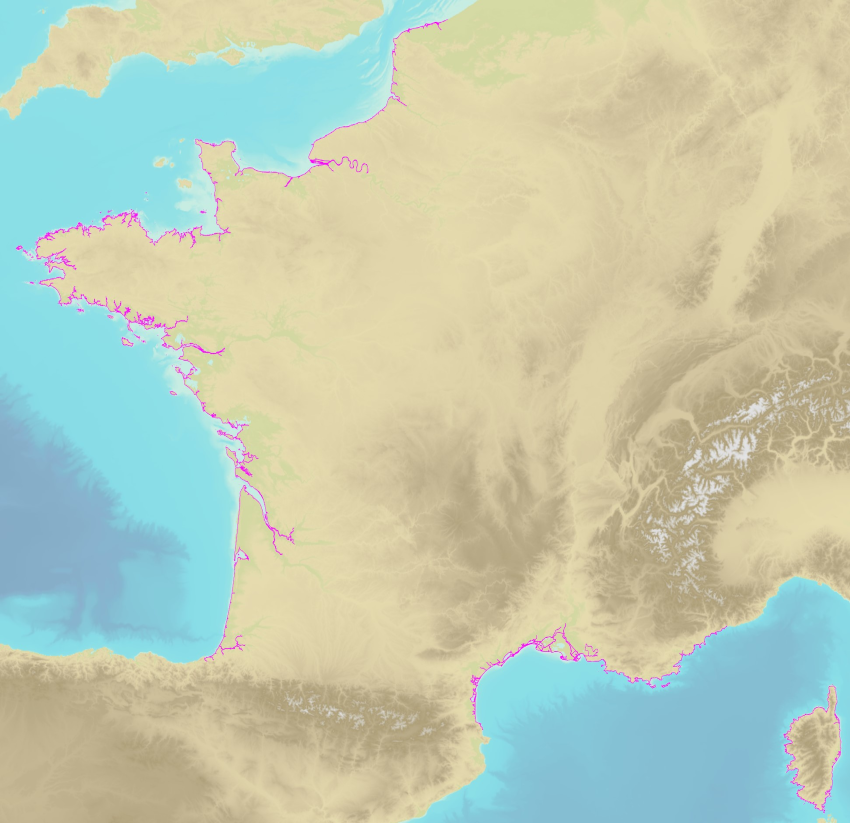
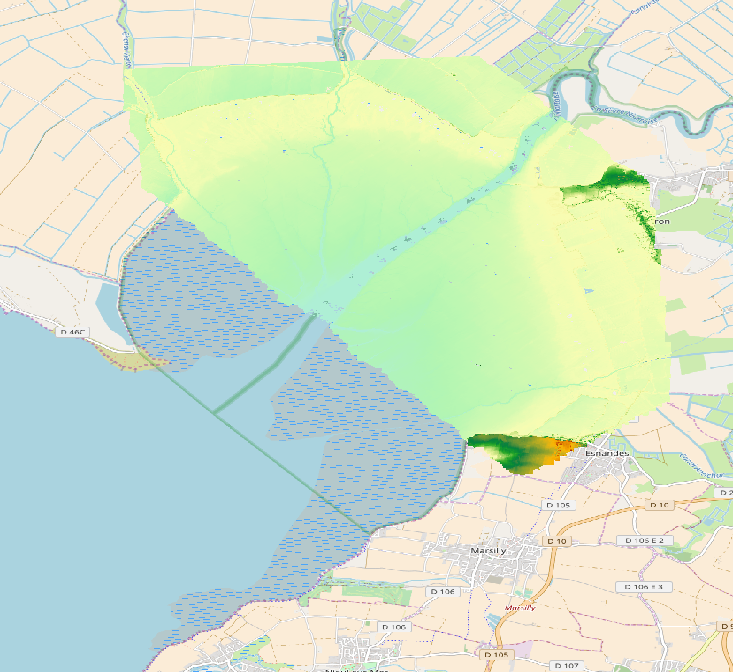
The land-sea limit corresponds to the Highest Astronomical Tide (HAT) in the case of a tide of coefficient 120 and under normal meteorological conditions (no offshore wind and mean atmospheric pressure of 1013 hPa). This geometric line is naturally defined as the intersection of a HAT model (extended to the coast and the top end of the upper estuary) based on the available Bathyelli surfaces, and a high-resolution digital terrain model of the coastal area. It corresponds to the highest limit of the intertidal area and takes into account, when they exist, the 3 administrative maritime limits which are: the transversal limit of the sea (LTM), the salt water limit (LSE) and the limit of maritime jurisdiction (LAM). This limit is measured (quoted) in relation to the local hydrographic chart datum and to the levels of reference for France (IGN69 and IGN78 for Corsica). Relations to other levels of reference (mean sea level and ellipsoid) are known. The land-sea limit product, mainly results from the exploitation of the two products Litto3D®/RGEALTI® and Bathyelli, and represents, with a metric resolution (1 to 5 metres), this theoretical entity by a set of 2D polylines describing the nature of the coast (artificial or natural, rocky or sandy, steep or flat, etc.). The method used for calculating the land-sea limit makes it possible to produce a continuous, homogeneous and spatially coherent limit on the entire French metropolitan coastal area.
-
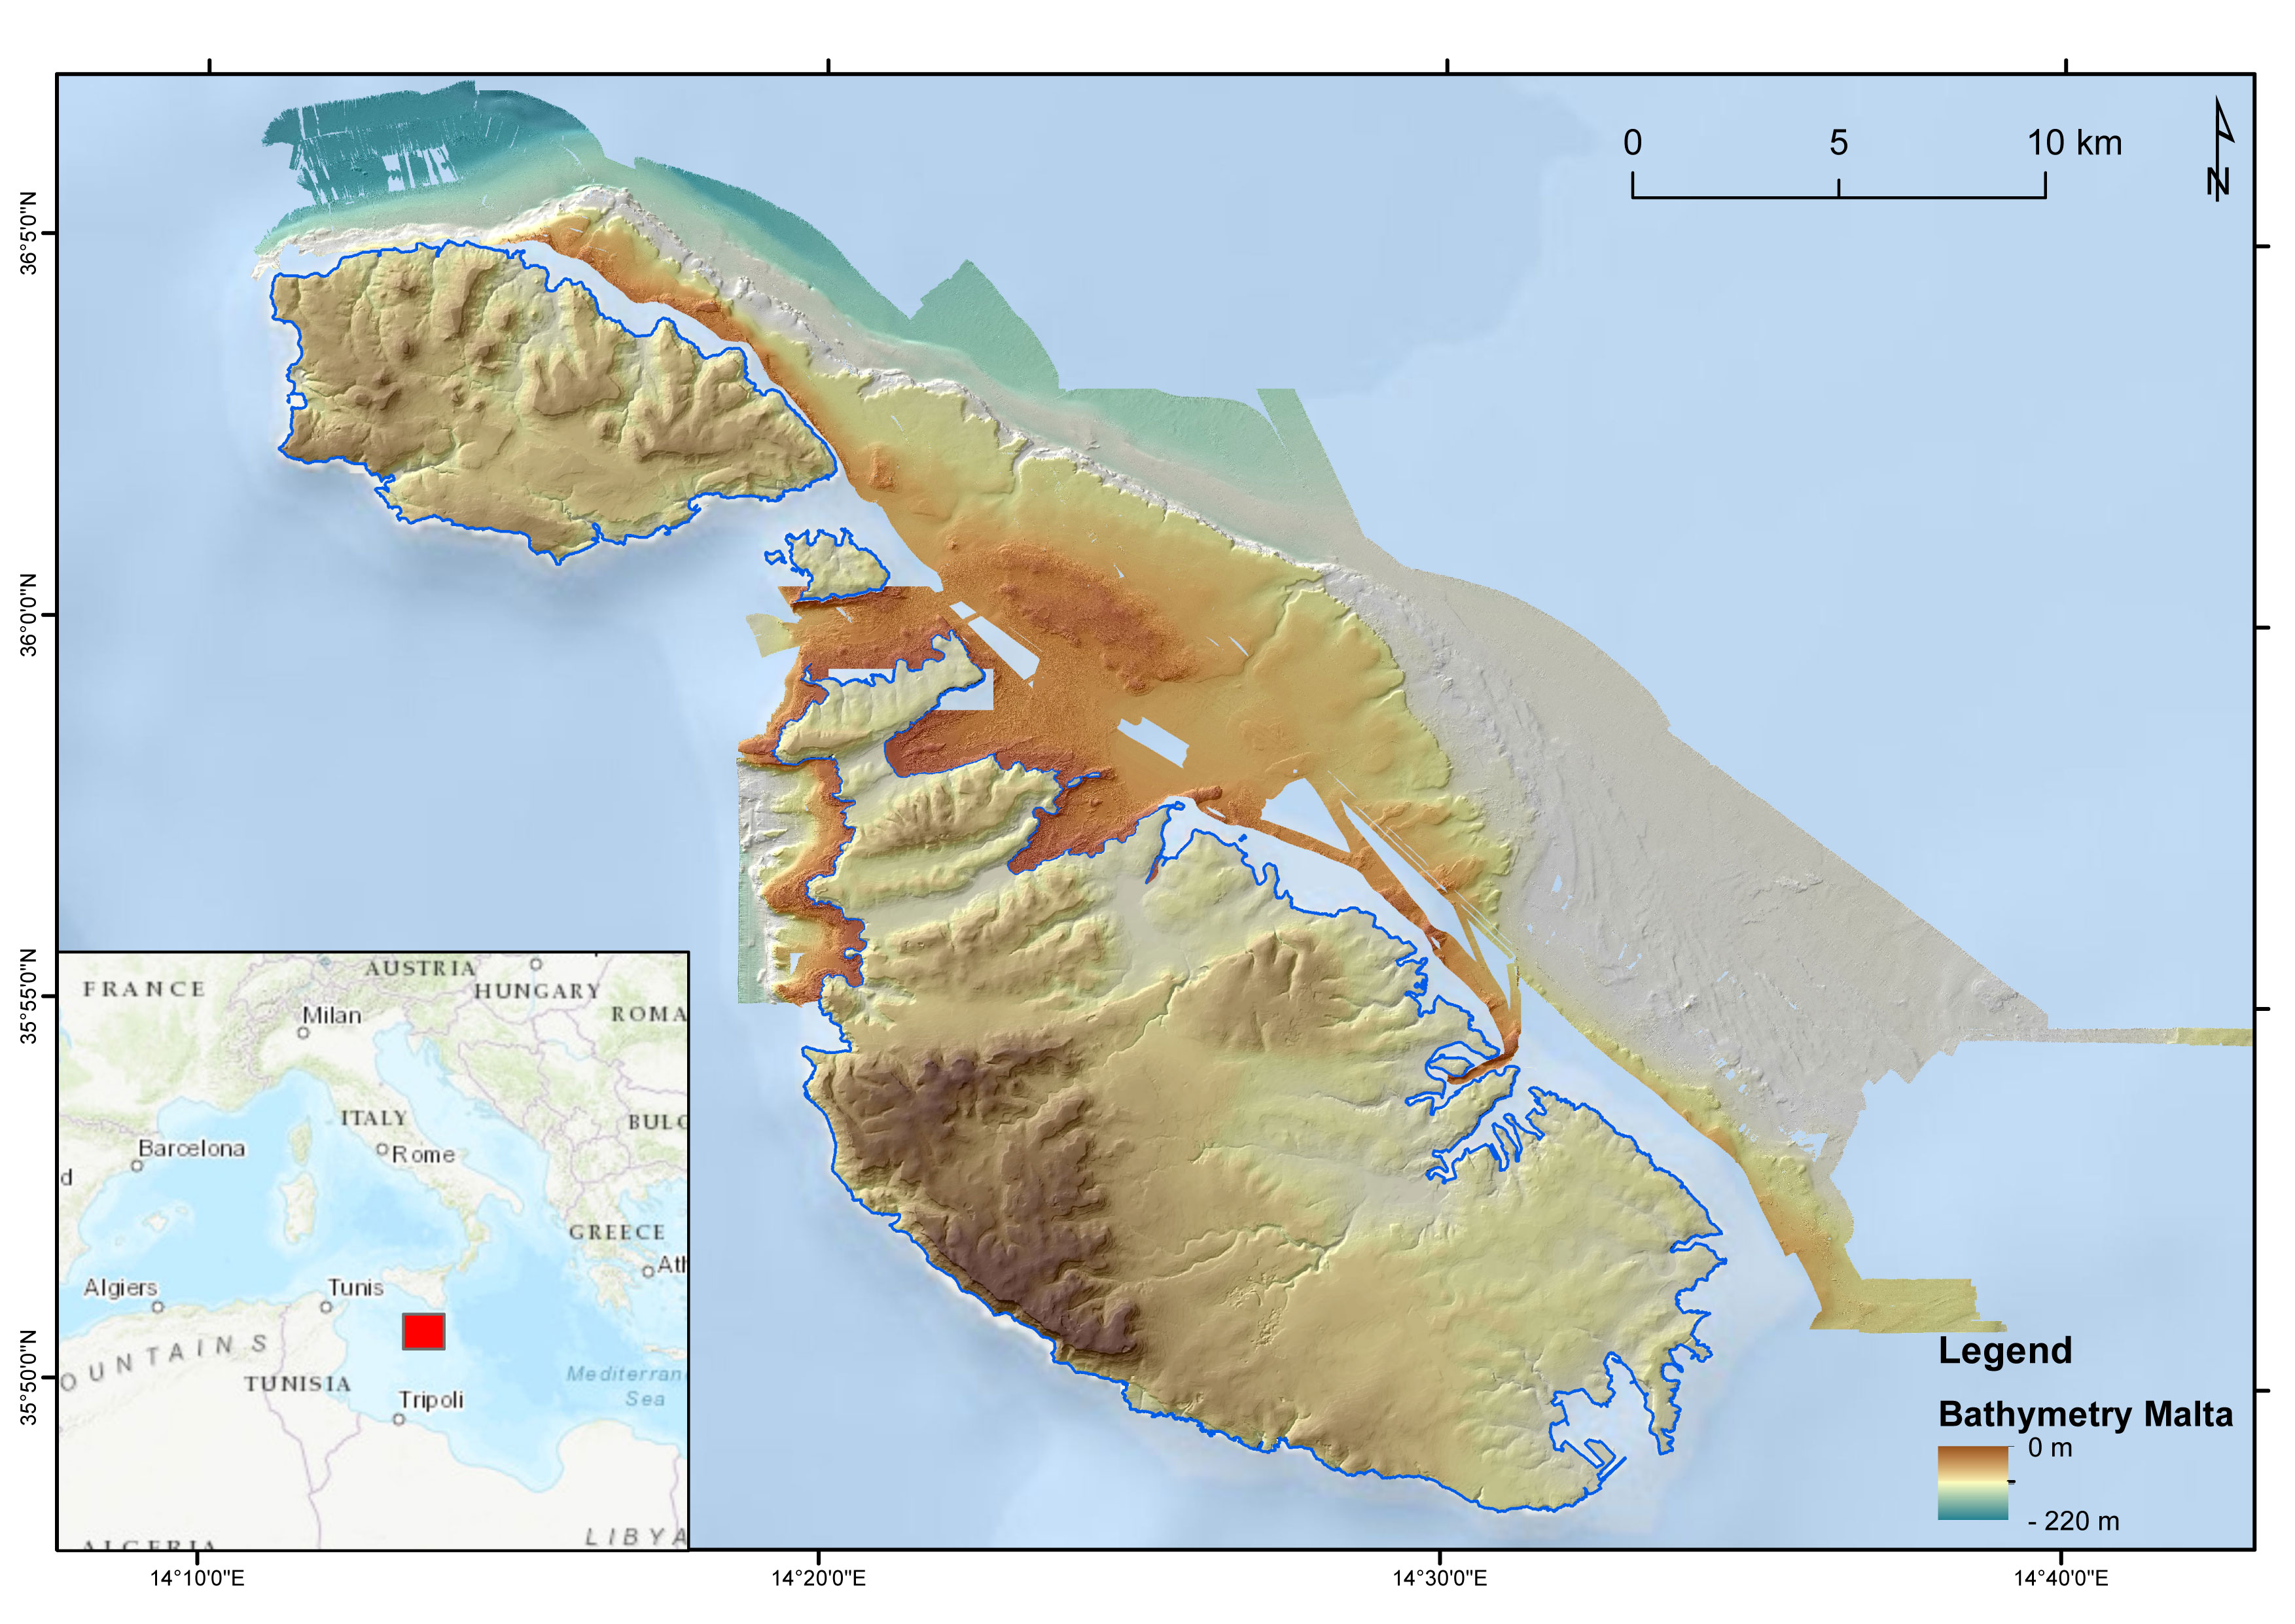
DTM of the Maltese seafloor resulting from the merge of 3 MBES-derived DTMs (cruises MEDCOR, DECORS and MAPSCAPE) and a bathymetric LiDAR-derived DTM (ERDF20112). Horizontal resolution of 2 m. It comprises the seabed offshore N Gozo, E Maltese Islands and NW Malta. The DTM refers to the following CDIs: 145_CNR-ISMAR-125, MAPSCAPE2012, 145_CNR-ISMAR-126, ERDF_LIDAR_2012
-
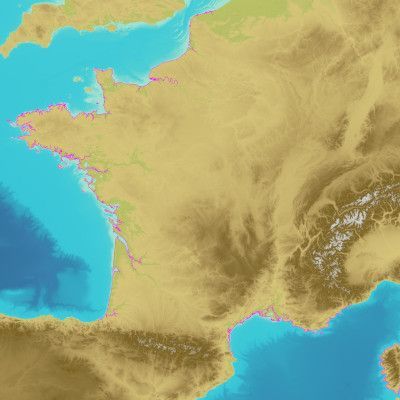
The land-sea limit corresponds to the Highest Astronomical Tide (HAT) in the case of a tide of coefficient 120 and under normal meteorological conditions (no offshore wind and mean atmospheric pressure of 1013 hPa). This geometric line is naturally defined as the intersection of a HAT model (extended to the coast and the top end of the upper estuary) based on the available Bathyelli surfaces, and a high-resolution digital terrain model of the coastal area. It corresponds to the highest limit of the intertidal area and takes into account, when they exist, the 3 administrative maritime limits which are: the transversal limit of the sea (LTM), the salt water limit (LSE) and the limit of maritime jurisdiction (LAM). This limit is measured (quoted) in relation to the local hydrographic chart datum and to the levels of reference for France (IGN69 and IGN78 for Corsica). Relations to other levels of reference (mean sea level and ellipsoid) are known. The land-sea limit product, mainly results from the exploitation of the two products Litto3D®/RGEALTI® and Bathyelli, and represents, with a metric resolution (1 to 5 metres), this theoretical entity by a set of 2D polylines describing the nature of the coast (artificial or natural, rocky or sandy, steep or flat, etc.). The method used for calculating the land-sea limit makes it possible to produce a continuous, homogeneous and spatially coherent limit on the entire French metropolitan coastal area.
-
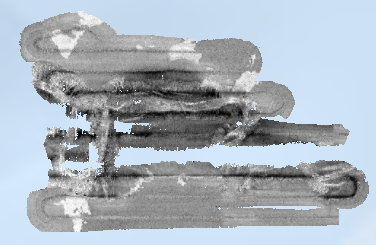
Rétrodiffusion du fond marin du canyon de Capbreton, dans le golfe de Gascogne (campagne SEDYMAQ3 en 2012), au pas de 1 mètre. Les données ont été acquises par le sondeur multifaisceau EM2040 du N/O Thalia. Description de la campagne : GILLET Hervé (2012) SEDYMAQ3 cruise, RV Thalia, https://doi.org/10.17600/12070080
-
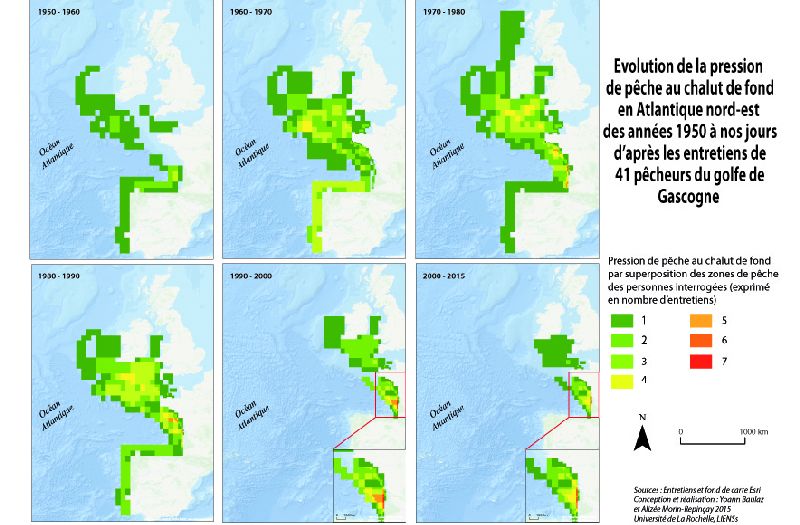
Informations relatives à l'évolution des zones de pêche en Atlantique Nord Est, par chalut de fond.
-
Réseau d'eau potable (canalisations et ouvrages de défense incendie) du syndicat intercommunal d'alimentation en eau potable et d'assainissement (SIAEPA) de Saint Selve (communes de Saint-Selve, Saint-Morillon, Saint-Michel-de-Rieufret)
-
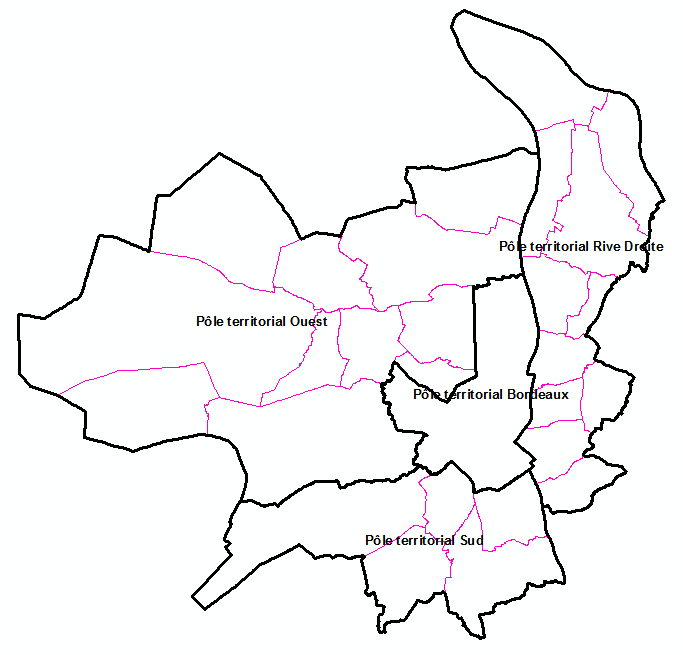
Ce jeu de données représente les périmètres d'interventions des 4 pôles territoriaux (PT) qui ont été créés le 1er janvier 2016 pour renforcer la territorialisation de Bordeaux Métropole dans le cadre de son projet de Métropolisation (Loi MAPTAM). Guichets pour les usagers et interlocuteurs pour les entrepreneurs, responsables des opérations d'investissement sur les espaces publics (voies et réseaux) ils participent à la conception des projets d'aménagement, formulent des avis sur les autorisations d'occupation du sol, relaient la «politique de la ville», suivent les transports scolaires, veillent sur les espaces publics. Ils ont une relation privilégiée avec les communes de leur périmètre. Un contrat d'engagement entre Bordeaux Métropole et les communes définit le niveau de service attendu pour chaque activité et permet d'organiser l'exercice des activités mutualisées au sein des services communs.
-
Données de relief acquises par levé au laser aéroporté. La donnée se présente au format Grid ArcInfo. L'altitude est exprimée en mètre (positif vers le zénith) par rapport au référentiel IGN69. Ce MNT est issu de données source de type "last pulse" (i.e. sol, bâtiments, sol sous la végétation), acquises en 2004. La méthode d'interpolation employée est le krigeage.
-
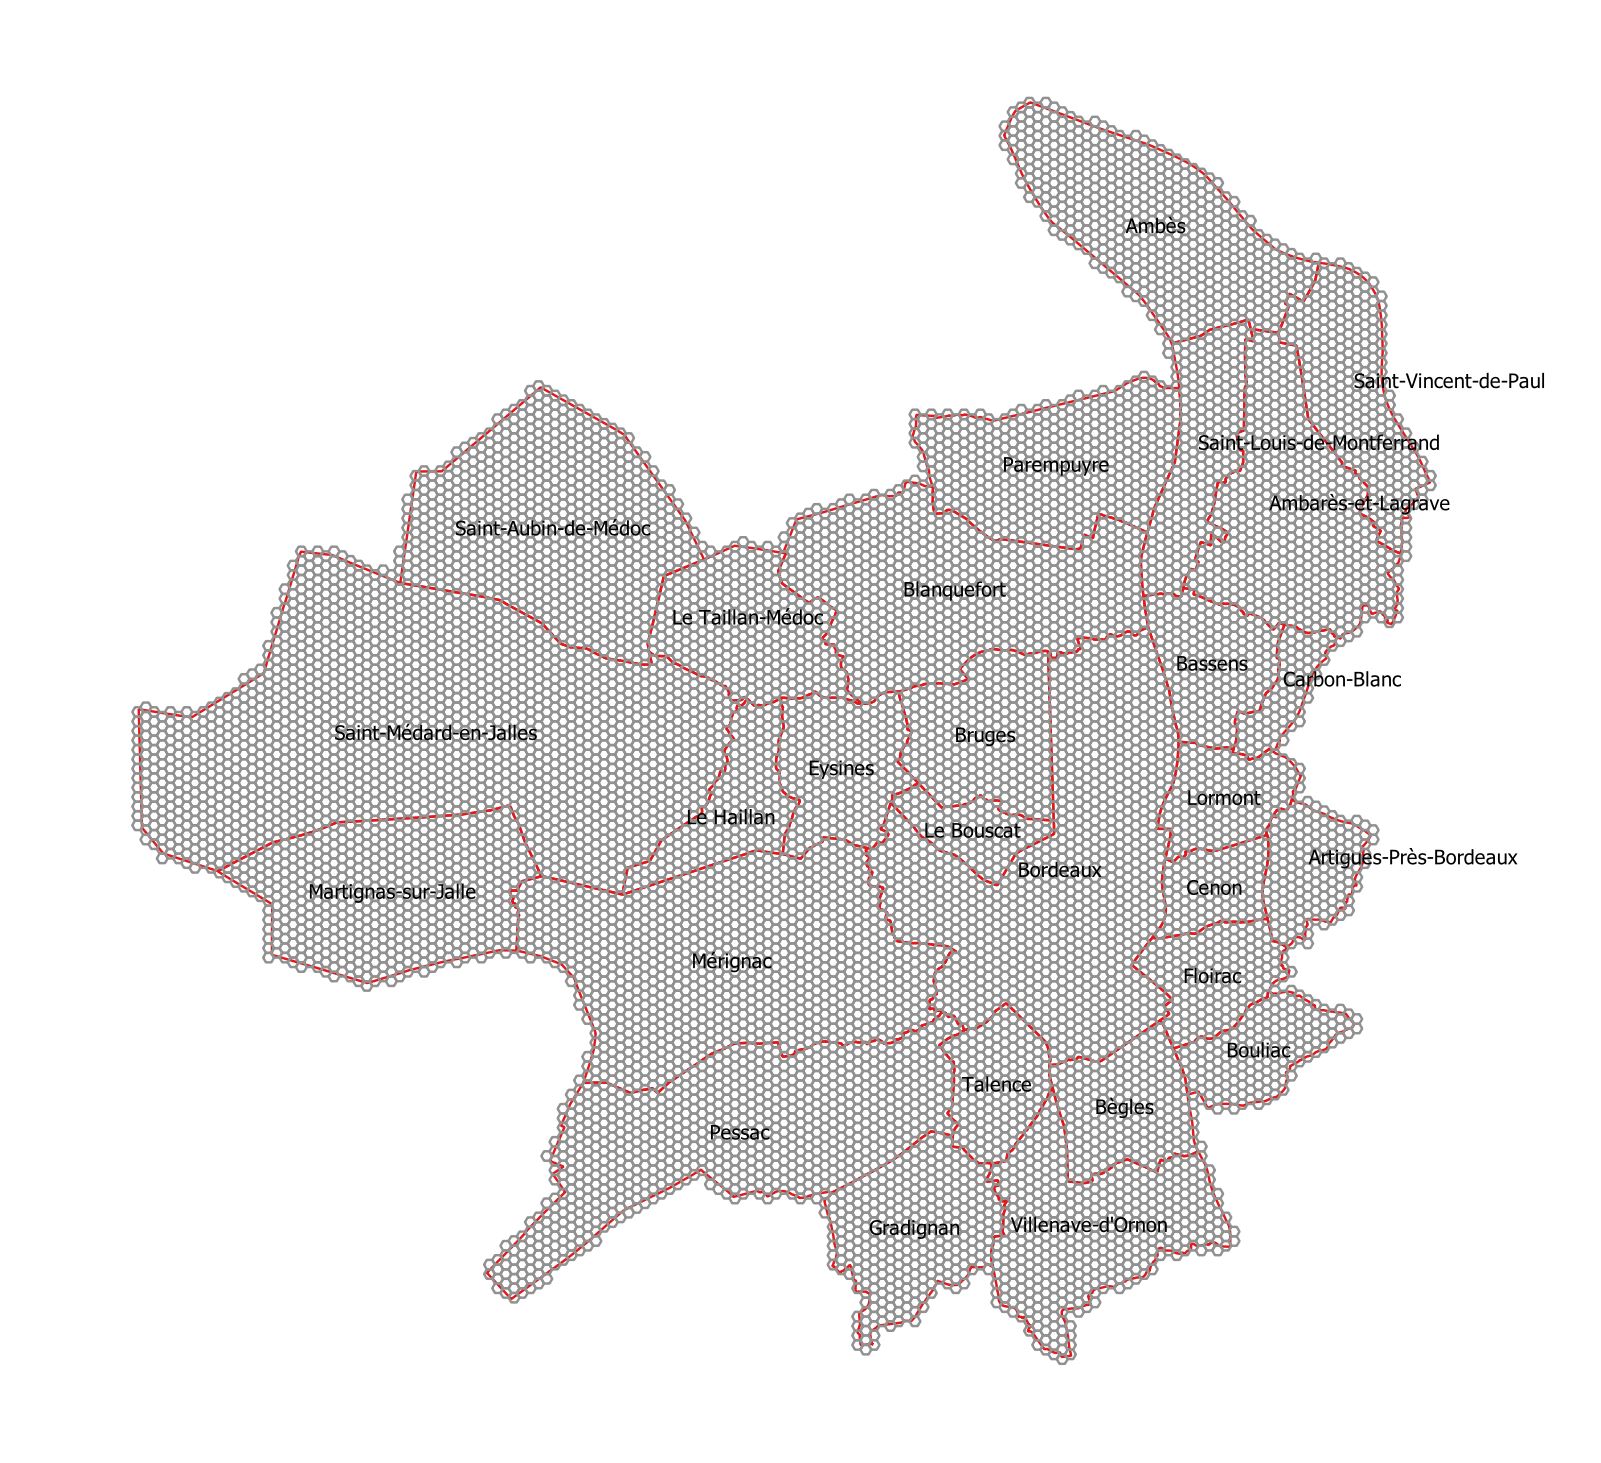
Ce jeu de données est une représentation uniforme de territoire de Bordeaux Métropole par mailles hexagonales de 250 mètre (espacement horizontal et vertical), mobilisable pour la production d'indicateurs territoriaux.
-
Carte Communale (CC) numérisée. Ce lot informe du droit à bâtir sur la commune de LA BOISSIERE D'ANS. Cette CC est numérisée conformément aux prescriptions nationales du CNIG.