 Catalogue PIGMA
European Environment Agency
Type of resources
Available actions
Topics
Keywords
Contact for the resource
Provided by
Years
Formats
Representation types
Update frequencies
status
Scale
Resolution
-
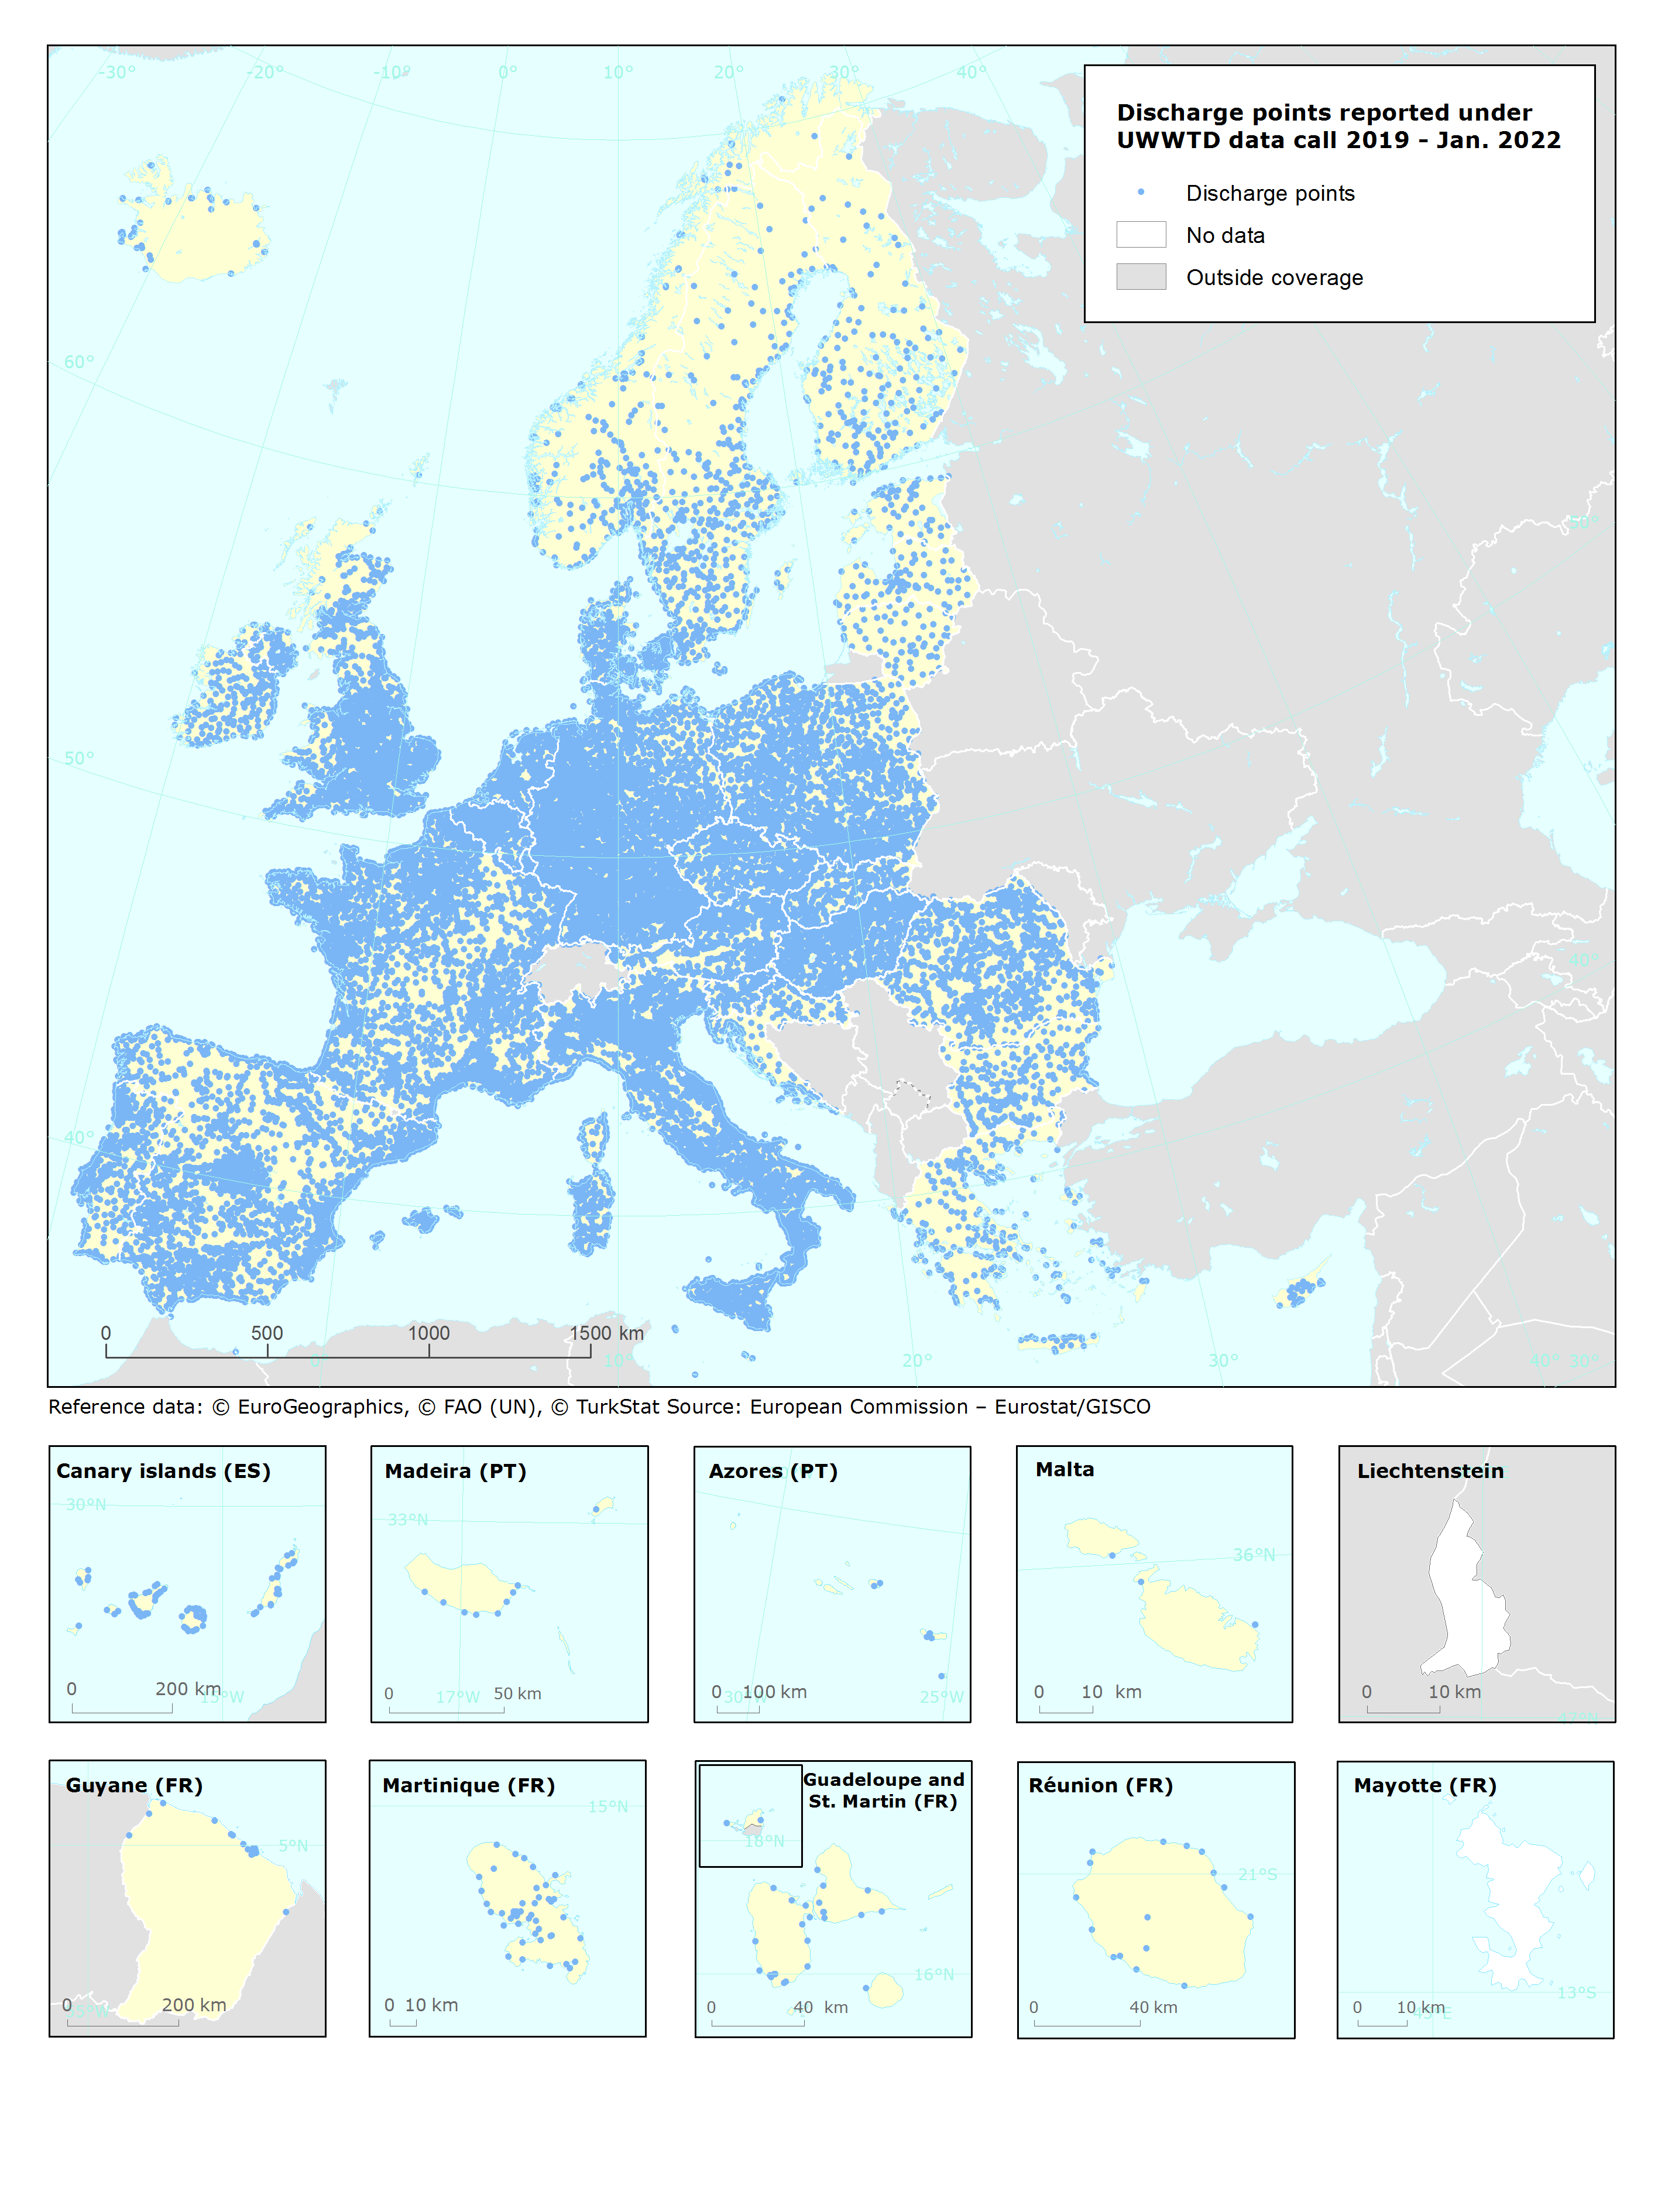
UWWTD Discharge Points, Jan. 2022 is one of the datasets produced within the frame of the reporting under 11th UWWTD Art.15 reporting period (UWWTD data call 2019). The Urban Waste Water Treatment Directive (UWWTD) (91/271/EEC) obliges Member States to report data on the implementation of the Directive upon request from the European Commission bi-annually. Reported data include receiving areas as designated under UWWTD, agglomerations, urban waste water treatment plants serving the agglomerations and points of discharges. Dataset UWWTD_DischargePoints contains information on individual points of discharge from urban waste water treatment plants or collecting systems, including their coordinates of discharge, link to specific treatment plant, type of receiving area into which the effluent / wastewater is discharged, related waterbody (or river basin), information on the discharge on land and potential reuse of the treated waste water. This dataset includes the reported discharge points which are displayed on the UWWTD maps (https://www.eea.europa.eu/themes/water/european-waters/water-use-and-environmental-pressures/uwwtd/interactive-maps/urban-waste-water-treatment-maps-3). The active discharge points with correct coordinates in the reported data were selected from the source European UWWTD tabular dataset, which is available on the download link https://www.eea.europa.eu/data-and-maps/data/waterbase-uwwtd-urban-waste-water-treatment-directive-7. The definition of the UWWTD Discharge Points dataset attributes (fields) is available on the link https://dd.eionet.europa.eu/datasets/latest/UWWTDArt15/tables/DischargePoints The full (internal) dataset including inactive discharge points is available under "Urban Waste Water Treatment Directive, Discharge points reported under UWWTD data call 2019 - INTERNAL VERSION, Jan. 2022". In comparison to the previous version (Nov. 2020), late redeliveries and corrections provided by several countries during 2021 are included in current revision. Next, the dataset is provided in GeoPackage and ESRI File geodatabase formats instead of shapefile used up to now, to avoid truncation of attribute names.
-
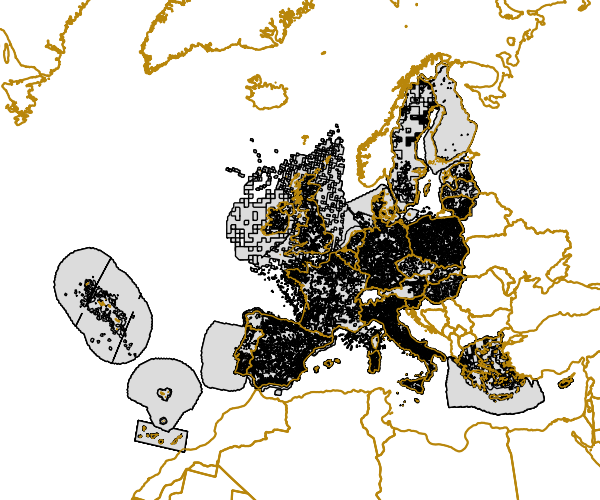
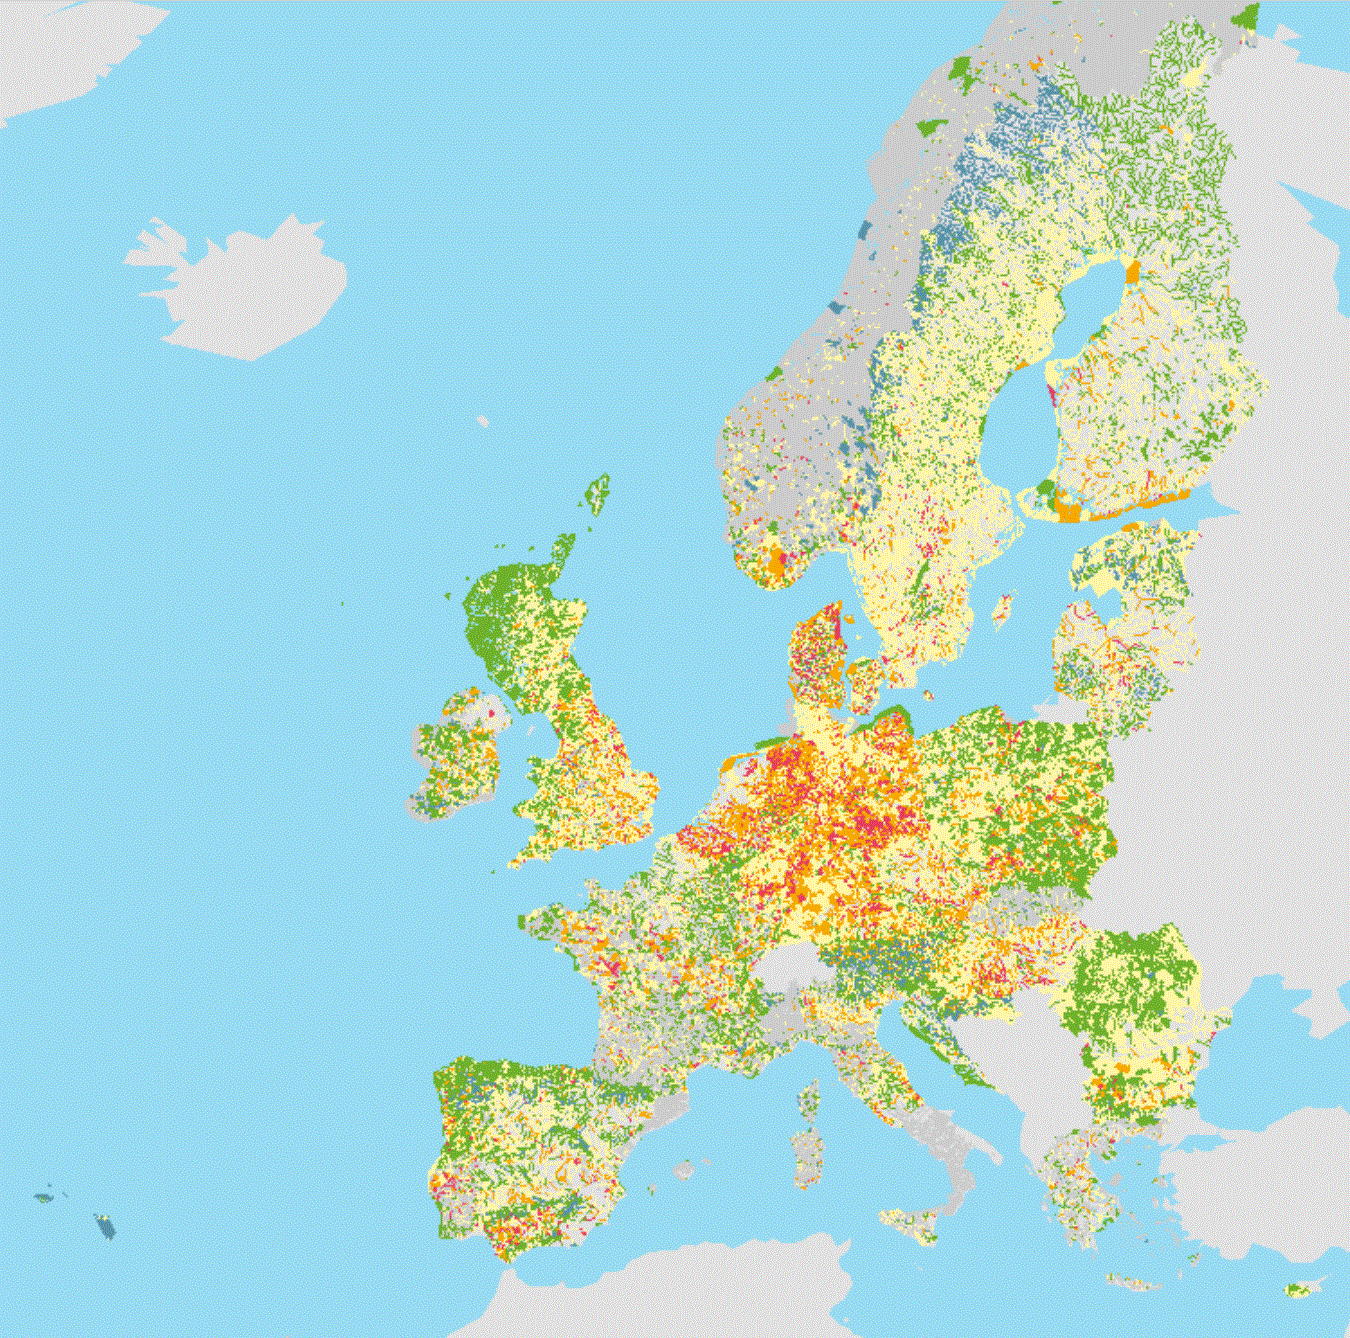
Gridded Distribution of Species as reported during the Article 17 of the Habitats Directive (92/43/EEC) covering the period 2001 to 2006. The data covers the EU 25. All Member States are requested by the Habitats Directive (92/43/EEC) to monitor habitat types and species considered to be of Community interest. Article 17 of the Habitats Directive 92/43/EEC requires that every 6 years Member States prepare reports to be sent to the European Commission on the implementation of the Directive. The Article 17 report for the period 2001-2006 for the first time includes assessments on the conservation status of the habitat types and species of Community interest. Information on the data quality of the 2001-2006 reporting round is available at http://bd.eionet.europa.eu/article17.
-

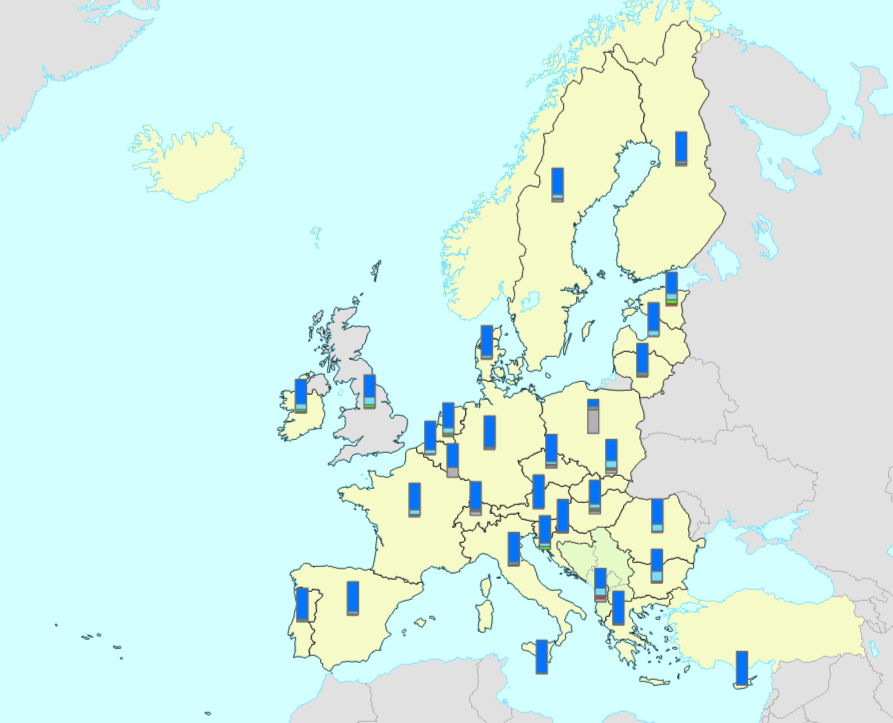
The dataset shows the percentage of cities' administrative area (core city based on the Urban Morphological Zones dataset) inundated by the sea level rise of 1 metre, without any coastal flooding defences present for a series of individual coastal European cities (included in Urban Audit). The dataset has been computed using the CReSIS (Centre for Remote Sensing of Ice Sheets) dataset for 2018.
-
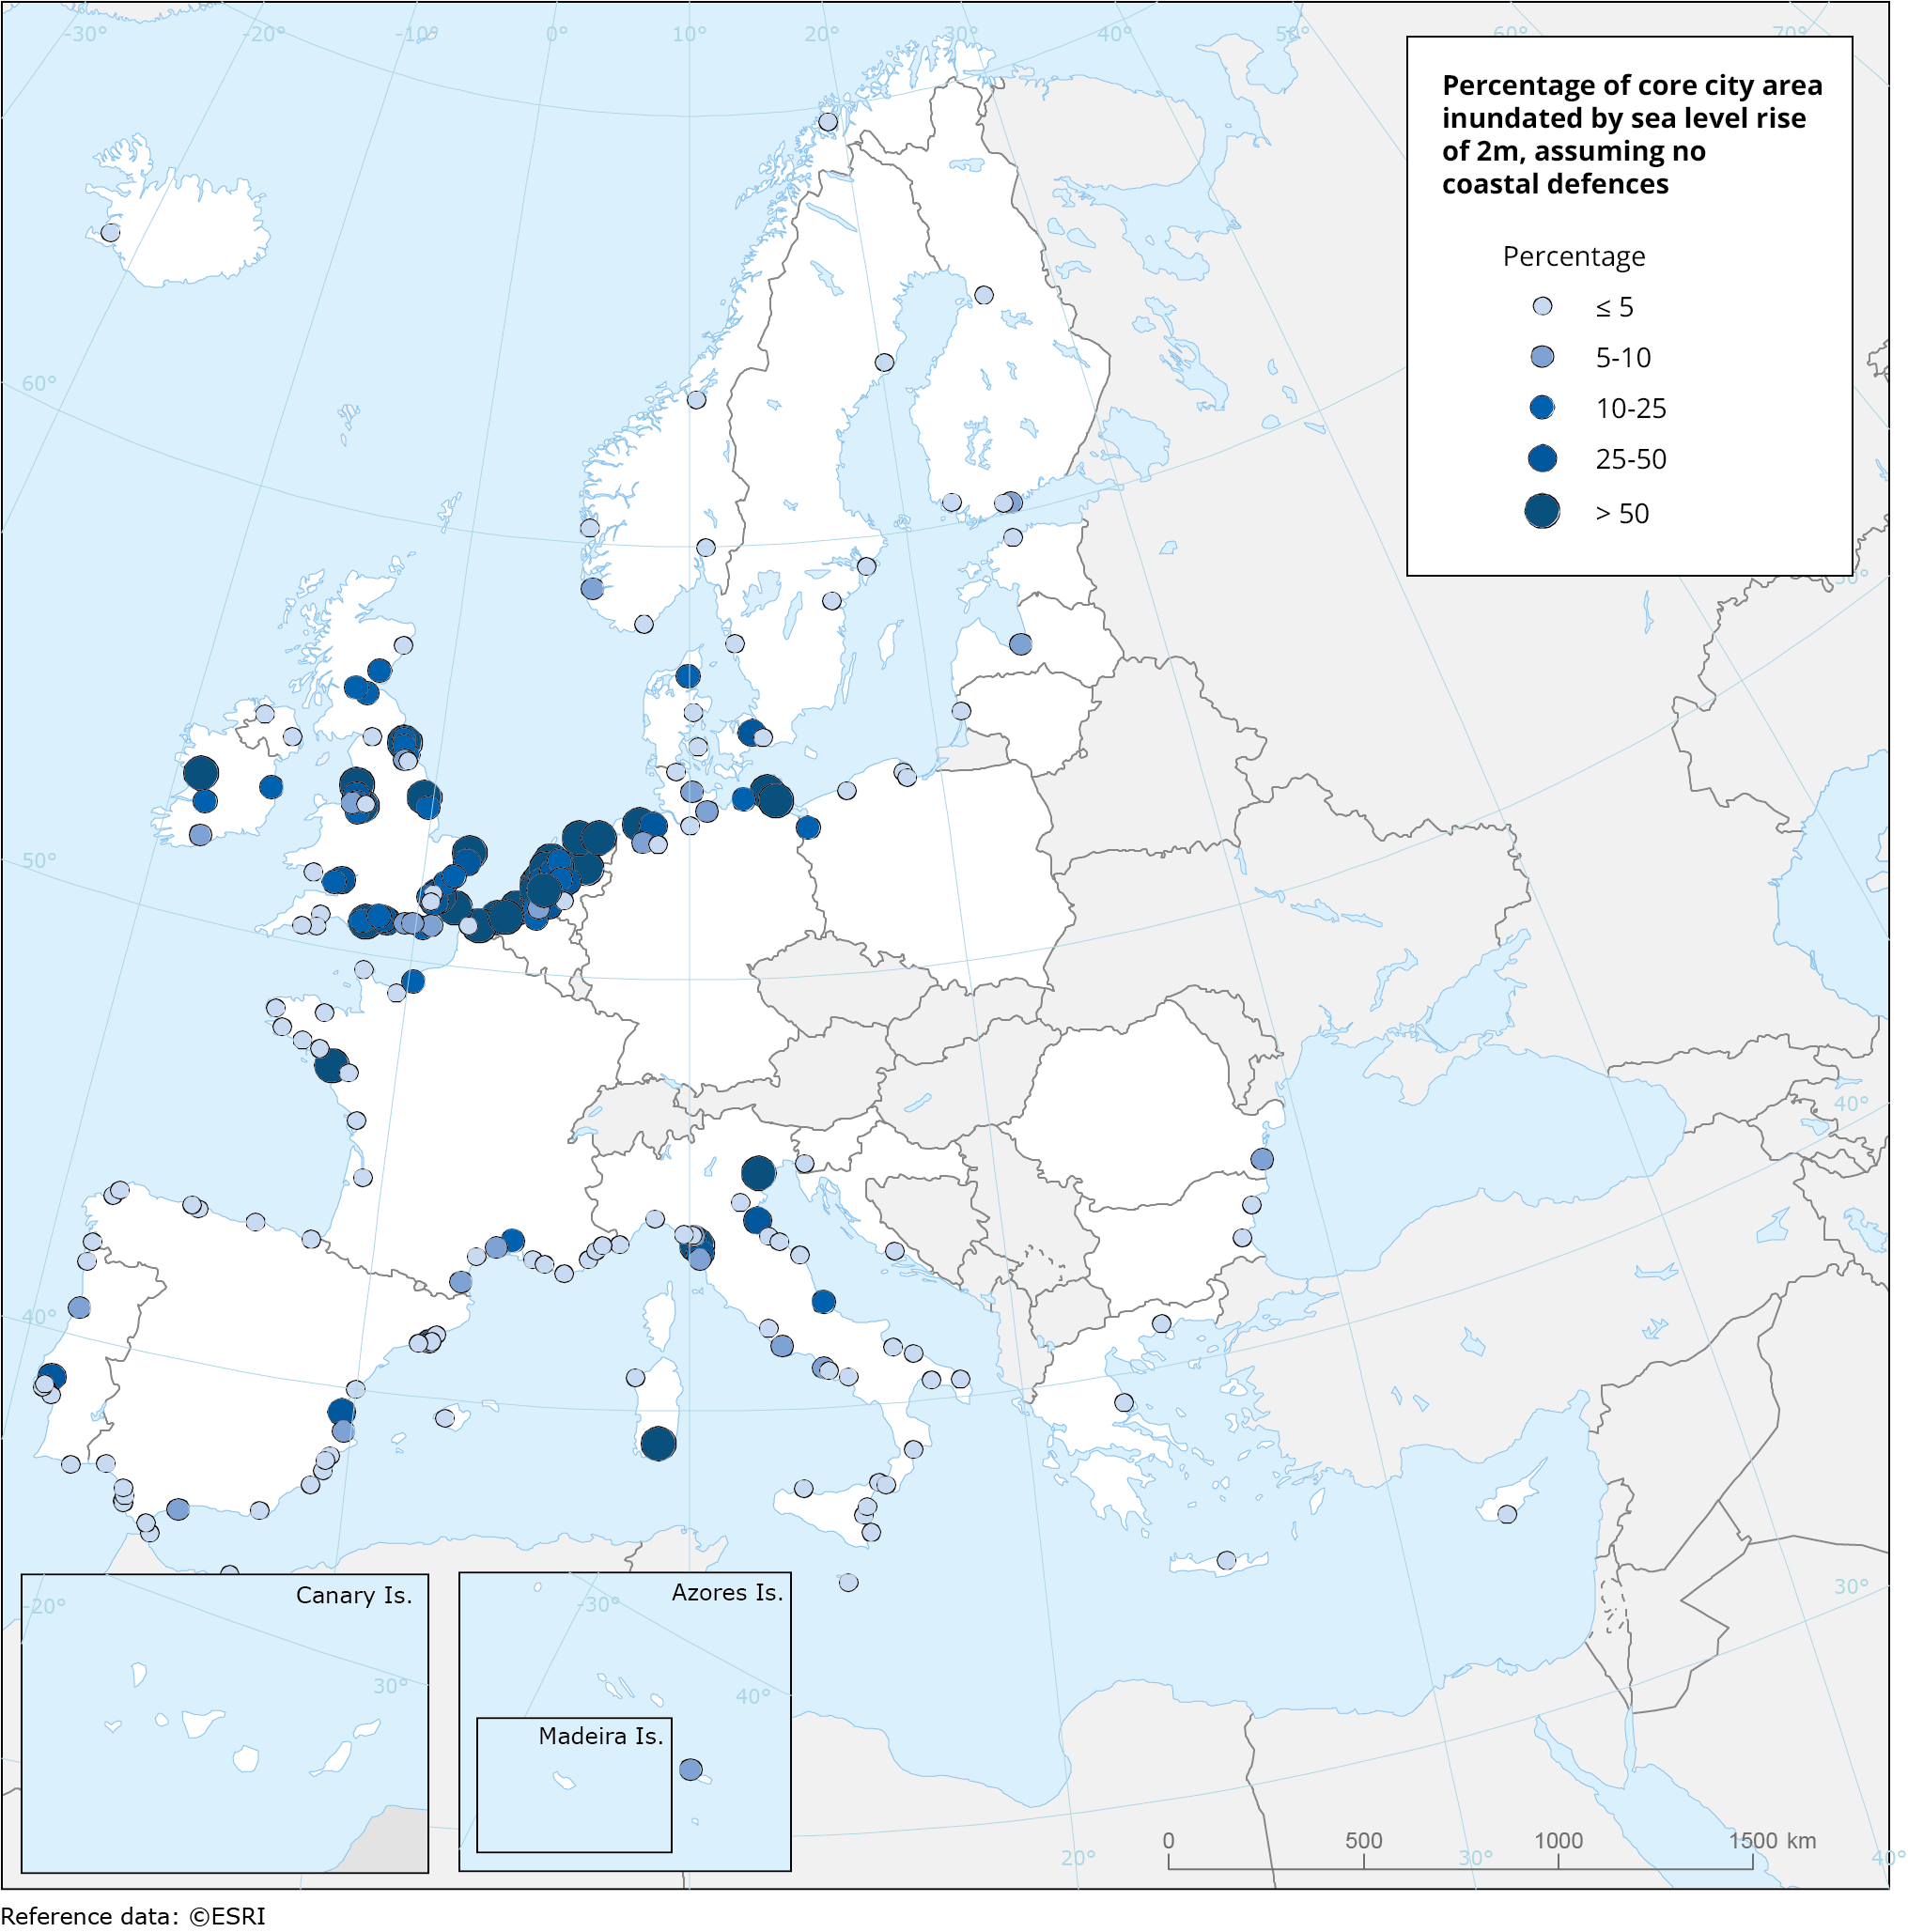
This metadata refers to a dataset that shows the percentage of cities' administrative area (core city based on the Urban Morphological Zones dataset) inundated by the sea level rise of 2 metres, without any coastal flooding defences present for a series of individual coastal European cities (included in Urban Audit). The dataset has been computed using the CReSIS (Centre for Remote Sensing of Ice Sheets) dataset for 2018.
-
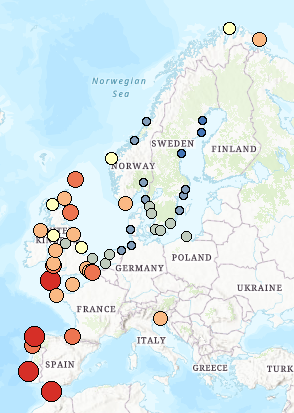
This dataset presents the estimated multiplication factor by which the frequency of flooding events of a given height in European tide gauges will change between 2010 and 2100, due to projected regional sea relative level rise under the Representative Concentration Pathways (RCP) 4.5 scenario. Values larger than 1 indicate an increase in flooding frequency. This dataset is derived from the Figure 13.25(b) of the Working Group I contribution to the IPCC Fifth Assessment Report (http://www.climatechange2013.org/images/report/WG1AR5_ALL_FINAL.pdf). This dataset also contributes to an earlier version of the EEA Indicator "Global and European sea-level": https://www.eea.europa.eu/data-and-maps/indicators/sea-level-rise-5/assessment.
-
The service contains information about the ecological status or potential of European surface water bodies, delineated for the 2nd River Basin Management Plans (RBMP) under the Water Framework Directive (WFD). The Quality Element status is the poorest of the known quality element status values per water body. For example, the nutrient conditions status (QE3-1-6) is based on the following two quality elements: Nitrogen conditions (QE3-1-6-1) and Phosphorus conditions (QE3-1-6-2). The ecological status or potential is presented for the following quality elements: QE1 - Biological quality elements; QE1-1 - Phytoplankton; QE1-2 - Other aquatic flora; QE1-2-1 - Macroalgae; QE1-2-2 - Angiosperms; QE1-2-3 - Macrophytes; QE1-2-4 - Phytobenthos; QE1-3 - Benthic invertebrates; QE1-4 - Fish; QE2 - Hydromorphological quality elements; QE2-1 - Hydrological or tidal regime; QE2-2 - River continuity conditions; QE2-3 - Morphological conditions; QE3 - Chemical and physico-chemical quality elements; QE3-1 - General parameters; QE3-1-1 - Transparency conditions; QE3-1-2 - Thermal conditions; QE3-1-3 - Oxygenation conditions; QE3-1-4 - Salinity conditions; QE3-1-5 - Acidification status; QE3-1-6 - Nutrient conditions; QE3-1-6-1 - Nitrogen conditions; QE3-1-6-2 - Phosphorus conditions; QE3-3 - River Basin Specific Pollutants. The information was reported to the European Commission under the Water Framework Directive (WFD) reporting obligations. The dataset compiles the available spatial data related to the 2nd RBMPs due in 2016 (hereafter WFD2016). See http://rod.eionet.europa.eu/obligations/715 for further information on the WFD2016 reporting. Relevant concepts: Surface water body: Body of surface water means a discrete and significant element of surface water such as a lake, a reservoir, a stream, river or canal, part of a stream, river or canal, a transitional water or a stretch of coastal water. Surface water: Inland waters, except groundwater; transitional waters and coastal waters, except in respect of chemical status for which it shall also include territorial waters. Inland water: All standing or flowing water on the surface of the land, and all groundwater on the landward side of the baseline from which the breadth of territorial waters is measured. River: Body of inland water flowing for the most part on the surface of the land but which may flow underground for part of its course. Lake: Body of standing inland surface water. Transitional waters: Bodies of surface water in the vicinity of river mouths which are partly saline in character as a result of their proximity to coastal waters but which are substantially influenced by freshwater flows. Coastal water: Surface water on the landward side of a line, every point of which is at a distance of one nautical mile on the seaward side from the nearest point of the baseline from which the breadth of territorial waters is measured, extending where appropriate up to the outer limit of transitional waters.
-
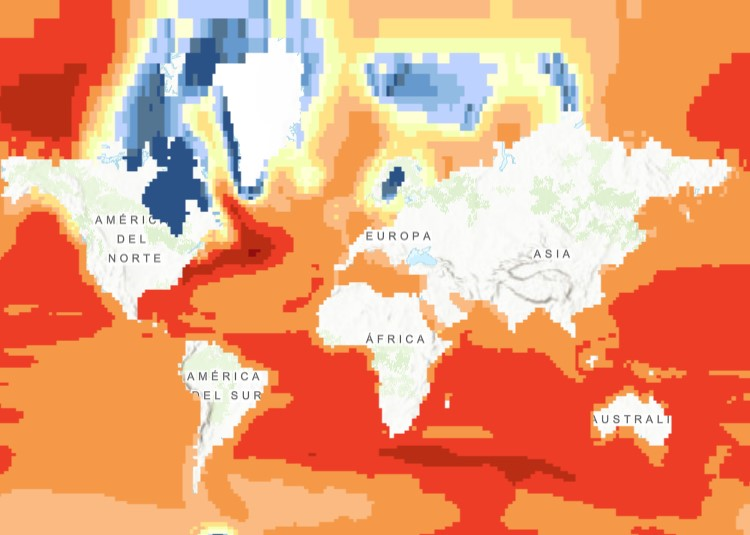
The raster dataset (1ºx1º) shows the projected change in relative sea level (in metres) in 2081-2100 compared to 1986-2005 for the medium-low emission scenario RCP4.5, based on an ensemble of Coupled Model Intercomparison Project Phase 5 (CMIP5) climate models. Projections consider land movement due to glacial isostatic adjustment but not land subsidence due to human activities. No projections are available for the Black Sea. The dataset has been used as a source for an earlier version of the EEA indicator “Global and European Sea Level”: https://www.eea.europa.eu/data-and-maps/indicators/sea-level-rise-5/assessment.
-
The bathing water quality data services include all coastal and inland bathing waters reported and assessed in the European Union Member States, Albania, Switzerland and the United Kingdom. The data is reported annually in the scope of the Bathing Water Directive (Directive 2006/7/EC of the European Parliament and of the Council of 15 February 2006, BWD) reporting obligations. The map services in https://water.discomap.eea.europa.eu/arcgis/rest/services/BathingWater show the location of the bathing waters and the assessment of bathing water quality for the last reported bathing season, as well as for the ten previous bathing seasons. Each bathing water is assessed for three statuses: 1) monitoring calendar status, 2) management status, 3) bathing water quality status. The monitoring calendar status evaluates the implementation of the monitoring calendar in the last reported season (as defined in Annex IV of the Bathing Water Directive). The management status evaluates the management in the last assessment period, whether the bathing water was continuously monitored or not. The bathing quality status evaluates the quality of bathing waters according to the two microbiological parameters: Escherichia coli and Intestinal enterococci (as defined in Annexes I and II of the Bathing Water Directive). The bathing water quality is classified in one of four classes: “Excellent”, “Good”, “Sufficient” or “Poor”. The status “Not classified” is applied if there are not enough available samples to evaluate the water quality. The data service in https://discodata.eea.europa.eu/ contains the results of the bathing water status since 1990: [WISE_BWD].[latest].[assessment_BathingWaterStatus] It also contains the reported data in the following tables: [WISE_BWD].[latest].[timeseries_Characterisation] [WISE_BWD].[latest].[timeseries_SeasonalPeriod] [WISE_BWD].[latest].[timeseries_MonitoringResult] [WISE_BWD].[latest].[spatial_SpatialProtected]
-
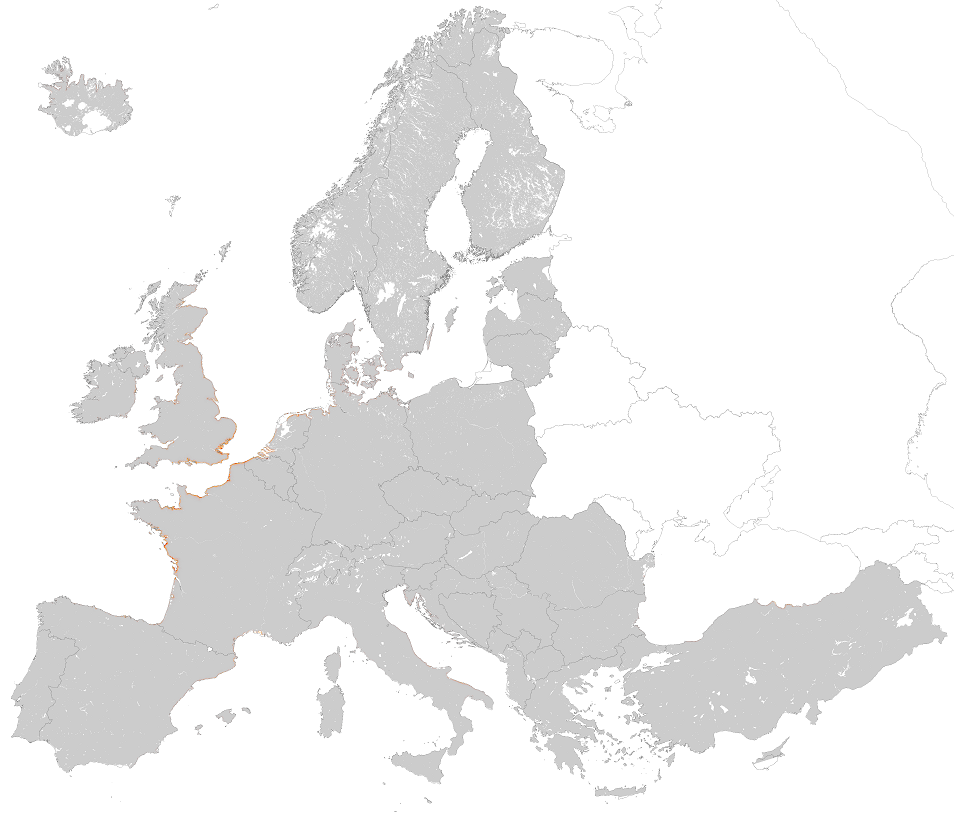
This metadata corresponds to the EUNIS Littoral biogenic habitat (salt marshes) types, predicted distribution of habitat suitability dataset. Littoral habitats are those formed by animals such as worms and mussels or plants (salt marshes). The verified littoral biogenic habitat samples used are derived from the Braun-Blanquet database (http://www.sci.muni.cz/botany/vegsci/braun_blanquet.php?lang=en) which is a centralised database of vegetation plots and comprises copies of national and regional databases using a unified taxonomic reference database. The geographic extent of the distribution data are all European countries except Armenia and Azerbaijan. The modelled suitability for EUNIS saltmarsh habitat types is an indication of where conditions are favourable for the habitat type based on sample plot data (Braun-Blanquet database) and the Maxent software package. The modelled suitability map may be used as a proxy for the geographical distribution of the habitat type. However, note that it is not representing the actual distribution of the habitat type. As predictors for the suitabilty modelling not only Climate and Soil parameters have been taken into account, but also so-called RS-EVB's, Remote Sensing-enabled Essential Biodiversity Variables like Landuse, Vegetation height, Phenology, LAI(Leave Area Index) and Population density. Because the EBV's are restricted by the extent of the Remote Sensing data (EEA38 countries and the United Kingdom) the modelling result does also not go beyond this boundary. The dataset is provided both in Geodatabase and Geopackage formats. The Training map files show the modelled suitable distribution, omitting the 10% of occurrence records in the least suitable environment under the assumption that they are not representative of the overall suitable habitat distribution. The 10 percentile training presence is an arbitrary threshold which omits all regions with habitat suitability lower than the suitability values for the lowest 10% of occurrence records.
-
Coastal zones are presented as a series of 10 consecutive buffers of 1km width each (towards inland). For this dataset, were treated as sea data all areas with a class value of 523 (sea and ocean) in Corine Land Cover (details in lineage).