 Catalogue PIGMA
Oceanographic geographical features
Type of resources
Available actions
Topics
Keywords
Contact for the resource
Provided by
Years
Formats
Representation types
Update frequencies
status
Scale
Resolution
-

SpiArcBase is a software developed for the treatment of Sediment Profile images (SPIs). Sediment Profile Images (SPIs) are widely used for benthic ecological quality assessment under various environmental stressors. The processing of the information contained in SPIs is slow and its interpretation is largely operator dependent. SpiArcBase enhances the objectivity of the information extracted from SPIs, especially for the assessment of the apparent Redox Potential Discontinuity (aRPD). This software allows the user to create and manage a database containing original SPIs and corresponding derived pieces of information. Once you have downloaded it, you can ask for help and stablish a helpdesk.
-
Sediment Profile Images (SPIs) are commonly used to map physical, biological and chemical/nutrient gradients in benthic habitats. SpiArcBase is a software that has been developed for the analysis of Sediment Profile Images (SPIs). It has been conceived to improve the objectivity of extracted information (especially the apparent Redox Potential Discontinuity (aRPD). The software presents a graphical user interface designed to enhance the interpretation of features observed on SPIs in an objective manner and to facilitate image management and structures visualization via a data base.The software also allows for the storage of generated data and the automatic computation of a benthic habitat quality index. The facilities provided within JERICONext include access to the software through free downloading and assistance in its utilization.
-
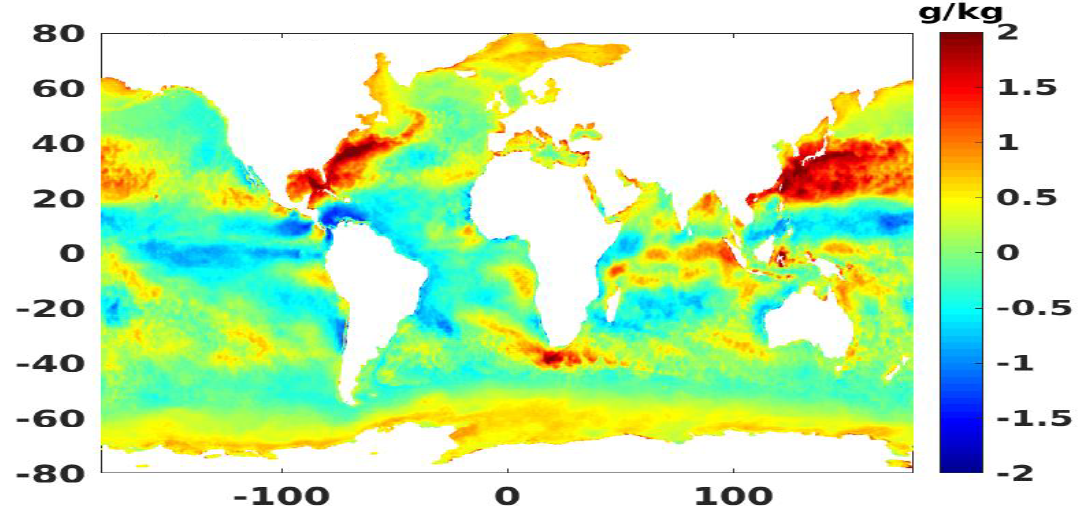
Daily air-sea heat fluxes dataset on the last 27 years (1992-2018). Global coverage with 0.25° resolution. Data is mainly coming from aggregated calibrated scatterometer datasets and numerical models. Main geophysical parameters are: sensible heat flux, latent heat flux, wind speed, SST, air temperature. Latest version : 4.1 released in June 2019.
-
A Group for High Resolution Sea Surface Temperature (GHRSST) Level 4 sea surface temperature analysis produced daily on an operational basis at the UK Met Office using optimal interpolation (OI) on a global 0.054 degree grid. The Operational Sea Surface Temperature and Sea Ice Analysis (OSTIA) analysis uses satellite data from sensors that include the Advanced Very High Resolution Radiometer (AVHRR), the Advanced Along Track Scanning Radiometer (AATSR), the Spinning Enhanced Visible and Infrared Imager (SEVIRI), the Advanced Microwave Scanning Radiometer-EOS (AMSRE), the Tropical Rainfall Measuring Mission Microwave Imager (TMI), and in situ data from drifting and moored buoys. This analysis has a highly smoothed SST field and was specifically produced to support SST data assimilation into Numerical Weather Prediction (NWP) models.
-

This HF radar system is composed by two CODAR Seasonde antennas (transmit frecuency 4.525 MHz) and offers many benefits for the Basque Operational Oceanography Network such as: the improvement of the knowledge about surface currents and their forcing physical processes, marine safety, search and rescue, pollution response, validation and calibration of both hydrodynamic and pollutant drift forecasting models, data assimilation on progress, etc. The access from raw radial data to processes 2D surface current is provided for scientific and applied purposes (Coastal processes, marine safety, search and rescue, pollution response, etc).
-
A global Group for High Resolution Sea Surface Temperature (GHRSST) Level 2P dataset based on multi-channel sea surface temperature (SST) retrievals generated in real-time from the Advanced Very High Resolution Radiometer (AVHRR) on the European Meteorological Operational-A (MetOp-A; launched 19 Oct 2006) ) satellite produced and used operationally in oceanographic analyses and forecasts by the US Naval Oceanographic Office (NAVO). The MetOp satellite program is a European undertaking providing weather data services for monitoring climate and improving weather forecasts. It was jointly established by the European Space Agency (ESA) and the European Organisation for the Exploitation of Meteorological Satellites (EUMETSAT) with a contribution by the US National Oceanic and Atmospheric Administration (NOAA) of an AVHRR sensor identical to those flying on the family of Polar Orbiting Environmental Satellites (POES). AVHRR instruments measure the radiance of the Earth in 5 (or 6) relatively wide spectral bands. The first two are centered around the red (0.6 micrometer) and near-infrared (0.9 micrometer) regions, the third one is located around 3.5 micrometer, and the last two sample the emitted thermal radiation, around 11 and 12 micrometers, respectively. The legacy 5 band instrument is known as AVHRR/2 while the more recent version, the AVHRR/3 (first carried on the NOAA-15 platform), acquires data in a 6th channel located at 1.6 micrometer. Typically the 11 and 12 micron channels are used to derive SST sometimes in combination with the 3.5 micron channel. The MetOp-A platform is sun synchronous generally viewing the same earth location twice a day (latitude dependent) due to the relatively large AVHRR swath of approximately 2400 km. The highest ground resolution that can be obtained from the current AVHRR instruments is 1.1 km at nadir. This particular dataset is produced from Global Area Coverage (GAC) data that are derived from an on-board sample averaging of the full resolution global AVHRR data. Four out of every five samples along the scan line are used to compute on average value and the data from only every third scan line are processed, yielding an effective 4 km resolution at nadir. Further binning and averaging of these pixels results in a final dataset resolution of 8.8 km.
-
The Meteosat Second Generation (MSG-3) satellites are spin stabilized geostationary satellites operated by the European Organization for the Exploitation of Meteorological Satellites (EUMETSAT) to provide accurate weather monitoring data through its primary instrument the Spinning Enhanced Visible and InfraRed Imager (SEVIRI), which has the capacity to observe the Earth in 12 spectral channels. Eight of these channels are in the thermal infrared, providing among other information, observations of the temperatures of clouds, land and sea surfaces at approximately 5 km resolution with a 15 minute duty cycle. This Group for High Resolution Sea Surface Temperature (GHRSST) dataset produced by the US National Oceanic and Atmospheric Administration (NOAA) National Environmental Satellite, Data, and Information Service (NESDIS) is derived from the SEVIRI instrument on the second MSG satellite (also known as Meteosat-9) that was launched on 22 December 2005. Skin sea surface temperature (SST) data are calculated from the infrared channels of SEVIRI at full resolution every 15 minutes. L2P data products with Single Sensor Error Statistics (SSES) are then derived following the GHRSST-PP Data Processing Specification (GDS) version 2.0. Version Description:
-
A global Group for High Resolution Sea Surface Temperature (GHRSST) Level 3 Collated (L3C) dataset derived from the Advanced Very High Resolution Radiometer (AVHRR) on the European Meteorological Operational-A (MetOp-A) platform (launched 19 Oct 2006). The European Organization for the Exploitation of Meteorological Satellites (EUMETSAT), Ocean and Sea Ice Satellite Application Facility (OSI SAF) is producing SST products in near real time from Metop/AVHRR. Global AVHRR level 1b data are acquired at Meteo-France/Centre de Meteorologie Spatiale (CMS) through the EUMETSAT/EUMETCAST system. SST is retrieved from the AVHRR infrared channels (3.7, 10.8 and 12.0 micrometer) using a multispectral algorithm. Atmospheric profiles of water vapor and temperature from a numerical weather prediction model, together with a radiatiave transfer model, are used to correct the multispectral algorithm for regional and seasonal biases due to changing atmospheric conditions. This global L3C product is derived from full resolution AVHRR l1b data that are re-mapped onto a 0.05 degree grid twice daily. The product format is compliant with the GHRSST Data Specification (GDS) version 2.
-
A global Group for High Resolution Sea Surface Temperature (GHRSST) Level 2P dataset based on multi-channel sea surface temperature (SST) retrievals generated in real-time from the Advanced Very High Resolution Radiometer (AVHRR) on the NOAA-18 platform (launched 20 May 2005) produced and used operationally in oceanographic analyses and forecasts by the US Naval Oceanographic Office (NAVO). The AVHRR is a space-borne scanning sensor on the National Oceanic and Atmospheric Administration (NOAA) family of Polar Orbiting Environmental Satellites (POES) having a operational legacy that traces back to the Television Infrared Observation Satellite-N (TIROS-N) launched in 1978. AVHRR instruments measure the radiance of the Earth in 5 (or 6) relatively wide spectral bands. The first two are centered around the red (0.6 micrometer) and near-infrared (0.9 micrometer) regions, the third one is located around 3.5 micrometer, and the last two sample the emitted thermal radiation, around 11 and 12 micrometers, respectively. The legacy 5 band instrument is known as AVHRR/2 while the more recent version, the AVHRR/3 (first carried on the NOAA-15 platform), acquires data in a 6th channel located at 1.6 micrometer. Typically the 11 and 12 micron channels are used to derive SST sometimes in combination with the 3.5 micron channel. The NOAA platforms are sun synchronous generally viewing the same earth location twice a day (latitude dependent) due to the relatively large AVHRR swath of approximately 2400 km. The highest ground resolution that can be obtained from the current AVHRR instruments is 1.1 km at nadir. AVHRR data are acquired in three formats: High Resolution Picture Transmission (HRPT), Local Area Coverage (LAC), and Global Area Coverage (GAC). HRPT data are full resolution image data transmitted to a ground stations as they are collected. LAC are also full resolution data, but the acquisition is prescheduled and recorded with an on-board tape recorder for subsequent transmission during a station overpass. This particular dataset is produced from GAC data that are derived from an on-board sample averaging of the full resolution global AVHRR data. Four out of every five samples along the scan line are used to compute on average value and the data from only every third scan line are processed, yielding an effective 4 km resolution at nadir. Further binning and averaging of these pixels results in a final dataset resolution of 8.8 km.