 Catalogue PIGMA
Brest
Type of resources
Available actions
Topics
Keywords
Contact for the resource
Provided by
Years
Formats
Representation types
Update frequencies
status
Scale
Resolution
-

GOSUD aims at assembling in-situ observations of the world ocean surface collected by a variety of ships and at distributing quality controlled datasets. At present time the variables considered by GOSUD are temperature and salinity. The GOSUD data are mostly collected using thermosalinographs (TSG) installed on research vessels, on commercial ships and in some cases on sailing exploration ships. GOSUD manages both near-real time (RT and NRT) data and delayed mode (DM-reprocessed) data. The GOSUD GDAC is hosted by the Coriolis data centre (France) and a back-up (permanent archived) is performed on a daily basis by NCEIS (NOAA's National Centers for Environmental Information).
-
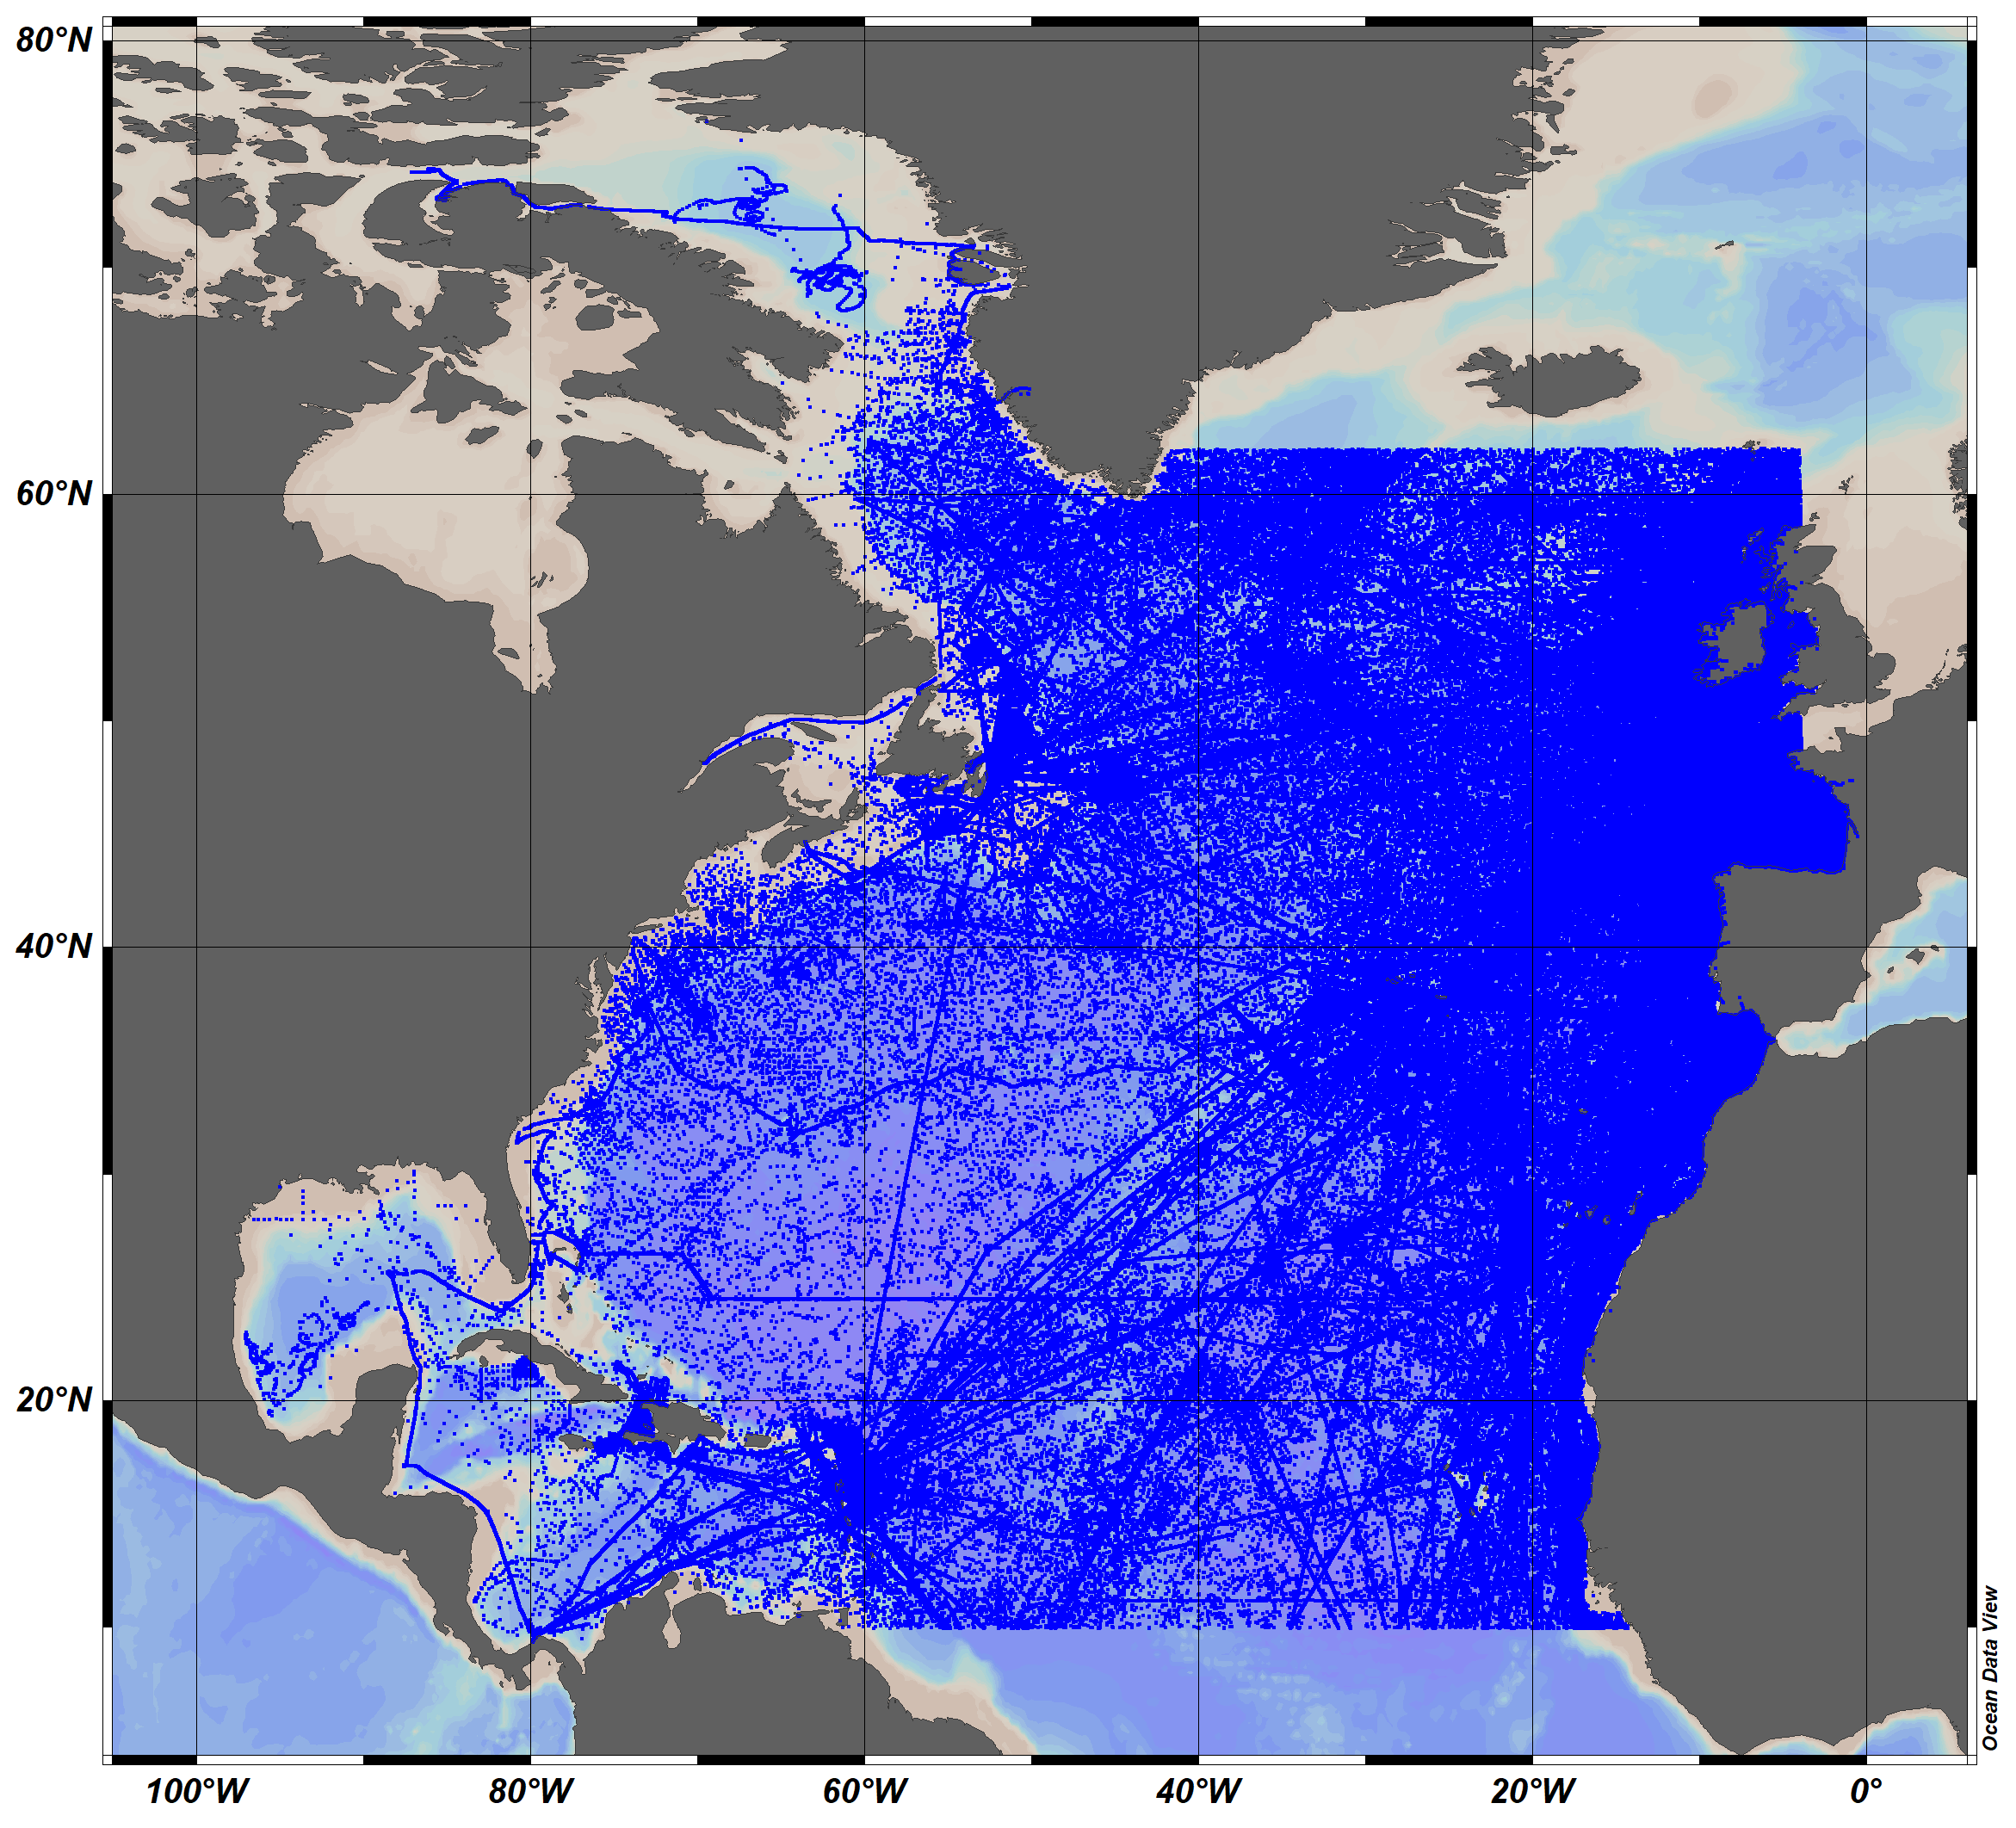
The SeaDataCloud TS historical data collection V2 for the North Atlantic Ocean, includes open access in situ data on temperature and salinity of water column in the North Atlantic Ocean from 10°N to 62°N, including the Labrador Sea, The data were retrieved from the SeaDataNet infrastructure at summer 2019. The dataset format is Ocean Data View (ODV - http://odv.awi.de/) binary collection. The quality control of the data has been performed with the help of ODV software. Data Quality Flags have been revised and set up using the elaborated by SeaDataNet2 project QC procedures in conjunction with the visual expert check. The final number of the Temperature and Salinity profiles (stations) in the collection is 10119755. For data access please register at http://www.marine-id.org/.
-
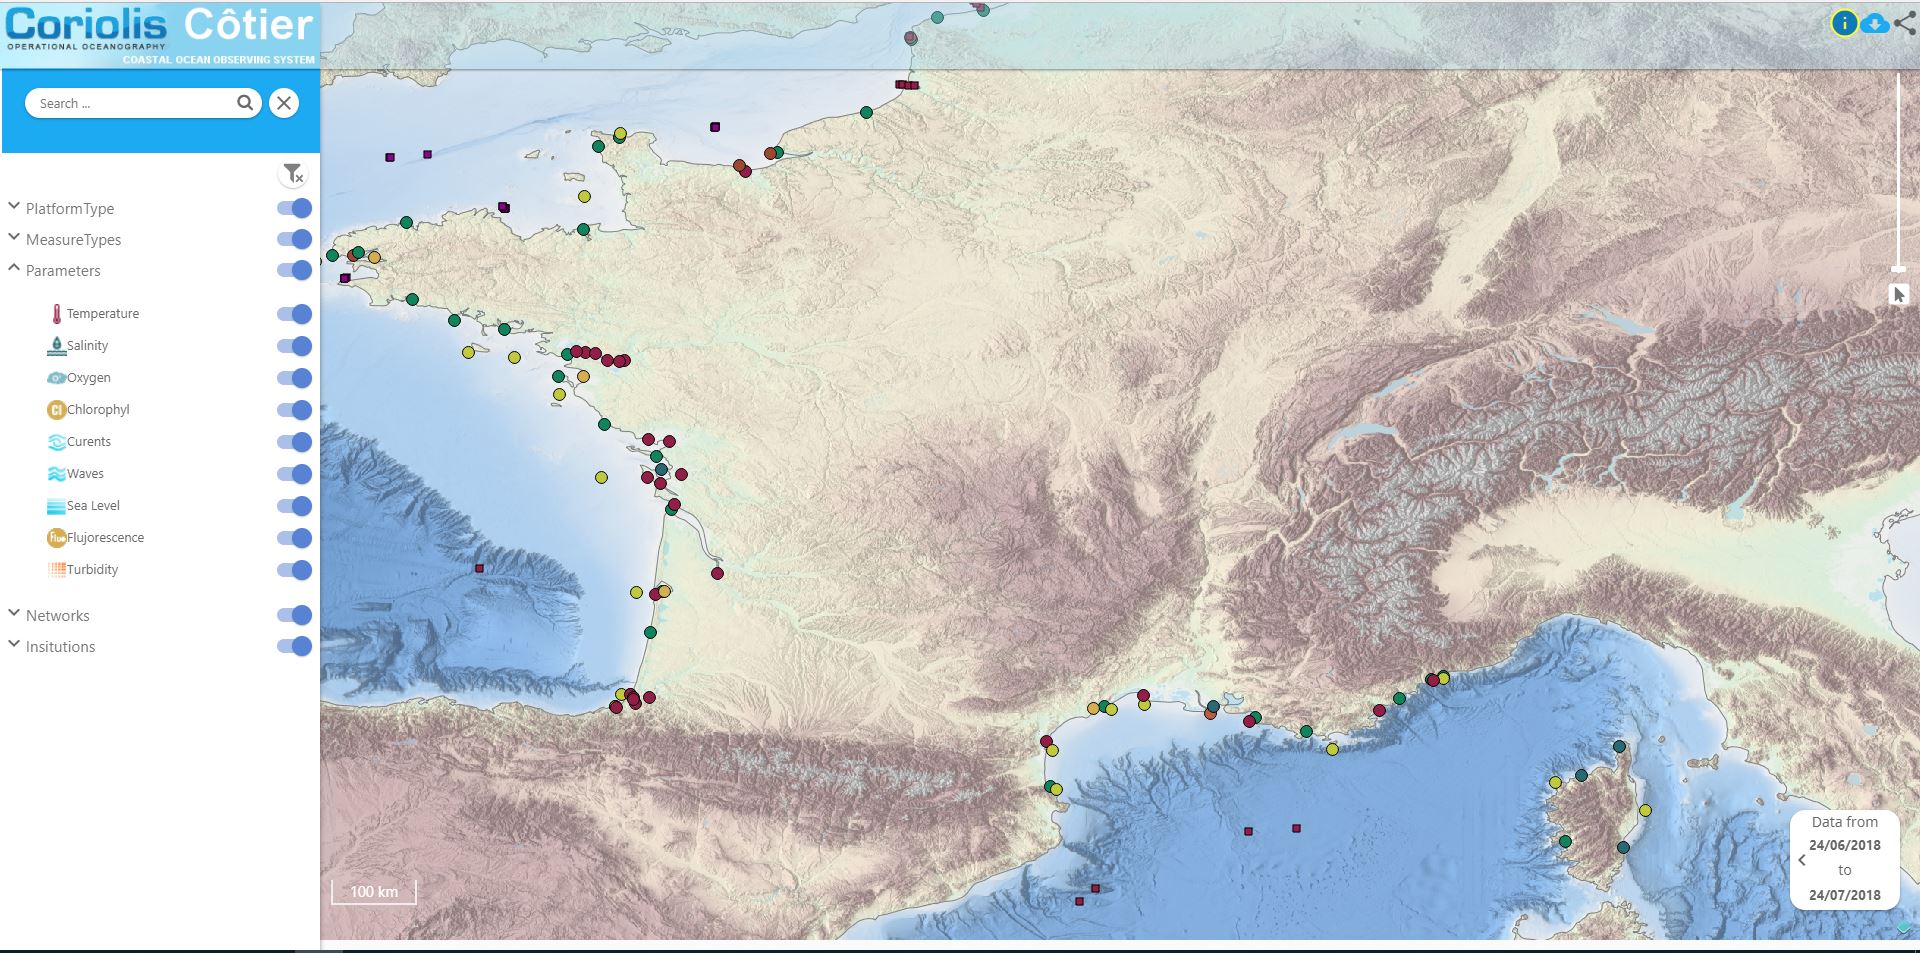
Data available in the French Coast
-

'''DEFINITION''' The CMEMS NORTHWESTSHELF_OMI_tempsal_extreme_var_temp_mean_and_anomaly OMI indicator is based on the computation of the annual 99th percentile of Sea Surface Temperature (SST) from model data. Two different CMEMS products are used to compute the indicator: The North-West Shelf Multi Year Product (NWSHELF_MULTIYEAR_PHY_004_009) and the Analysis product (NORTHWESTSHELF_ANALYSIS_FORECAST_PHY_004_013). Two parameters are included on this OMI: * Map of the 99th mean percentile: It is obtained from the Multi Year Product, the annual 99th percentile is computed for each year of the product. The percentiles are temporally averaged over the whole period (1993-2019). * Anomaly of the 99th percentile in 2020: The 99th percentile of the year 2020 is computed from the Analysis product. The anomaly is obtained by subtracting the mean percentile from the 2020 percentile. This indicator is aimed at monitoring the extremes of sea surface temperature every year and at checking their variations in space. The use of percentiles instead of annual maxima, makes this extremes study less affected by individual data. This study of extreme variability was first applied to the sea level variable (Pérez Gómez et al 2016) and then extended to other essential variables, such as sea surface temperature and significant wave height (Pérez Gómez et al 2018 and Alvarez Fanjul et al., 2019). More details and a full scientific evaluation can be found in the CMEMS Ocean State report (Alvarez Fanjul et al., 2019). '''CONTEXT''' This domain comprises the North West European continental shelf where depths do not exceed 200m and deeper Atlantic waters to the North and West. For these deeper waters, the North-South temperature gradient dominates (Liu and Tanhua, 2021). Temperature over the continental shelf is affected also by the various local currents in this region and by the shallow depth of the water (Elliott et al., 1990). Atmospheric heat waves can warm the whole water column, especially in the southern North Sea, much of which is no more than 30m deep (Holt et al., 2012). Warm summertime water observed in the Norwegian trench is outflow heading North from the Baltic Sea and from the North Sea itself. '''CMEMS KEY FINDINGS''' The 99th percentile SST product can be considered to represent approximately the warmest 4 days for the sea surface in Summer. Maximum anomalies for 2020 are up to 4oC warmer than the 1993-2019 average in the western approaches, Celtic and Irish Seas, English Channel and the southern North Sea. For the atmosphere, Summer 2020 was exceptionally warm and sunny in southern UK (Kendon et al., 2021), with heatwaves in June and August. Further north in the UK, the atmosphere was closer to long-term average temperatures. Overall, the 99th percentile SST anomalies show a similar pattern, with the exceptional warm anomalies in the south of the domain. Note: The key findings will be updated annually in November, in line with OMI evolutions. '''DOI (product)''' https://doi.org/10.48670/moi-00273
-
The Drifting Buoys GDAC -Global Data Assembly Centre- is the repository of surface drifters data. Both NRT -Near Real Time- and DM -Delayed Mode- data are available on the GDAC. Drifters report generally trajectories, sea-surface temperatures, atmospheric pressures at sea-level, as well as sea-surface salinity or sub-surface temperature in the ocean top layer.
-

'''Short description:''' For the Global Ocean- Gridded objective analysis fields of temperature and salinity using profiles from the reprocessed in-situ global product CORA (INSITU_GLO_TS_REP_OBSERVATIONS_013_001_b) using the ISAS software. Objective analysis is based on a statistical estimation method that allows presenting a synthesis and a validation of the dataset, providing a validation source for operational models, observing seasonal cycle and inter-annual variability. Acces through CMEMS Catalogue after registration: http://marine.copernicus.eu/ '''Detailed description:''' The operational analysis system set up by the in-situ TAC Global component operated by Coriolis data centre. It produces temperature and salinity gridded fields. The system is based on a statistical estimation method (objective analysis). This system allows presenting a synthesis and a validation of the dataset, providing a validation source for operational models, observing seasonal cycle and inter-annual variability.
-
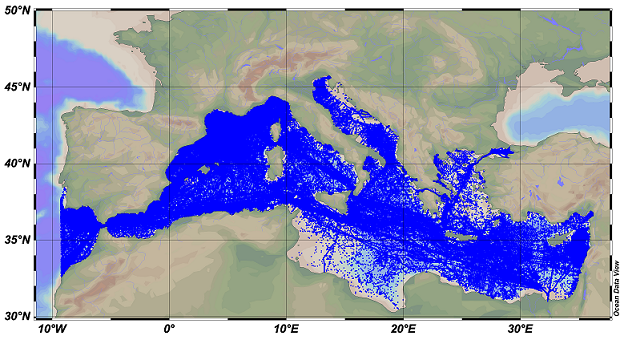
SDC_MED_DATA_TS_V2 SeaDataCloud Temperature and Salinity data collection for the Mediterranean Sea contains all open access temperature and salinity in situ data retrieved from SeaDataNet infrastructure at the end of July 2019. The data span between -9.25 and 37 degrees of longitude, thus including an Atlantic box and the Marmara Sea. It covers the time period 1900-2019. Data have been quality checked using ODV 5.3.2 software. Quality Flags of anomalous data have been revised using basic QC procedures. The dataset format is ODV binary collections. You can read, analyse and export from the ODV application provided by Alfred Wegener institute at http://odv.awi.de/. For data access please register at http://www.marine-id.org/.
-
The GEBCO_2022 Grid is a global continuous terrain model for ocean and land with a spatial resolution of 15 arc seconds. In regions outside of the Arctic Ocean area, the grid uses as a base Version 2.4 of the SRTM15_plus data set (Tozer, B. et al, 2019). This data set is a fusion of land topography with measured and estimated seafloor topography. Included on top of this base grid are gridded bathymetric data sets developed by the four Regional Centers of The Nippon Foundation-GEBCO Seabed 2030 Project. The GEBCO_2022 Grid represents all data within the 2022 compilation. The compilation of the GEBCO_2022 Grid was carried out at the Seabed 2030 Global Center, hosted at the National Oceanography Centre, UK, with the aim of producing a seamless global terrain model. Outside of Polar regions, the Regional Centers provide their data sets as sparse grids i.e. only grid cells that contain data are populated. These data sets were included on to the base using a remove-restore blending procedure. This is a two-stage process of computing the difference between the new data and the base grid and then gridding the difference and adding the difference back to the existing base grid. The aim is to achieve a smooth transition between the new and base data sets with the minimum of perturbation of the existing base data set. The data sets supplied in the form of complete grids (primarily areas north of 60N and south of 50S) were included using feather blending techniques from GlobalMapper software. The GEBCO_2022 Grid has been developed through the Nippon Foundation-GEBCO Seabed 2030 Project. This is a collaborative project between the Nippon Foundation of Japan and the General Bathymetric Chart of the Oceans (GEBCO). It aims to bring together all available bathymetric data to produce the definitive map of the world ocean floor by 2030 and make it available to all. Funded by the Nippon Foundation, the four Seabed 2030 Regional Centers include the Southern Ocean - hosted at the Alfred Wegener Institute, Germany; South and West Pacific Ocean - hosted at the National Institute of Water and Atmospheric Research, New Zealand; Atlantic and Indian Oceans - hosted at the Lamont-Doherty Earth Observatory, Columbia University, USA; Arctic and North Pacific Oceans - hosted at Stockholm University, Sweden and the Center for Coastal and Ocean Mapping at the University of New Hampshire, USA.
-
The GEBCO grid is global data set of elevation values, in metres, on a 15 arc-second interval grid. It is accompanied by a Type Identifier (TID) Grid that gives information on the types of source data that the GEBCO_2024 Grid is based on. An additional 4.34 million square kilometres of bathymetric data has been added to the global grid since the last release in 2023, with 26.1% of the seabed now mapped. This is the Sixth GEBCO grid developed through the Nippon Foundation-GEBCO Seabed 2030 Project.This is a collaborative project between the Nippon Foundation of Japan and GEBCO. The aim of the project is to map the global sea floor by 2030. GEBCO's grids can be downloaded as a global file in netCDF format or for user-defined areas, through our download app, in netCDF, data GeoTiff and ESRI ASCII raster formats. The data set can also be downloaded in the form of imagery. This release of the GEBCO grid includes data from version 5.0 of the International Bathymetric Chart of the Arctic Ocean (IBCAO) . GEBCO's aim is to provide the most authoritative publicly-available bathymetry of the world's oceans. It operates under the joint auspices of the International Hydrographic Organization (IHO) and the Intergovernmental Oceanographic Commission (IOC) (of UNESCO).
-
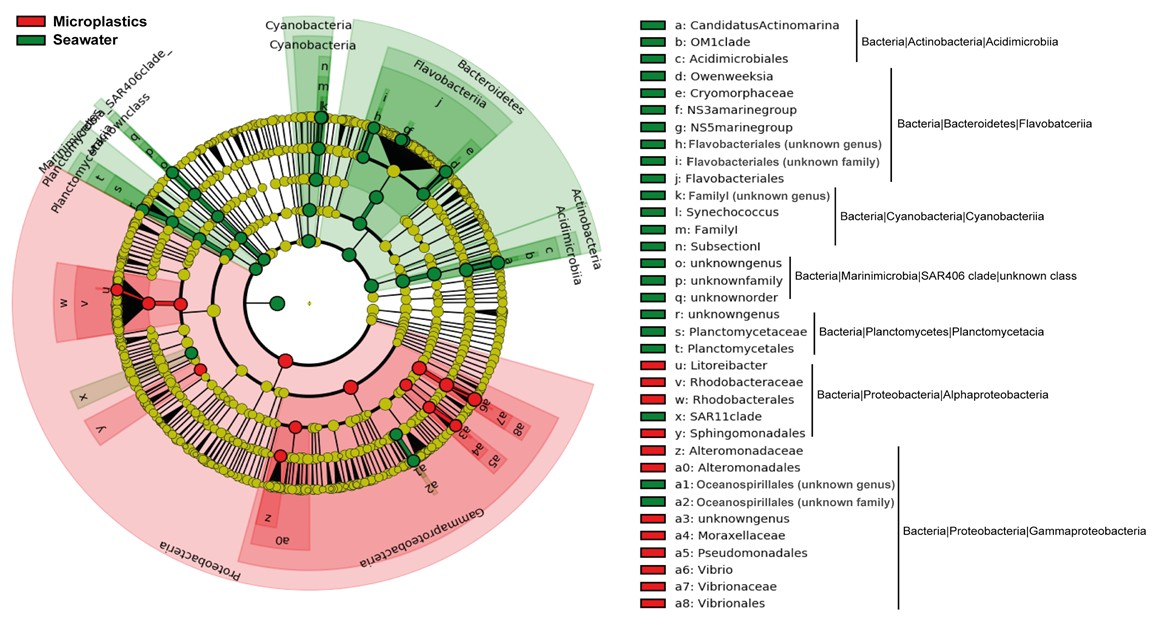
A partir d’échantillons collectés dans le cadre de la thèse de Laura Frère soutenue en 2017 vouée à une première cartographie de la contamination en microplastiques en rade de Brest, ce projet a réalisé l’analyse des espèces colonisatrices de ces microplastiques collectés montrant que les microplastiques sont un substrat anthropogénique support d’assemblages bactériens spécifiques.