Catalogue PIGMA
*
Type of resources
Available actions
Topics
Keywords
Contact for the resource
Provided by
Years
Formats
Representation types
Update frequencies
status
Service types
Scale
Resolution
-
Auteur(s): Darteyron Bernard , Projet d'un centre de thermalisme en milieu rural dans le département des Landes sur quatre communes voisines de Dax
-
Le référentiel inondation Gironde (RIG) est un outil d’aide à la décision. Il vise à apporter une connaissance précise des caractéristiques morphologiques du territoire et une modélisation hydraulique des principaux phénomènes dynamiques de crue influençant directement les inondations sur l'estuaire de la Gironde. L'objectif est ainsi de permettre à l’ensemble des partenaires d’orienter des études en vue d’améliorer ou d’optimiser la protection et la gestion des zones inondables du territoire. Le RIG, modèle hydraulique, s'appuie sur un jeu important de données (topographie, bathymétrie, digues, ouvrages, foncier, marégrammes, orientation du vent, etc.).
-
Geographic information layer including the Transverse limit of the sea - mainland France, French Guiana, Martinique and Guadeloupe. This layer must be considered as an initial version to be validated locally by the competent services. Shom actively seeks out any information which could complete and improve the precision of this layer. The streams and rivers listed correspond to those mentioned in the applicable regulations and/or by a competent Government service. An inventory of existing legal and geographic information was drawn up prior to production in the form of an enquiry targeting services during the second half of 2014. The source legal text and a summary of digital conversion processes is available for each boundary proposed.Updated july 2018
-

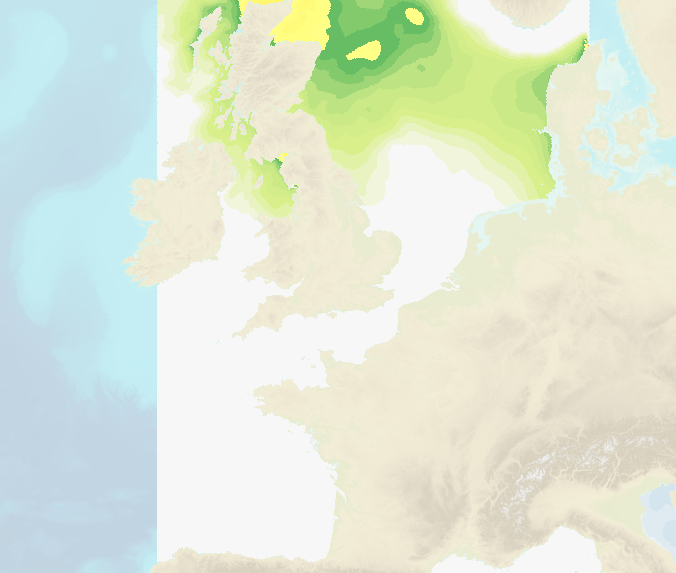
'''Short Description:''' The ocean physics reanalysis for the North-West European Shelf is produced using an ocean assimilation model, with tides, at 7 km horizontal resolution. The ocean model is NEMO (Nucleus for European Modelling of the Ocean), using the 3DVar NEMOVAR system to assimilate observations. These are surface temperature and vertical profiles of temperature and salinity. The model is forced by lateral boundary conditions from the GloSea5, one of the multi-models used by [https://resources.marine.copernicus.eu/?option=com_csw&view=details&product_id=GLOBAL_REANALYSIS_PHY_001_026 GLOBAL_REANALYSIS_PHY_001_026] and at the Baltic boundary by the [https://resources.marine.copernicus.eu/?option=com_csw&view=details&product_id=BALTICSEA_REANALYSIS_PHY_003_011 BALTICSEA_REANALYSIS_PHY_003_011]. The atmospheric forcing is given by the ECMWF ERA5 atmospheric reanalysis. The river discharge is from a daily climatology. Further details of the model, including the product validation are provided in the [https://documentation.marine.copernicus.eu/QUID/CMEMS-NWS-QUID-004-009.pdf CMEMS-NWS-QUID-004-009]. Products are provided as monthly and daily 25-hour, de-tided, averages. The datasets available are temperature, salinity, horizontal currents, sea level, mixed layer depth, and bottom temperature. Temperature, salinity and currents, as multi-level variables, are interpolated from the model 51 hybrid s-sigma terrain-following system to 24 standard geopotential depths (z-levels). Grid-points near to the model boundaries are masked. The product is updated biannually provinding six-month extension of the time series. See [https://documentation.marine.copernicus.eu/PUM/CMEMS-NWS-PUM-004-009-011.pdf CMEMS-NWS-PUM-004-009_011] for further details. '''Associated products:''' This model is coupled with a biogeochemistry model (ERSEM) available as CMEMS product [https://resources.marine.copernicus.eu/?option=com_csw&view=details&product_id=NWSHELF_MULTIYEAR_BGC_004_011]. An analysis-forecast product is available from [https://resources.marine.copernicus.eu/?option=com_csw&view=details&product_id=NWSHELF_ANALYSISFORECAST_PHY_LR_004_001 NWSHELF_ANALYSISFORECAST_PHY_LR_004_011]. The product is updated biannually provinding six-month extension of the time series. '''DOI (product) :''' https://doi.org/10.48670/moi-00059
-

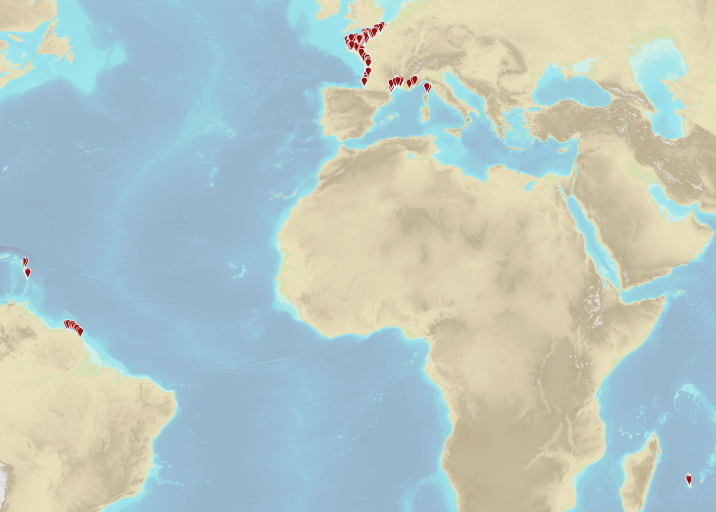
In order to better characterize the population structure of common dolphins (Delphinus delphis) in the Bay of Biscay, a single digest RADseq (SbfI enzyme) protocol was used to obtain paired-end, 150bp NGS sequences on the Illumina NovaSeq 6000 sequencing platform. D. delphis samples from the Western North Atlantic, and samples from three other delphinid species were included as outgroups.
-
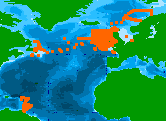
The Shom uses a 2D barotropic version of the HYCOM code (https://hycom.org/) to compute water level /surge forecasts (astronomical tides and meteorological surges) for the Atlantic, Mediterranean, Antilles-Guyane and Indian Ocean domains. The configurations use curvilinear grid with resolutions of several km offshore and ranging from 1.5km to around 500m on the french mainland coasts and the Antilles-Guyana coast. A downscaling by nesting allows a resolution of 800m to 200m over the Indian domain. These models have been adapted by the Shom to be operable in coastal areas by taking into account, in particular, the tide and high resolution bathymetry in these areas (from 100m for DTMs of facade to 20m for coastal DTMs) using Litto3D surveys by airborne LIDAR. The models are operated by Météo-France and the Shom in the framework of the HOMONIM project for the coastal flood/wave warning system.
-
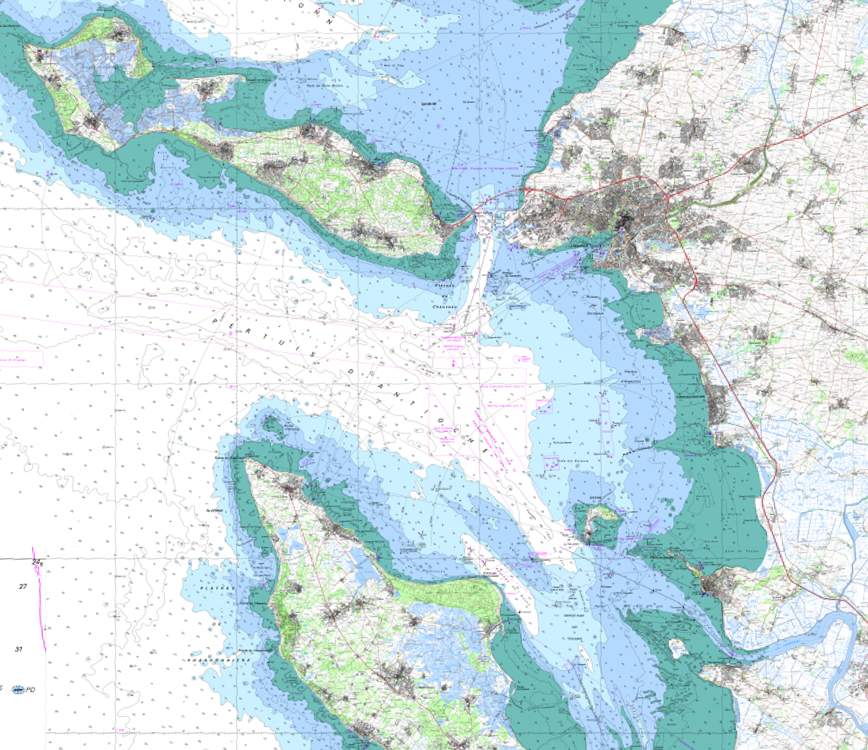
The product SCAN Littoral® is a collection of continuous colour digital map images of the coast, obtained via georeferenced assembling with grid squares of raster data from Shom nautical charts and IGN 1:25,000 land maps. The SCAN Littoral® solution includes a series of digital images with no additions, legends or georeferencing information.
-
210Pb, 226Ra and 137Cs were measured by non-destructive gamma spectrometry on marine sediment cores, collected during RIKEAU 2002 cruise on board r/v Thalia, on the shelf of the Bay of Biscay
-
-